BTC Aims to Reclaim $60,000 — How Long Will This Bull Market Last?
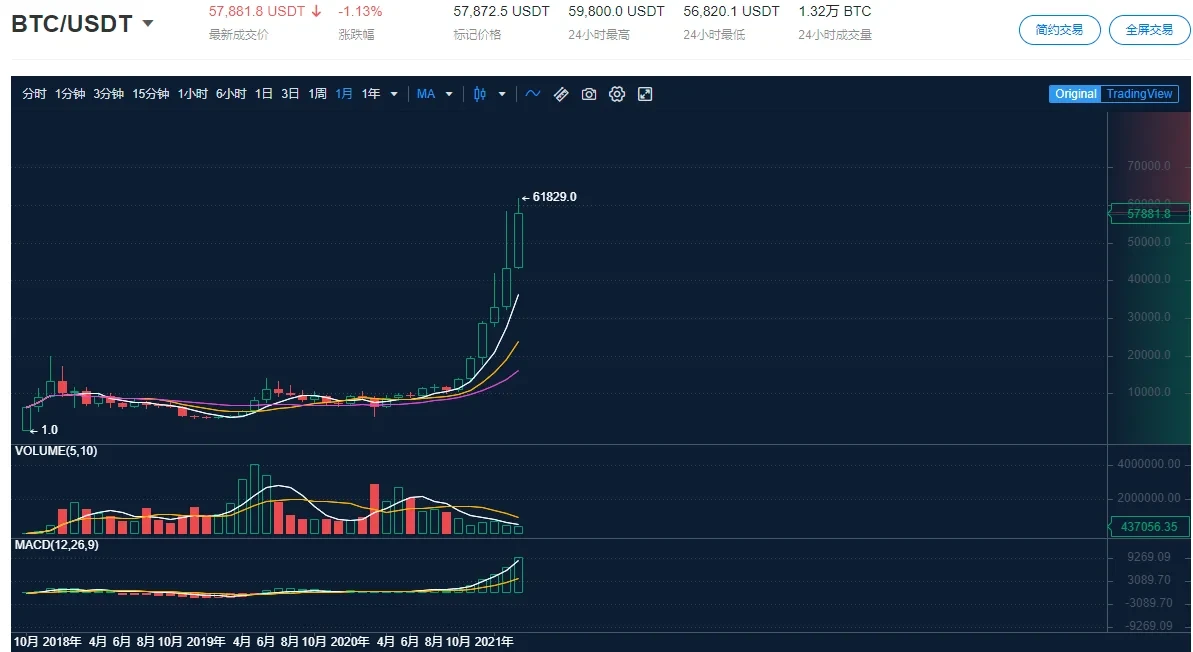
With less than one day left in March, OKX real-time market data shows that BTC achieving a monthly six-month winning streak is essentially a foregone conclusion. Historically, BTC's six-month winning streak has occurred only twice (excluding this time).
Starting from last October, the crypto world has embarked on an unprecedented mega bull market. At this stage of the market, alongside excitement, another sentiment is quietly emerging: Can BTC break its historical record and achieve seven consecutive monthly gains, or even more? In this grand bull market, will we witness one BTC reaching $100,000?
As of press time, BTC was trading at $57,881.8, still 72.77% away from the widely anticipated $100,000 milestone.
Long-Term Holders Slow Down Selling, New HODLers Continue Accumulating
From July 2010 to present, according to data from Brave New Coin, BTC has experienced three monthly six-month winning streaks. Beyond this current instance, the previous two occurred from March 2012 to September 2012 (the only seven-month streak) and from November 2012 to April 2013.
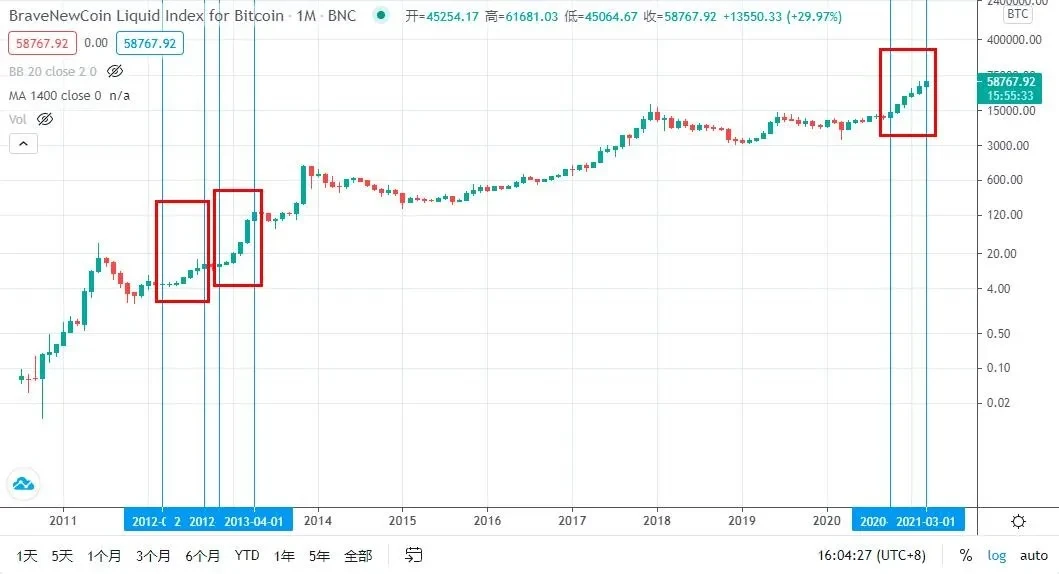
During the first six-month winning streak, BTC rose from $4.86 to $12.40, a gain of 155.14%. During the second streak, BTC surged from $11.14 to $137.83, an 11-fold increase. As for the third occurrence, BTC climbed from $10,781.77 to $57,881.8, a gain of 436.85%.
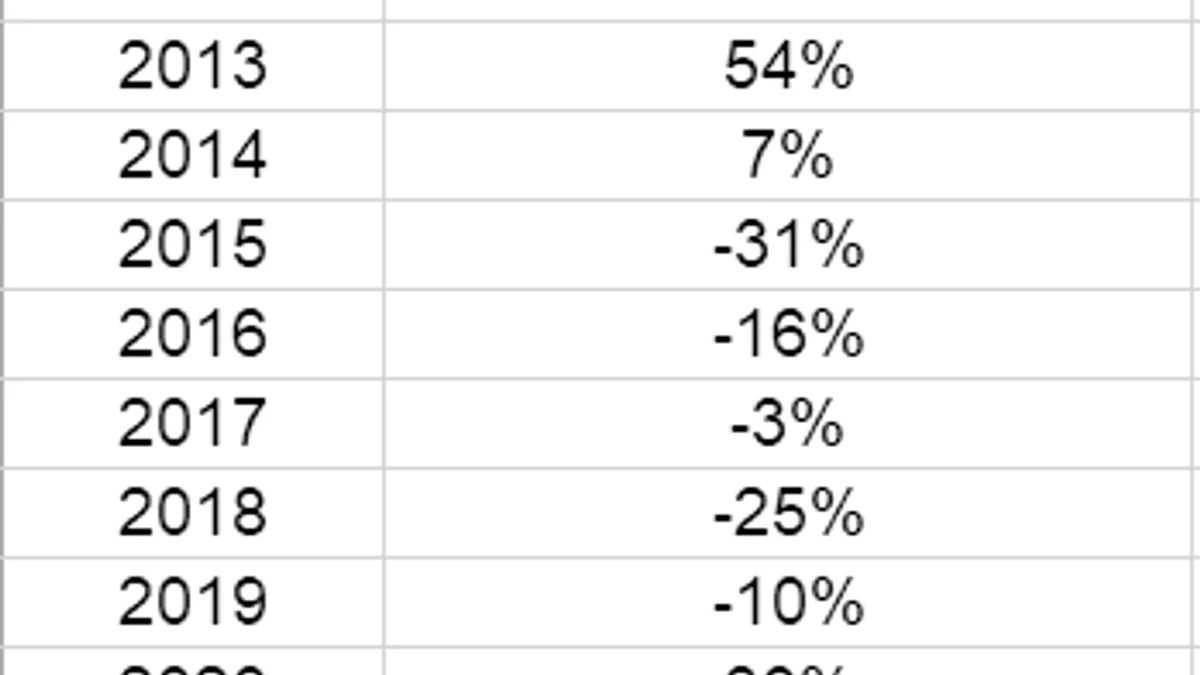
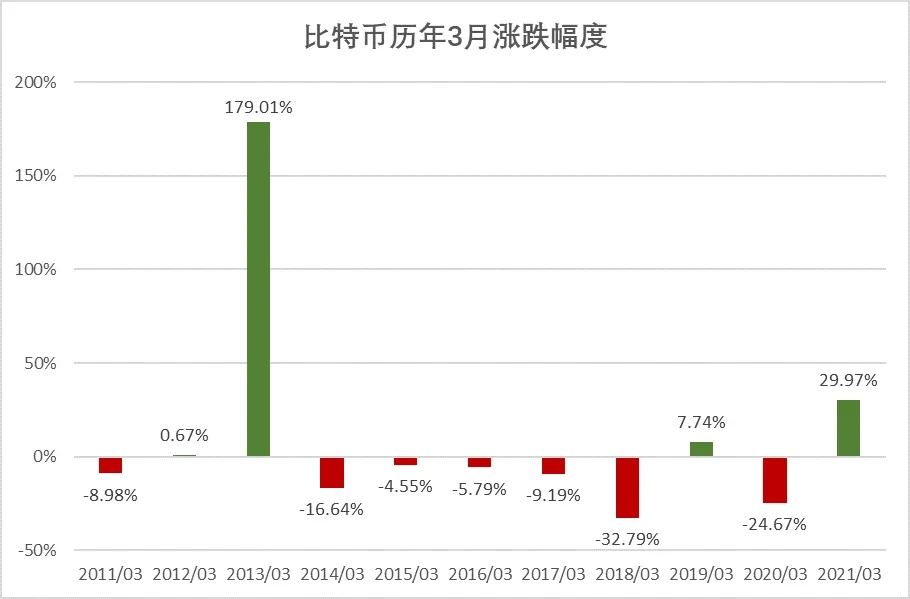
Looking back at historical March performance, from 2011 to 2020, over a span of 10 years, March closed higher only 3 times and lower 7 times. This year's March will essentially close higher.
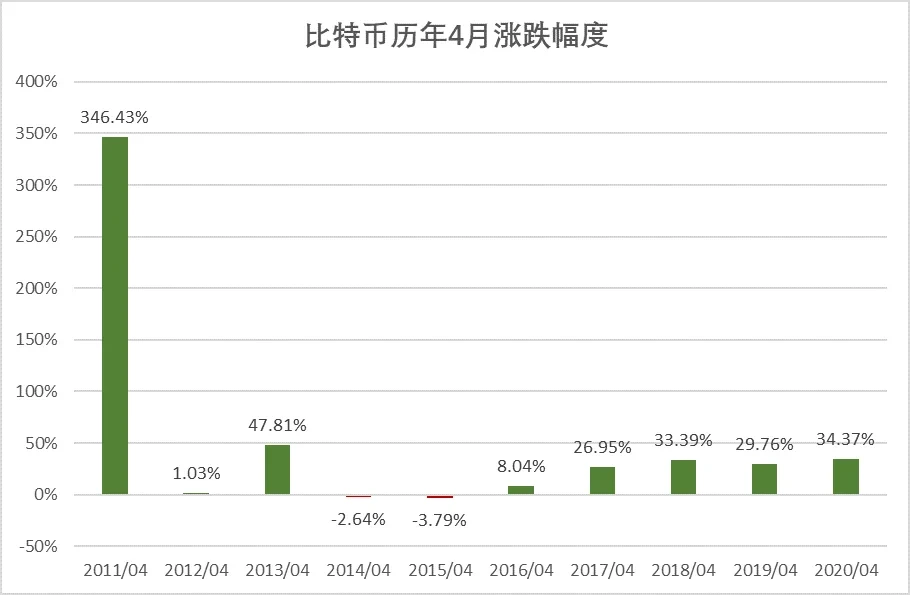
Comparing April data across the years, BTC has closed higher in April 8 times out of 10 years, with only 2 closes lower. This shows that historically, April has been a relatively strong month for BTC.
While BTC's current trajectory will not perfectly mirror history, considering the global money printing spree, major traditional financial institutions have been actively building Bitcoin trading and payment channels for companies, high-net-worth individuals, and retail investors. Examples include Visa announcing support for cryptocurrency payments at checkout, PayPal launching cryptocurrency checkout services, Morgan Stanley offering Bitcoin fund investments for institutions and high-net-worth clients, and General Motors considering Bitcoin as a payment method. Additionally, many star projects in popular sectors are set to launch sequentially starting from April. Therefore, many in the industry hold optimistic expectations for April, believing that the crypto space will welcome a new season of harvest beginning in April. On-chain data also supports this view.
Glassnode's latest weekly report reveals two key insights: First, BTC long-term holders have significantly slowed down their BTC selling pace. Second, new HODLers are maturing, tending to accumulate rather than sell.
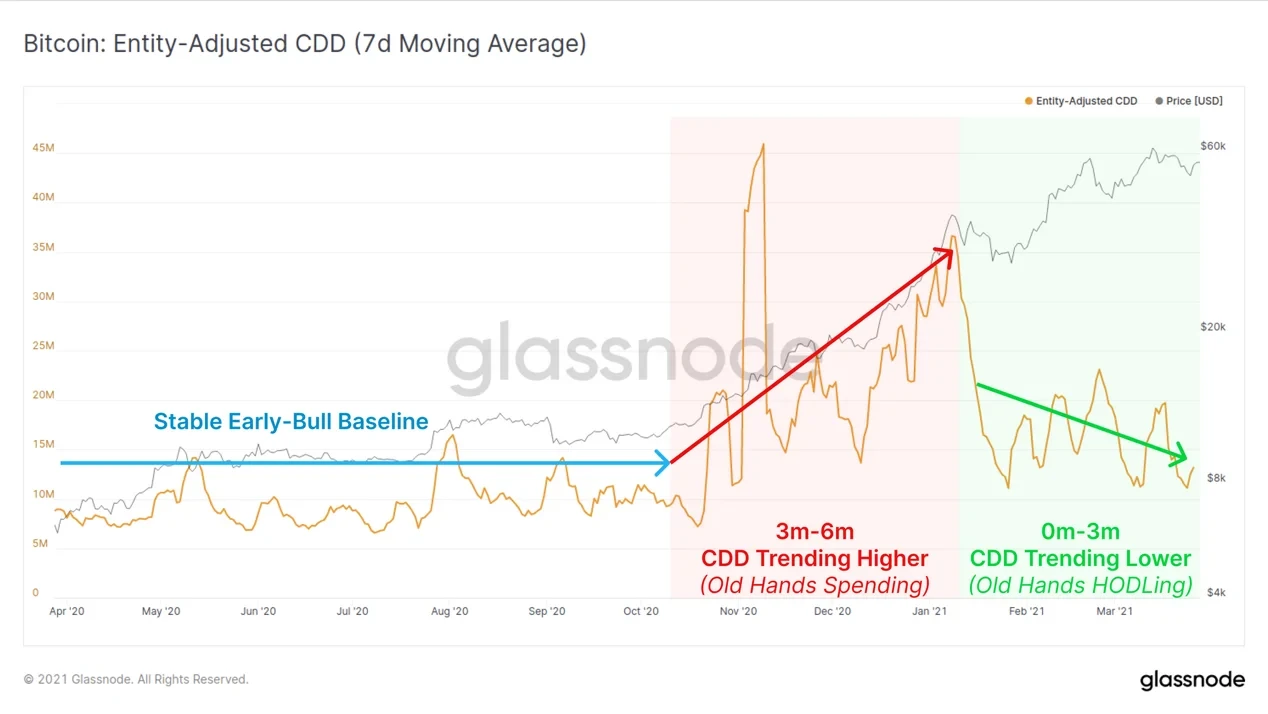
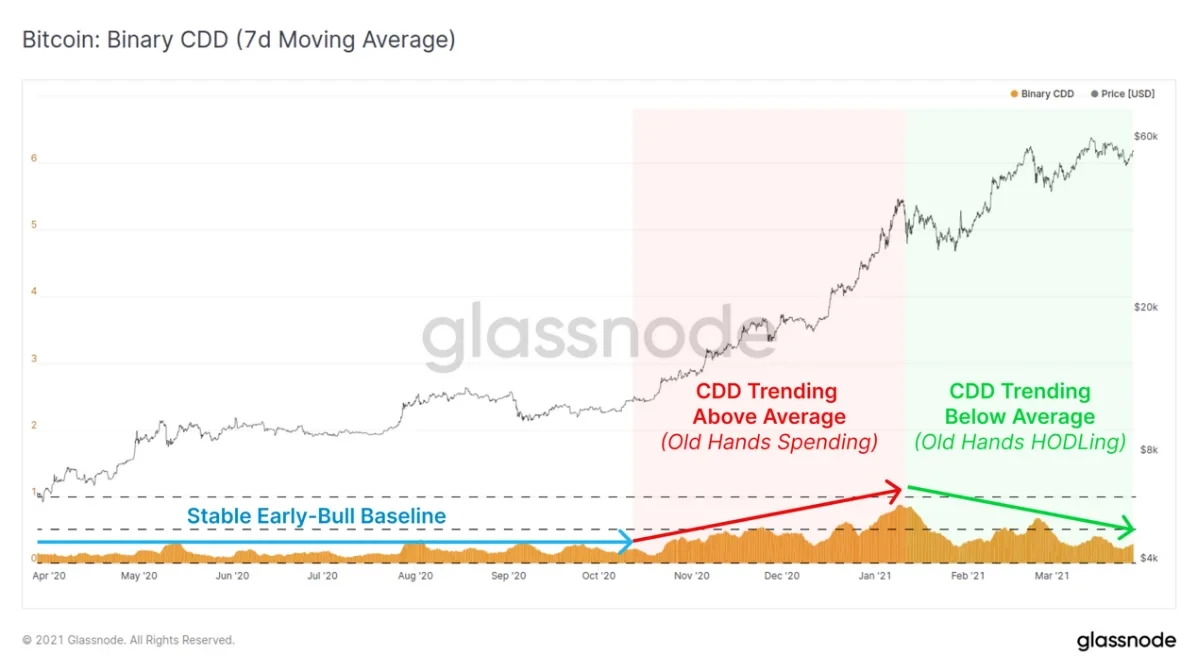
Coin Days Destroyed (CDD) is considered a metric for measuring long-term holders. The principle is that if BTC is not moved for one day, one coin day is accrued. When it is moved, the accumulated coin days are reset to zero, or "destroyed." The coin days destroyed for any trade equals the number of coins moved in that trade multiplied by the number of days those coins remained unmoved.
Therefore, when long-term holders reduce their BTC holdings, the trend rises, as shown in the red zone in the chart below. When long-term holders hold their BTC, the trend declines, as shown in the green zone.
The CDD indicator shows that over the past three months (green zone), long-term holders have significantly reduced the frequency of selling BTC, particularly in recent times. The CDD indicator has even recovered to levels similar to the early-stage bull market baseline of 2020.
The Binary Coin Days Destroyed (Binary CDD) metric also supports this view. This indicator primarily measures whether the number of coin days destroyed is greater than or less than the long-term average. The chart below shows that over the past three months (green zone), the coin days destroyed trend has been below average, indicating that long-term holders are holding more than they are selling.
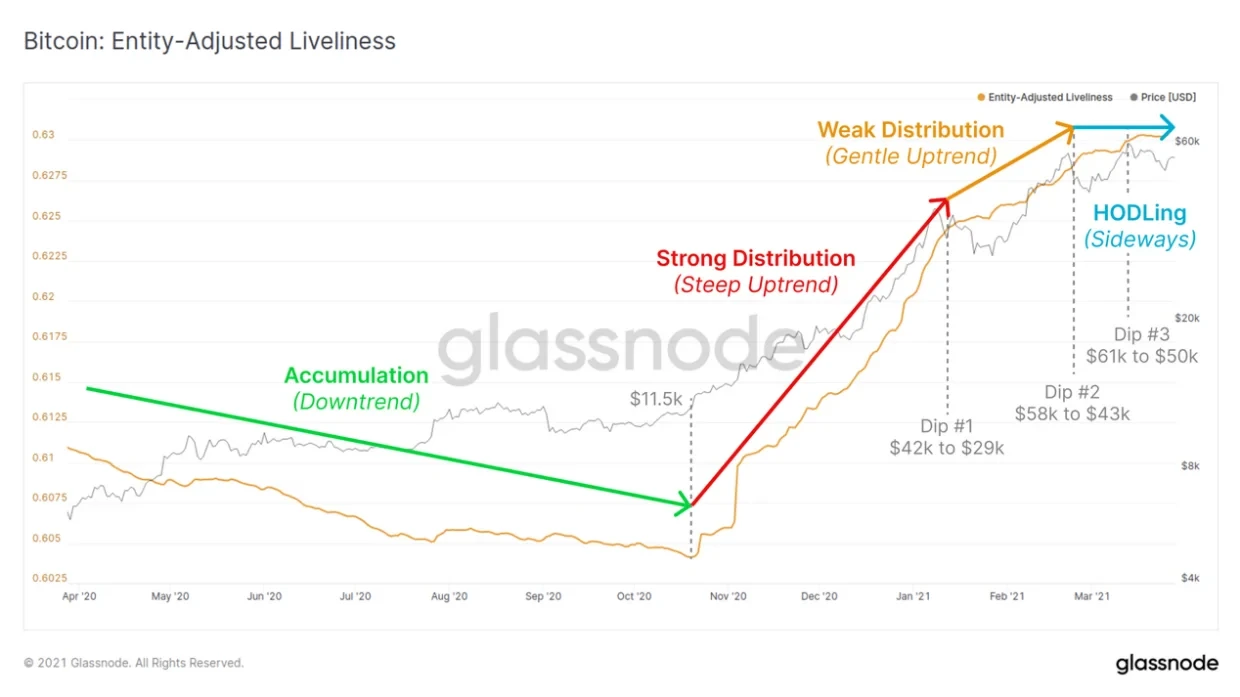
Additionally, on-chain activity metrics offer further insights. Activity rises when long-term holders sell BTC and declines when they hold. As can be seen, in the green zone, activity is relatively low, indicating HODLing dominates. During BTC's surge from $5,000 to $40,000, activity spiked sharply, suggesting long-term holders began deploying their BTC. Recent data (blue zone) indicates an increase in holding behavior.
On one hand, long-term holders are slowing their selling pace; on the other, short-term traders are inclined to accumulate BTC. From the HODL Waves chart, we can see that the proportion of coins held for 1–6 months has shown a notably accelerating trend over the past three months. From 16.99% three months ago to 25.63% now, an increase of 8.64%. Some analysts believe that once the holding period exceeds 5–6 months, those BTC are very likely to enter a dormant state.
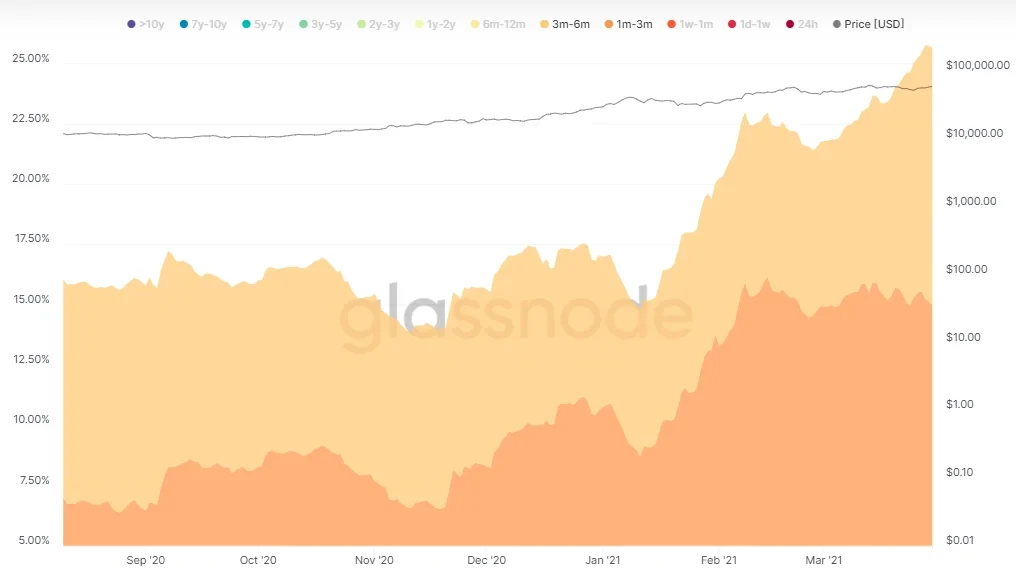
Six months ago, BTC's price was $10,777. Three months ago, it was $28,780. One month ago, it was $43,392. Currently, BTC with a cost basis between $10,777 and $43,392 (i.e., holding period of 1–6 months) accounts for 25.63% of the entire HODL Waves, and the trend appears to be continuing upward. This indicates that new HODLers are gradually maturing.
Multiple Indicators Suggest the Bull Market Will Continue for a Significant Period
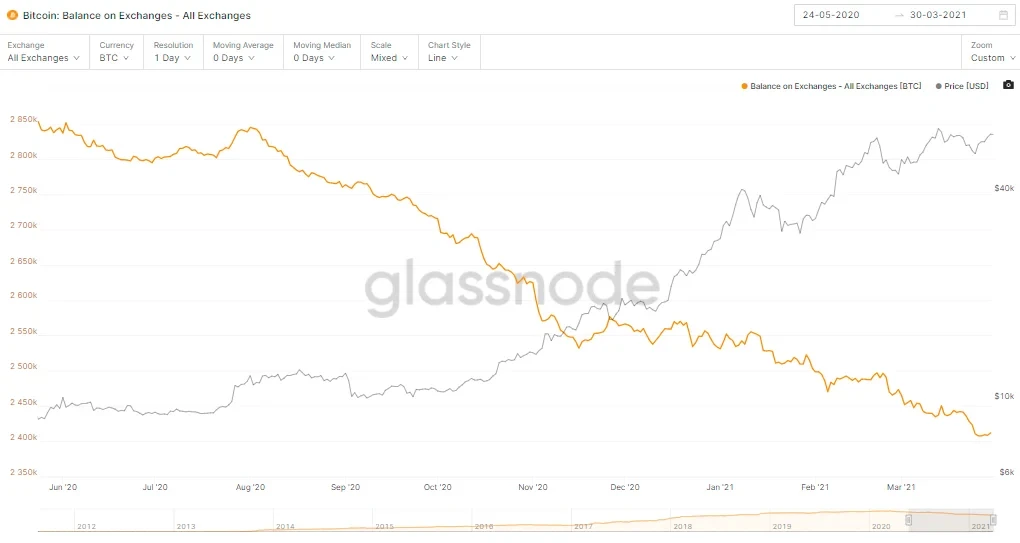
Corresponding to the increase in HODLers is the reduction in exchange-held BTC. It is generally believed that large traders conduct trading through cryptocurrency exchanges. The more BTC held by exchanges, the more bearish the outlook; when exchange-held BTC declines, it indicates users prefer withdrawing from exchanges to hold.
Glassnode data shows that since the start of this bull market, exchange BTC balances have been on a continuous downtrend.
However, we must always remind ourselves to respect the market and remain vigilant. After all, starting from October 2020, BTC has already achieved a monthly six-month winning streak. Where exactly does the market stand now? How much longer will this rally last?
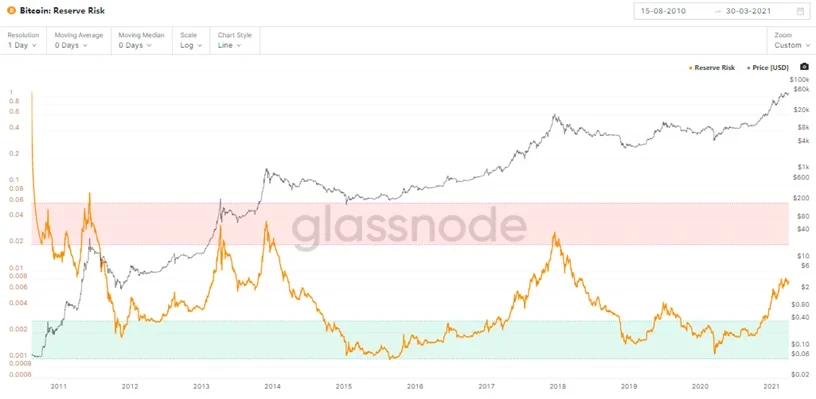
One of the most commonly used indicators in the market is Reserve Risk. This indicator is derived from Coin Days Destroyed (CDD). We can calculate how many days the BTC being transferred that day had remained dormant before being moved, based on on-chain activity. If this value is high, it means coins that had been dormant for a long time are being traded—meaning long-term holders have chosen to reduce their positions. Based on this value, if users choose to hold Bitcoin and accumulate (HODL Bank) over time by choosing not to sell, the HODL Bank grows larger. Therefore, Reserve Risk = BTC Price / HODL Bank.
When this indicator enters the red zone (high price, low confidence), it signals a selling opportunity. When it enters the blue zone (low price, high confidence), it is a suitable buying opportunity. Currently, the indicator is around 0.008, far below the highs above 0.02 seen during the peak bull market euphoria of December 2017, December 2013, and June 2011. This shows that long-term holders still have confidence in BTC.
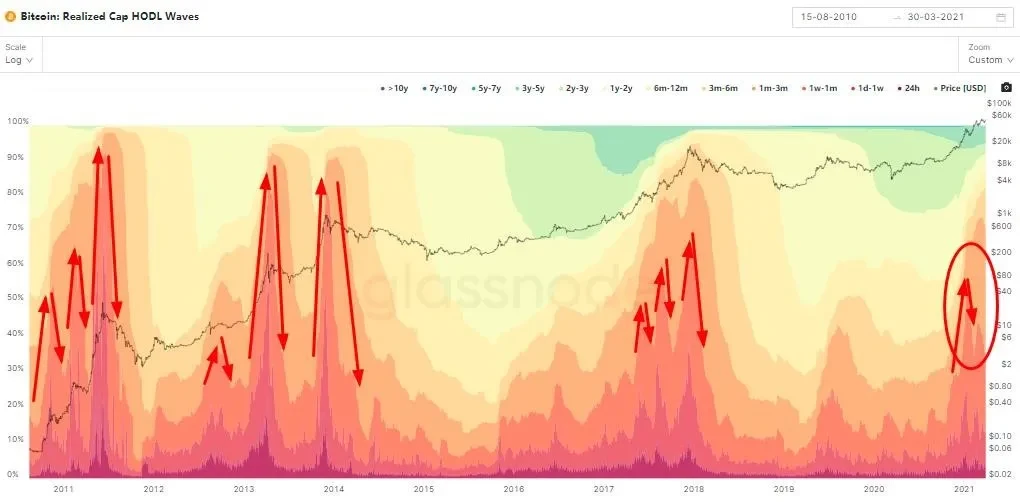
Before introducing the next indicator, we need to introduce a concept — Realized Cap. Proposed by Coin Metrics, it calculates value based on the price of BTC at its last on-chain transfer. For example, if a BTC's last on-chain trade price was $2,500, then from the realized cap perspective, its value is $2,500, not the current market price.
Realized Cap HODL Waves is derived by weighting the HODL Waves mentioned above with the realized market cap. We can see that previous bull markets all experienced three peaks, with each peak taller than the last, and significant corrections occurred between each peak. Currently, we appear to be at the stage where the first peak has ended and the second peak is beginning.
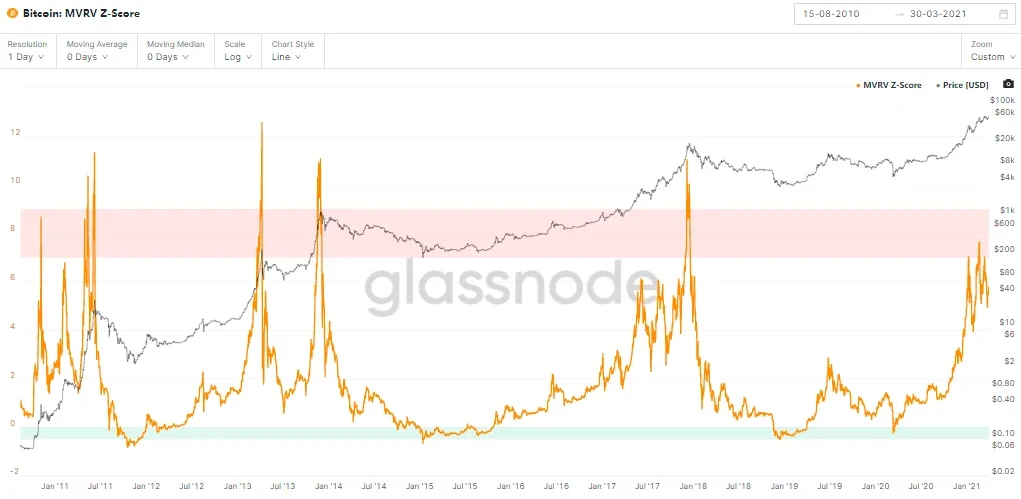
Another indicator based on realized market cap is the MVRV Z-Score, which measures the deviation between market cap and realized cap. From historical data, when the Z-Score enters the red zone, it signals the bull market has entered its final push phase with inflated prices. When it enters the blue zone, it represents a buying opportunity. Currently, the Z-Score still has some distance before entering the red zone.
For now, long-term holders have significantly reduced their BTC selling pace, new HODLers continue to accumulate, and various data indicators are positive. It is evident that this bull market will persist. However, the indicators mentioned in this article represent only a fraction of the vast array of analytical tools available, and each indicator has its limitations and controversies. While observing on-chain indicators and reviewing historical data is undoubtedly fascinating, mechanically applying them to trading is not advisable. Therefore, we encourage everyone to use these indicators as supplementary signals and apply them flexibly in conjunction with the broader macro context.
Disclaimer: Digital asset trading involves significant risk. This material should not be relied upon as an investment decision-making basis, nor should it be construed as advice on engaging in investment trading. Please ensure you fully understand the risks involved and invest cautiously. The OKX Academy provides information for reference only and does not constitute any investment advice. All investment activities by users are unrelated to this site.
Disclaimer
This article may contain product-related content not applicable to your region. This article is committed to providing general information only and does not accept responsibility for any factual errors or omissions. This article represents the author's personal views only and does not represent the views of OKX. This article is not intended to provide any advice, including but not limited to: (i) investment advice or investment recommendations; (ii) offers or solicitations to purchase, sell, or hold digital assets; or (iii) financial, accounting, legal, or tax advice. Holdings in digital assets (including stablecoins) involve high risk and may fluctuate significantly, or even become worthless. You should carefully consider whether trading or holding digital assets is suitable for you based on your financial situation. For questions specific to your circumstances, please consult your legal/tax/investment professional. The information provided in this article (including market data and statistics, where applicable) is for general reference purposes only. While all reasonable precautions have been taken in preparing such data and charts, we assume no responsibility for any factual errors or omissions expressed herein. © 2025 OKX. This article may be reproduced or distributed in its entirety, or excerpts of 100 words or less may be used, provided that such use is non-commercial in nature. Any reproduction or distribution of the full article must prominently state: "This article is copyrighted © 2025 OKX, used with permission." Permitted excerpts must cite the article title and include attribution, for example: "Article title, [author name, if applicable], © 2025 OKX." Some content may have been generated or assisted by artificial intelligence (AI) tools. Derivative works or other uses of this article are not permitted.
Show More
Recommended Reading

OKX Pay: Ushering in the Next Generation of Cryptocurrency Payments
The choice of tens of millions of users. Register with OKX and enjoy an exceptional trading experience and diverse wealth management products. A letter from OKX CEO Star: Today, we officially launch the first version of OKX Pay to over 100 million global users. As the industry's first truly non-custodial and compliant payment application, OKX Pay will be embedded within the OKX App and is currently available in select markets, with a full global rollout expected in the coming months.
March 22, 2026

A New Chapter: Building the Next Generation of Financial Infrastructure Together
The partnership between OKX and the Intercontinental Exchange (ICE) represents a significant milestone for OKX and holds profound meaning for the evolution of the entire digital assets market. ICE builds and operates the world's most critical financial infrastructure, including the New York Stock Exchange and global derivatives and clearing platforms. ICE's strategic investment in OKX and joining our board reflects our shared belief that digital assets technology will transform financial markets.
March 10, 2026

Celebrating Another Year of Resilience and Progress
As OKX's CEO and a builder who stays true to the original mission, I take great pride in looking back on the extraordinary growth and progress OKX has achieved this year. Despite significant challenges, 2024 was a year defined by focus, innovation, and resilience. We not only expanded and refined our products, but also made major strides in launching transparent and regulation-compliant localized businesses, while further strengthening our global management team. Notably, after going through
January 29, 2026

2025: Steady Progress Toward Financial Freedom
— A Year-End Letter to Global Users from Star, Founder and CEO of OKX "Financial freedom" is often misunderstood. It does not mean an absence of rules, but rather having the freedom to choose even when rules exist — and, when the system is truly put to the test, it remains reliable and effective. This has been our unwavering focus throughout 2025. First, I would like to express my sincere gratitude to our global customers, partners, and regulators.
January 16, 2026

OKX Officially Launches in Germany and Poland
By Erald Ghoos, CEO of OKX Europe Today is a significant day for OKX — and for crypto users across Europe. We have officially launched a fully compliant centralized cryptocurrency exchange in Germany and Poland! For us, this is more than a geographic expansion — it is a commitment to building the future of cryptocurrency the right way: secure, transparent, and tailored to local needs. If you are in Germany
October 21, 2025

Partnership Upgrade! OKX and Standard Chartered Expand into Europe
On October 15, Erald Ghoos, CEO of OKX Europe, stated that OKX is expanding its strategic partnership with Standard Chartered to the European Economic Area (EEA). Earlier this year, OKX first partnered with Standard Chartered in the UAE to launch the Collateral Mirroring program — an innovative initiative that
October 15, 2025