ETH on CEX Drops to 13.4% – Where Has All the Flowed-Out ETH Gone?
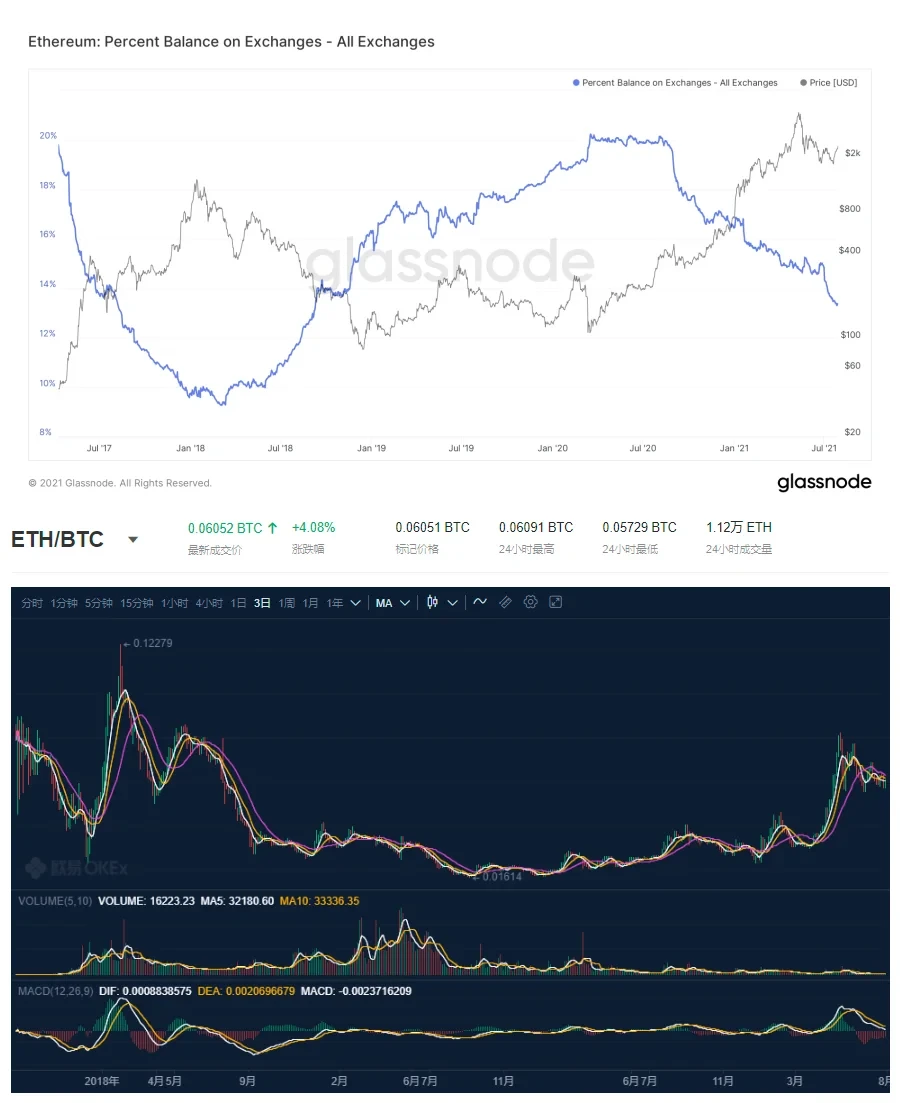
Since entering 2021, the cryptocurrency industry's attention to Ethereum has only increased. Whether it's the ETH 2.0 upgrade launched at the end of last year, the high-profile EIP-1559 proposal, or the Ethereum London upgrade coming next month that includes five important improvement proposals including EIP-1559. Similarly in secondary markets, in the past week as the broader cryptocurrency market has stabilized and recovered, Bitcoin and Ethereum, these two "leaders," have also shown solid performance. Moreover, from a market comparison perspective, ETH's momentum seems not to lose out to Bitcoin. For example, looking at the ETH/BTC exchange rate trend on the OKX platform, it has returned above 0.06, and even during the multiple significant declines since mid-May, the ETH/BTC exchange rate has never broken below 0.055. Looking at historical data, we can find that 0.055 is a very critical level in ETH/BTC exchange rate fluctuations. In the late stages of the 2017 crypto market bull run, specifically at the end of March 2018, when the ETH/BTC rate first fell from its high of 0.12279 to around 0.055, it was followed by a two-month rally until early August 2018 when the ETH/BTC rate touched 0.055 again and confirmed a decisive break below, ETH officially entered a three-year bear market.
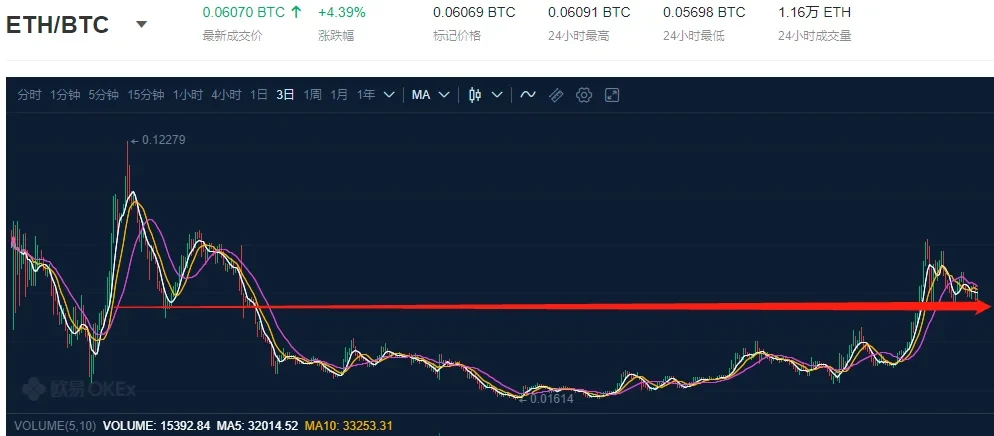
ETH/BTC exchange rate changes over the past 4 years, source: OKX
So, now that the ETH/BTC rate has once again stabilized above 0.055, let's take a fresh perspective and comprehensively re-examine ETH. Of course, this time we won't focus on ETH's price trends, but rather dig into the factors behind these movements, such as ETH's on-chain flows.
ETH Quantity on CEX Continues to Decline, Currently Only 13.4% of Circulating Supply
According to Glassnode data, since September 2020, the quantity of ETH on CEX has been continuously declining. The current total is approximately 15.5 million ETH, accounting for about 13.4% of ETH's current total circulating supply of 117 million, marking a two-year historical low. In August 2020, this ratio once reached 20.04%.
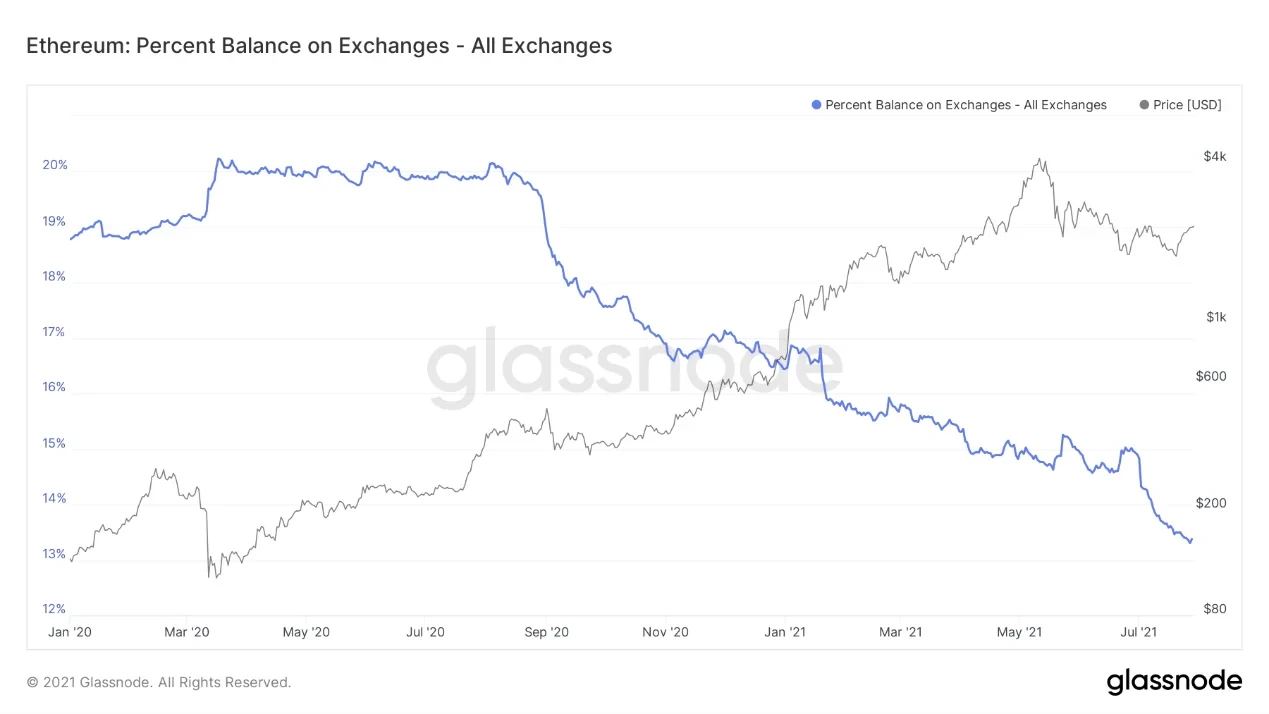
Changes in the ratio of ETH quantity on CEX to total circulating supply since January 2020, source: Glassnode
In comparison, the quantity of ETH in smart contracts, including DeFi, exceeds 30 million, accounting for 25.9% of the circulating supply. Compared to the low of 10.5% in January 2020, this represents an increase of over 146%. During the same period, the quantity of ETH staked in the Ethereum 2.0 Beacon Chain deposit also exceeded 6.6 million, accounting for 5.7% of the circulating supply. It's worth noting that it took only 8 months for Ethereum 2.0 Beacon Chain deposits to reach this scale.
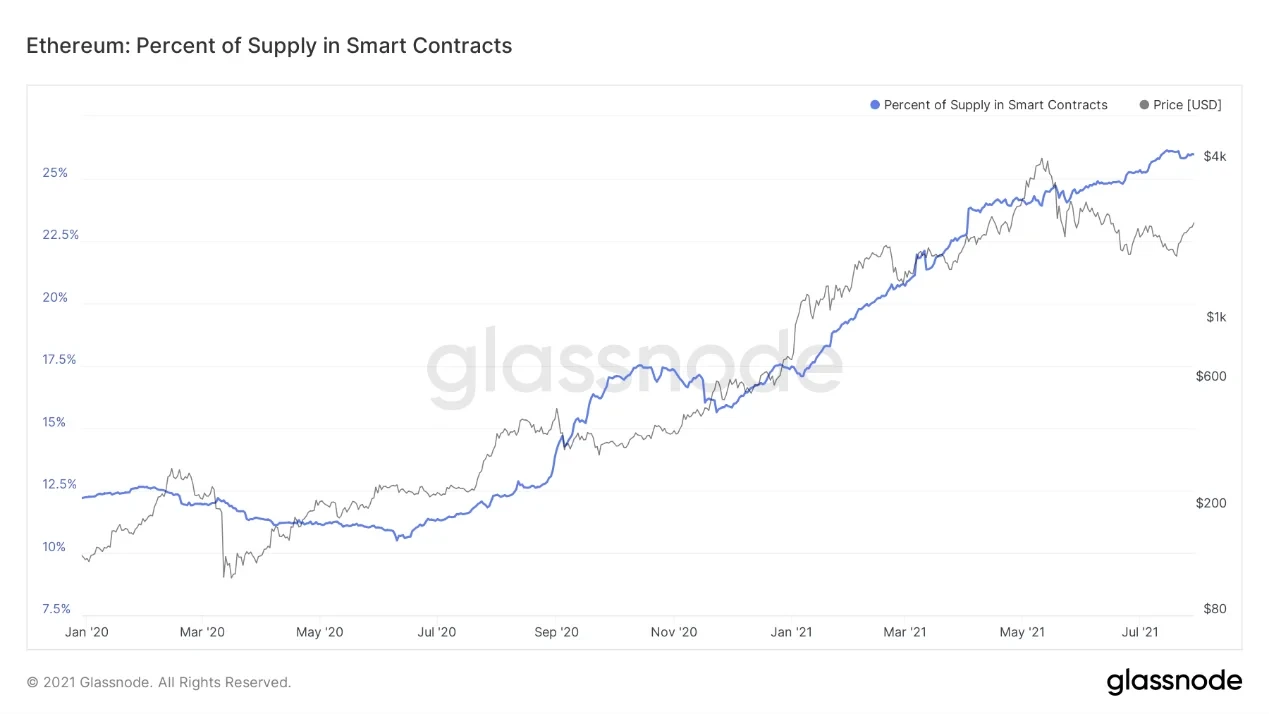
Changes in the ratio of ETH quantity in smart contracts to total circulating supply since January 2020, source: Glassnode
Not only ETH, but looking at Bitcoin's on-chain flows, there seems to be a similar situation. According to Glassnode data, over the past year or so, the ratio of Bitcoin quantity on CEX to total circulating supply has also shown a downward trend, dropping from 17.04% in March 2020 to the current 12.67%.
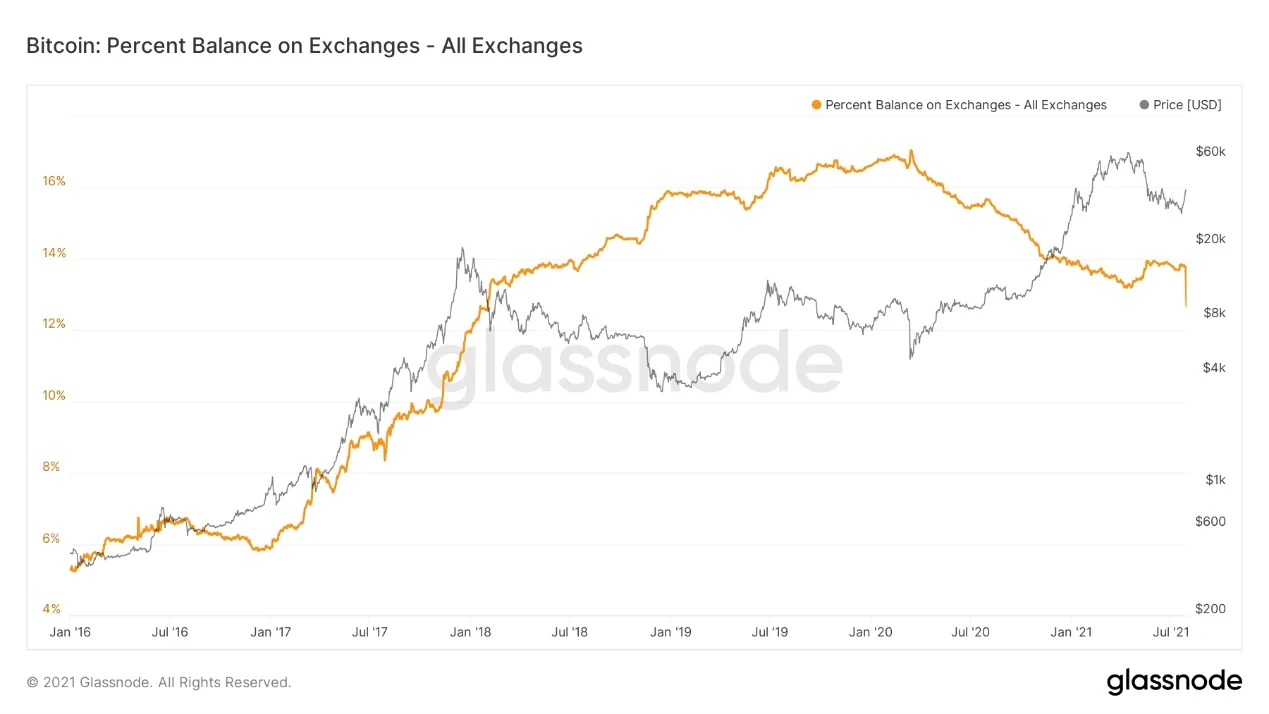
Changes in the ratio of Bitcoin quantity on CEX to total circulating supply over the past 5 years, source: Glassnode
Combining the ETH/BTC rate mentioned at the beginning with a further look at the historical ratio of ETH quantity on CEX to total circulating supply. First, extending the cycle, we can find that in the last bull market cycle, the cyclical low of the ratio of ETH quantity on CEX to total circulating supply coincided in time with when the ETH/BTC rate first touched 0.055, both appearing in March 2018. Then, for most of the time, the trends of these two indicators often showed a negative correlation. However, it's important to note that this conclusion is based only on the recent two major cycle changes, and whether it remains valid in the future requires further observation.
Where Has the ETH Flowed Out from CEX Gone?
From the charts above, we've already discovered that the outflow of ETH from CEX is not a short-term behavior, but began in August 2020. That is, over the past year, ETH has been continuously flowing out of CEX. So where has this flowed-out ETH gone?
In addition to the smart contracts and ETH 2.0 Beacon Chain staking deposits mentioned above, notable inflow addresses include miner holdings, institutional investor holdings, and of course, the remaining focus is on the vast number of small and medium-sized crypto asset investors. Let's track each of these next.
First, let's look at smart contracts. Due to the large number of smart contracts based on Ethereum, here we'll use DeFi as a representative to get a glimpse of the changes in the quantity of ETH locked in smart contracts over the past year. According to defipulse statistics, the current quantity of ETH locked in DeFi reaches 9.8 million, an increase of over 126.5% compared to 4.325 million a year ago.
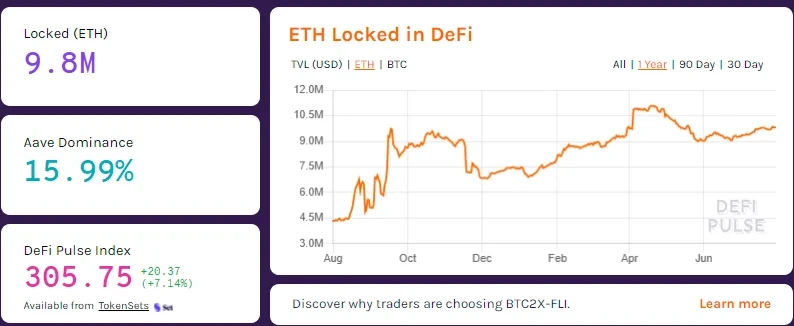
Quantity of ETH locked in DeFi over the past year, source: defipulse
Next, let's look at the changes in ETH 2.0 Beacon Chain staking deposits. According to OK Link statistics, since the launch of the Beacon Chain in November 2020, over 200,000 validators have participated in staking, and the total quantity of staked ETH has exceeded 6.45 million. Moreover, with the advancement of the ETH 2.0 upgrade, Beacon Chain staking deposits are expected to continue steadily increasing.
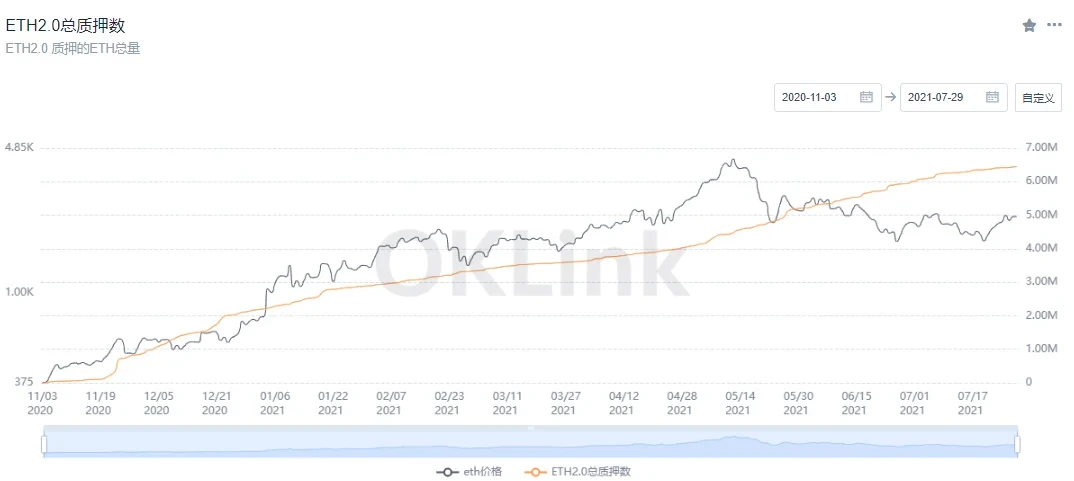
Changes in ETH 2.0 Beacon Chain staking deposits, source: OK Link
Next, let's look at miner holdings. From the OK Link statistics below, we can see that the changes in ETH miner address balances over the past year can be roughly divided into two stages. The first stage, from July 2020 to May 2021, showed a gradually decreasing trend, with address balances declining from 7.667 million to 6.846 million. The second stage, from May 2021 to present, miner address balances have begun to slowly recover, currently exceeding 7.02 million. From this set of data, ETH miner addresses have been in a net outflow state for most of the past year and cannot be considered the main destination for ETH flowing out of CEX.
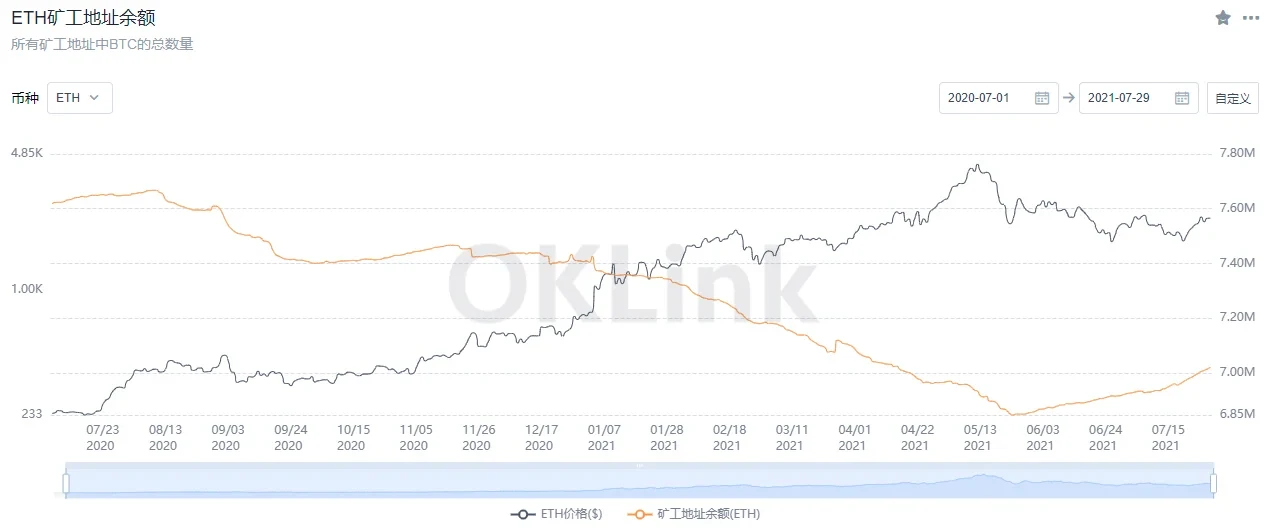
Changes in ETH miner address balances over the past year, source: OK Link
Continuing with institutional investor holdings. Among currently known institutional investors holding ETH, Grayscale firmly holds the top position with 3.15 million ETH. However, it's worth noting that Grayscale's concentrated accumulation period was between June and December 2020. Since February 2021, Grayscale has had no record of increasing its ETH holdings for five months.
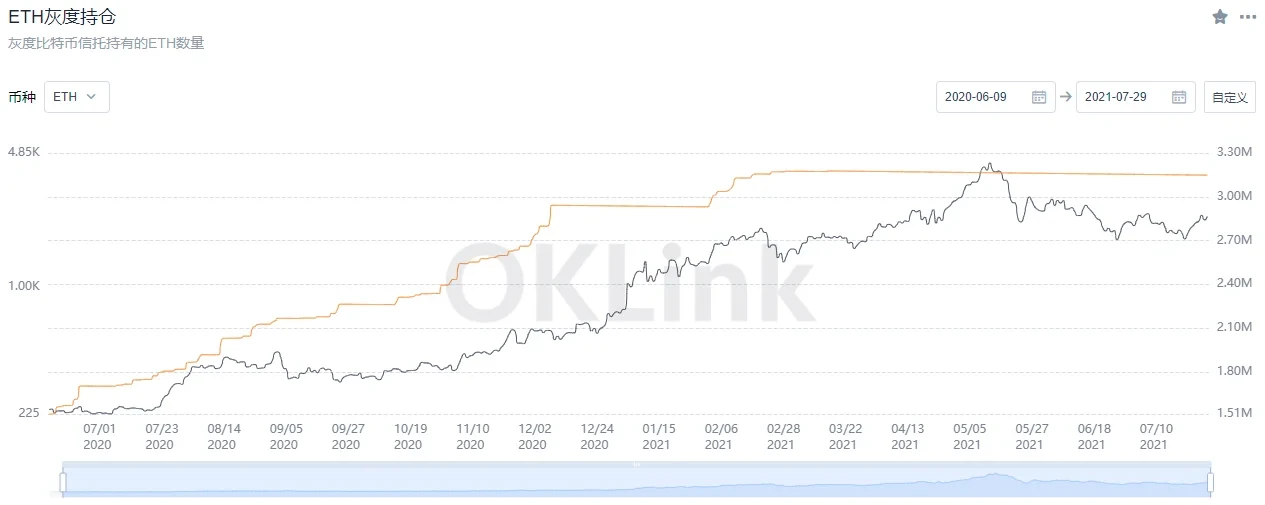
Grayscale ETH holdings changes, source: OK Link
In addition to Grayscale, other institutional investors holding over 10,000 ETH include: 3iQ CoinShares ETH ETF holds 83,400, Purpose ETH ETF holds 61,700, CI Galaxy ETH ETF holds 44,300, Evolve ETF holds 17,000 (all data referenced from OK Link). Based on rough calculations, current institutional investors hold approximately 3.3564 million ETH in total, accounting for about 3.35% of ETH's total circulating supply.
Finally, let's look at the changes in the number of addresses held by small and medium investors. It should be noted that the small and medium investors mentioned here refer to investors holding no less than 0.01 ETH and no more than 10,000 ETH. Through comparison, we've discovered a phenomenon: using a position of 10 ETH as a watershed, the number of addresses holding no more than 10 ETH has shown a clear upward trend over the past year, while the number of addresses holding no less than 10 ETH has shown a clear downward trend over the past year. Specifically:
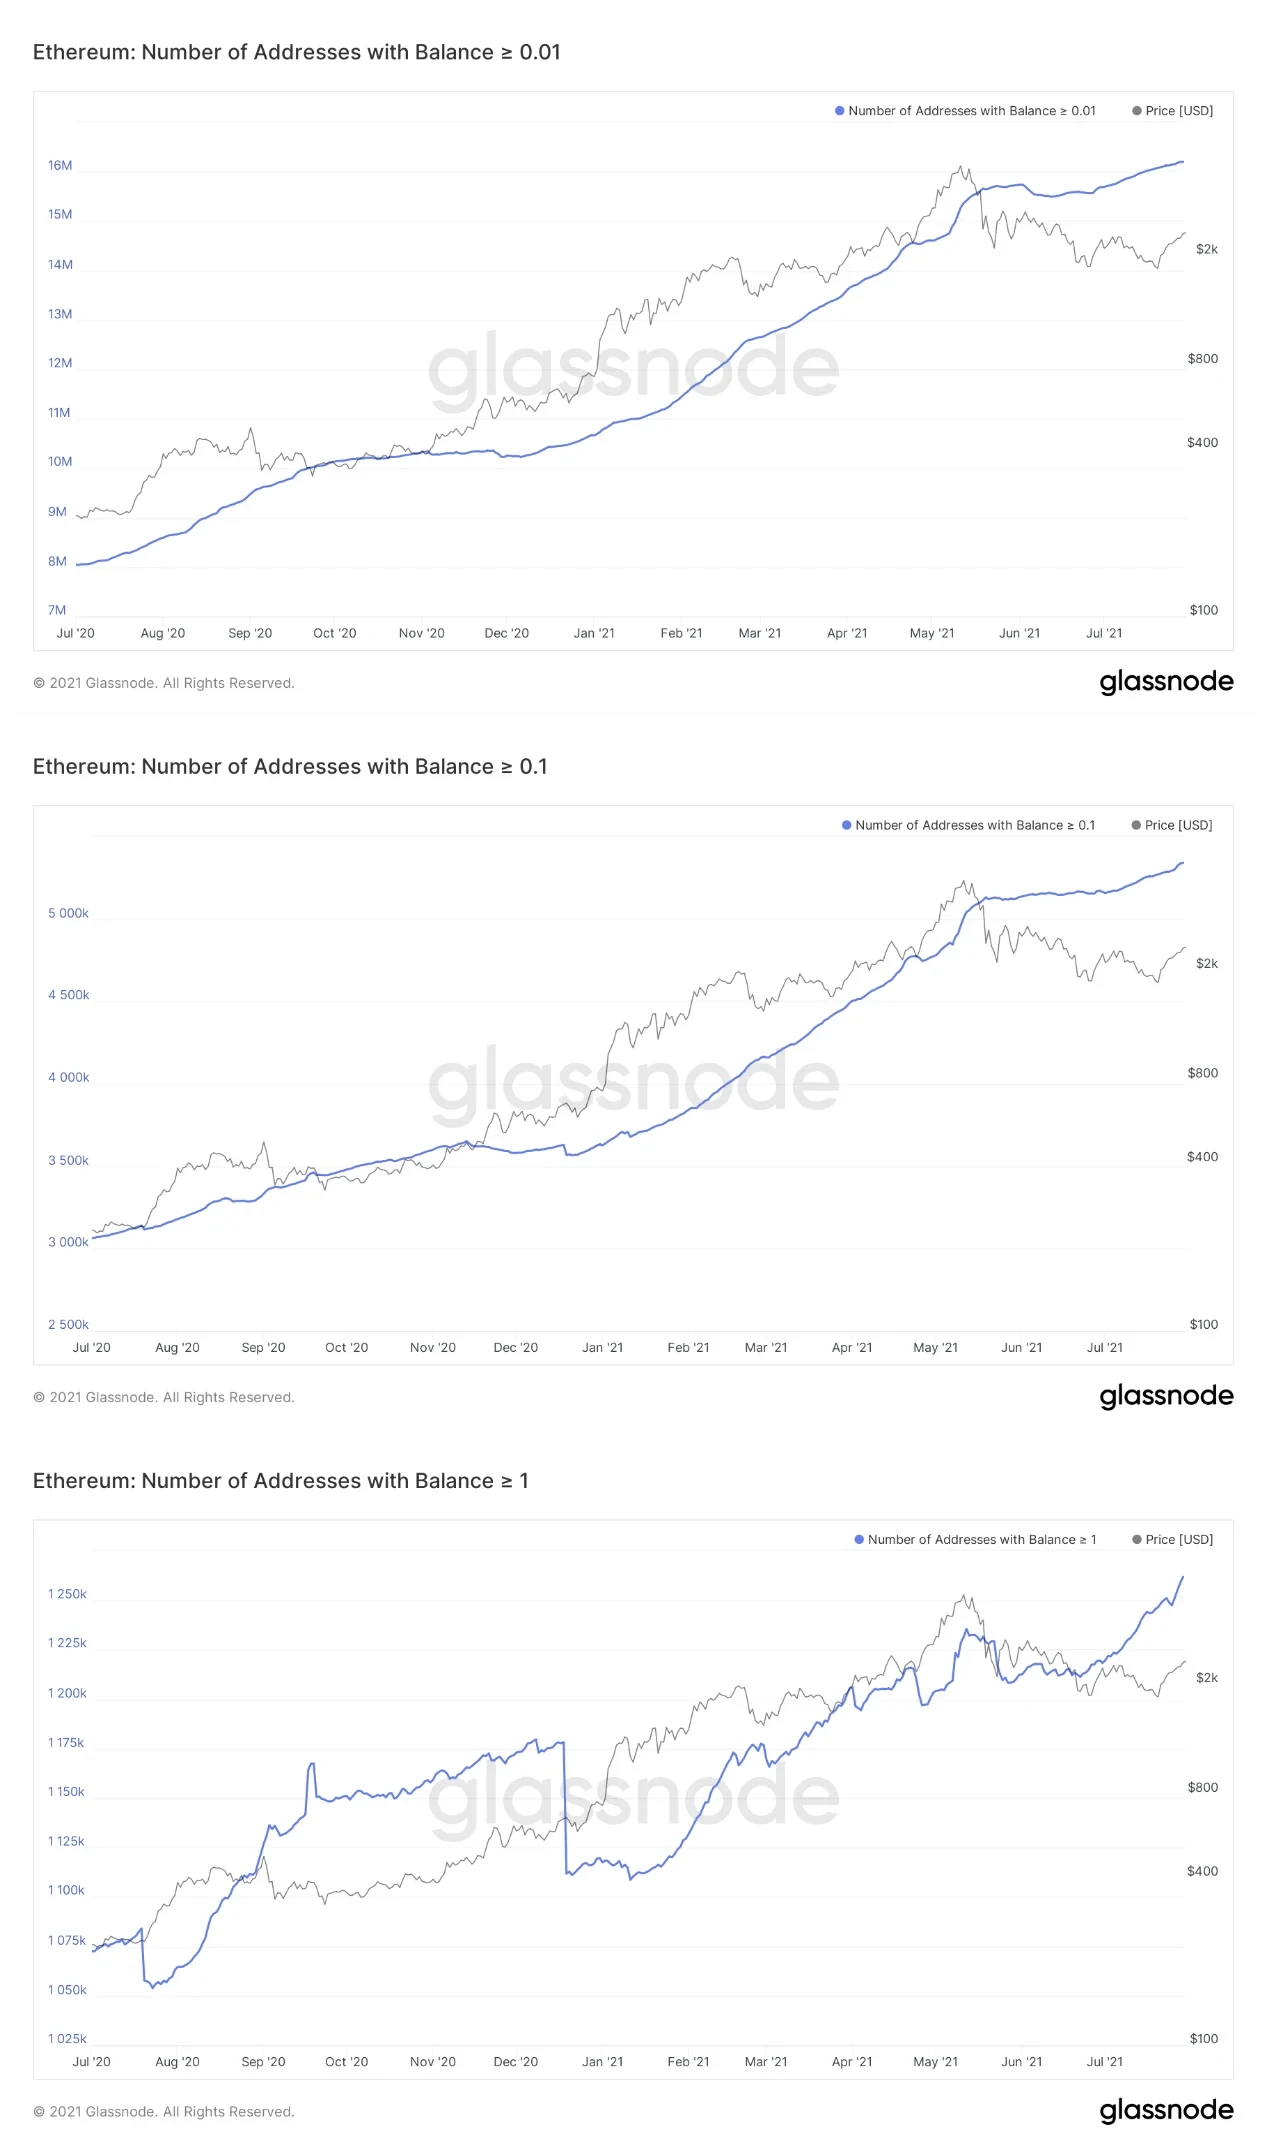
The above shows changes in the number of addresses holding no less than 0.01 ETH, no less than 0.1 ETH, and no less than 1 ETH but less than 10 ETH. Among them, the number of addresses holding no less than 0.01 ETH increased from 8.04 million to 16.2 million over the past year; the number of addresses holding no less than 0.1 ETH increased from 3.06 million to 5.34 million over the past year; the number of addresses holding no less than 1 ETH but less than 10 ETH increased from 1.05 million to 1.26 million. Compared to the address number changes in the previous two ranges, although this range experienced two relatively obvious declines, overall it still maintained a solid growth trend.
Next is the change in the number of addresses holding no less than 10 ETH.
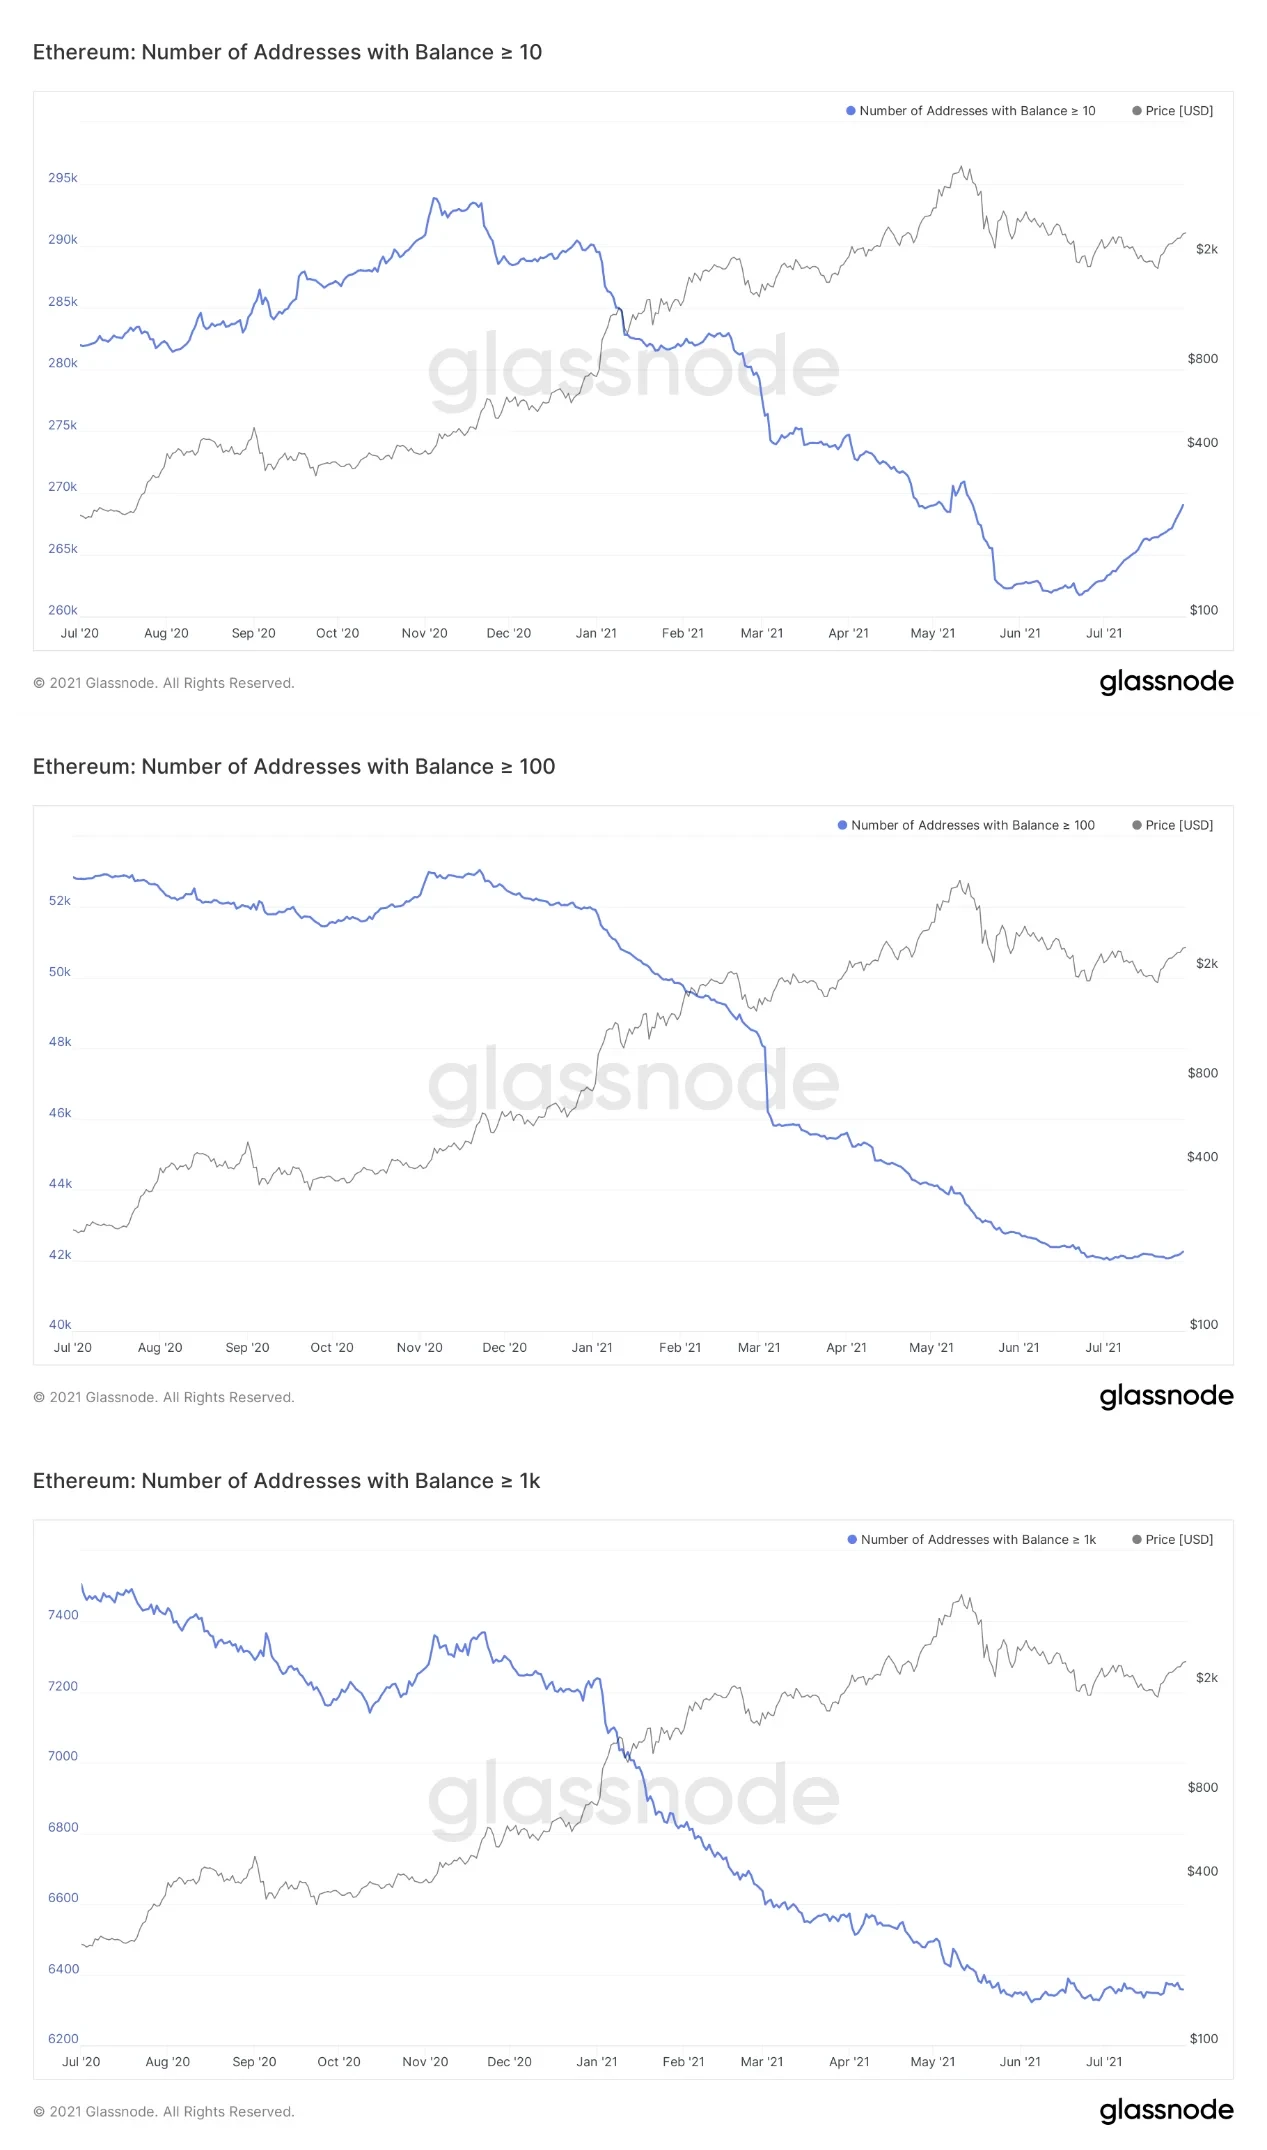
Similarly, this can be divided into three tiers: addresses holding no less than 10 ETH, no less than 100 ETH, and no less than 1,000 ETH but less than 10,000 ETH. Although from an overall perspective, the address number changes in these three ranges show a downward trend, there are still subtle differences. Specifically:
The number of addresses holding no less than 10 ETH showed a clear growth trend between July and November 2020, then showed a stepwise decrease, and began to gradually increase again starting from the end of June 2021. From a quantity perspective, it basically fluctuated between 261,000 and 294,000 addresses over the past year. The change in the number of addresses holding no less than 100 ETH was much more regular, decreasing from 53,000 to 42,000 over the past year. The change in the number of addresses holding no less than 1,000 ETH but less than 10,000 ETH, aside from one fluctuation between October and November 2020, also basically showed a steady downward trend, decreasing from 7,507 to 6,330 over the past year. From the changes in address numbers across these six ranges, we can preliminarily draw the following conclusion: accompanied by ETH's rising trend from Q2 2020 to Q2 2021, medium-sized investors holding more than 10 ETH mostly chose to take profits, while small-sized investors holding less than 10 ETH mostly chose to buy and hold. As the recent declining market stabilized and recovered, medium-sized investors holding more than 10 ETH also began to show reluctance to sell.
Conclusion
In addition to the several known factors mentioned above that may attract the proportion of ETH quantity on CEX, after the London upgrade in August, another factor should be added: the upcoming deployment of the EIP-1559 proposal. Once EIP-1559 goes live, the gas fees currently paid to miners daily will be burned, thereby exiting circulation. Ethereum developer Tim Beiko stated in an interview that once these gas fees are burned, the current approximately 4% annual supply growth of ETH will be reduced. And when switching to the new proof-of-stake mechanism next year, the supply may further decline.
Disclaimer
This article may contain content related to products that are not available in your region. This article is intended only to provide general information and does not take responsibility for any factual errors or omissions contained therein. This article represents only the author's personal views and does not represent the views of OKX. This article is not intended to provide any advice, including but not limited to: (i) investment advice or investment recommendations; (ii) offers or solicitations to buy, sell, or hold digital assets; or (iii) financial, accounting, legal, or tax advice. Holding digital assets (including stablecoins) involves high risk, may fluctuate significantly, and may even become worthless. You should carefully consider whether trading or holding digital assets is suitable for you based on your financial situation. For questions about your specific situation, please consult your legal/tax/investment professional. The information appearing in this article (including market data and statistics, if any) is for general reference only. Although we have taken all reasonable precautions in preparing these data and charts, we accept no responsibility for any factual errors or omissions expressed herein. © 2025 OKX. This article may be reproduced or distributed in its entirety, or excerpts of 100 words or less from this article may be used, provided that such use is non-commercial. Any reproduction or distribution of the entire article must also prominently state: "Copyright © 2025 OKX. Used with permission." Permitted excerpts must cite the article title and include the source, for example "Article Name, [Author Name (if applicable)], © 2025 OKX". Portions of this content may be generated or assisted by artificial intelligence (AI) tools. Derivative works or other uses of this article are not permitted.
Show More
Recommended Reading

OKX Pay: Opening a New Era of Next-Generation Crypto Payments
The choice of tens of millions of users. Register with OKX to enjoy the ultimate trading experience and diverse wealth management products. A letter from OKX CEO Star: Today, we officially launch the first version of OKX Pay to over 100 million global users. As the industry's first payment application to truly achieve non-custodial and compliant integration, OKX Pay will be embedded within the OKX App, currently available to select markets, with full rollout expected within months
March 22, 2026

New Chapter: Building Next-Generation Financial Infrastructure Together
The partnership between OKX and Intercontinental Exchange (ICE) is an important moment for OKX and equally significant for the evolution of the entire digital asset market. ICE establishes and operates some of the world's most important financial infrastructure, including the New York Stock Exchange and global derivatives and clearing platforms. This investment by ICE in OKX and joining our board reflects both parties' shared belief that digital asset technology will transform financial markets
March 10, 2026

Tribute to Another Year of Forging Ahead
As CEO of OKX and also a builder who remains true to our original mission, I am proud to look back on the remarkable growth and progress OKX has achieved this year. Despite numerous challenges, 2024 was a year filled with focus, innovation, and resilience. We not only expanded and optimized our products but also made significant progress in launching transparent and compliant localized operations, while further strengthening our global management team. Notably, after experiencing
January 29, 2026

2025: Steady Progress Toward Financial Freedom Together
— Year-end letter from OKX Founder and CEO Star to global users "Financial freedom" is often misunderstood. It doesn't mean no rules, but rather having the right to choose even when rules exist—and when the system is truly tested, it remains reliable and effective. This is exactly what we've focused on throughout 2025. First, I want to extend my sincere gratitude to our global clients, partners, and regulatory authorities
January 16, 2026

OKX Officially Launches in Germany and Poland
Author: Erald Ghoos, CEO of OKX Europe Today is a significant moment for OKX—and for crypto users across Europe. We have officially launched our fully compliant centralized cryptocurrency trading platform in Germany and Poland! For us, this is more than just geographic expansion; it's a commitment to building the cryptocurrency future the right way: secure, transparent, and meeting local needs. If you're in Germany
October 21, 2025

Partnership Elevated! OKX Partners with Standard Chartered to Expand European Market
On October 15, OKX Europe CEO Erald Ghoos stated that OKX is expanding its strategic partnership with Standard Chartered to the European Economic Area (EEA). Earlier this year, OKX first partnered with Standard Chartered in the UAE to launch the collateral mirroring program—a
October 15, 2025