Zero-Based Candlestick Learning | 1 From Price to Candlesticks
Trends have patterns, understand the language of price;
Buy and sell signals, say goodbye to emotional trading.
I. What is a Candlestick?
Today, let's learn together the most fundamental element of technical analysis—candlesticks. Candlesticks are the most common price marking method today.
First, let's look at how prices move in the market during a day.
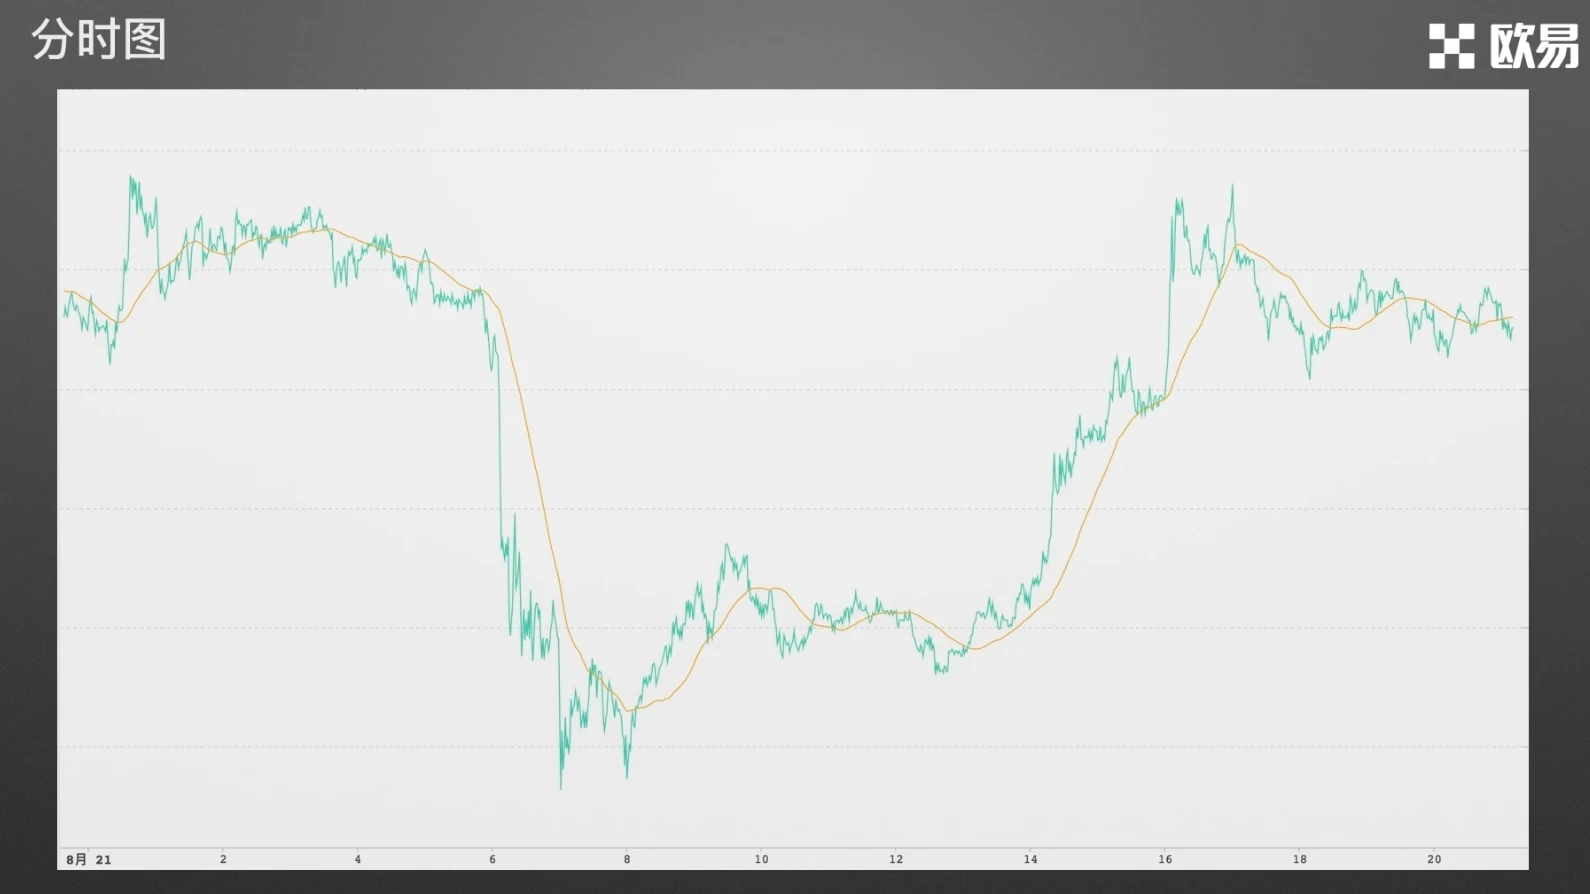
Without candlestick charting, the price of an investment product looks like this—countless prices connected together forming an seemingly irregular curve. Looks a bit messy, doesn't it?
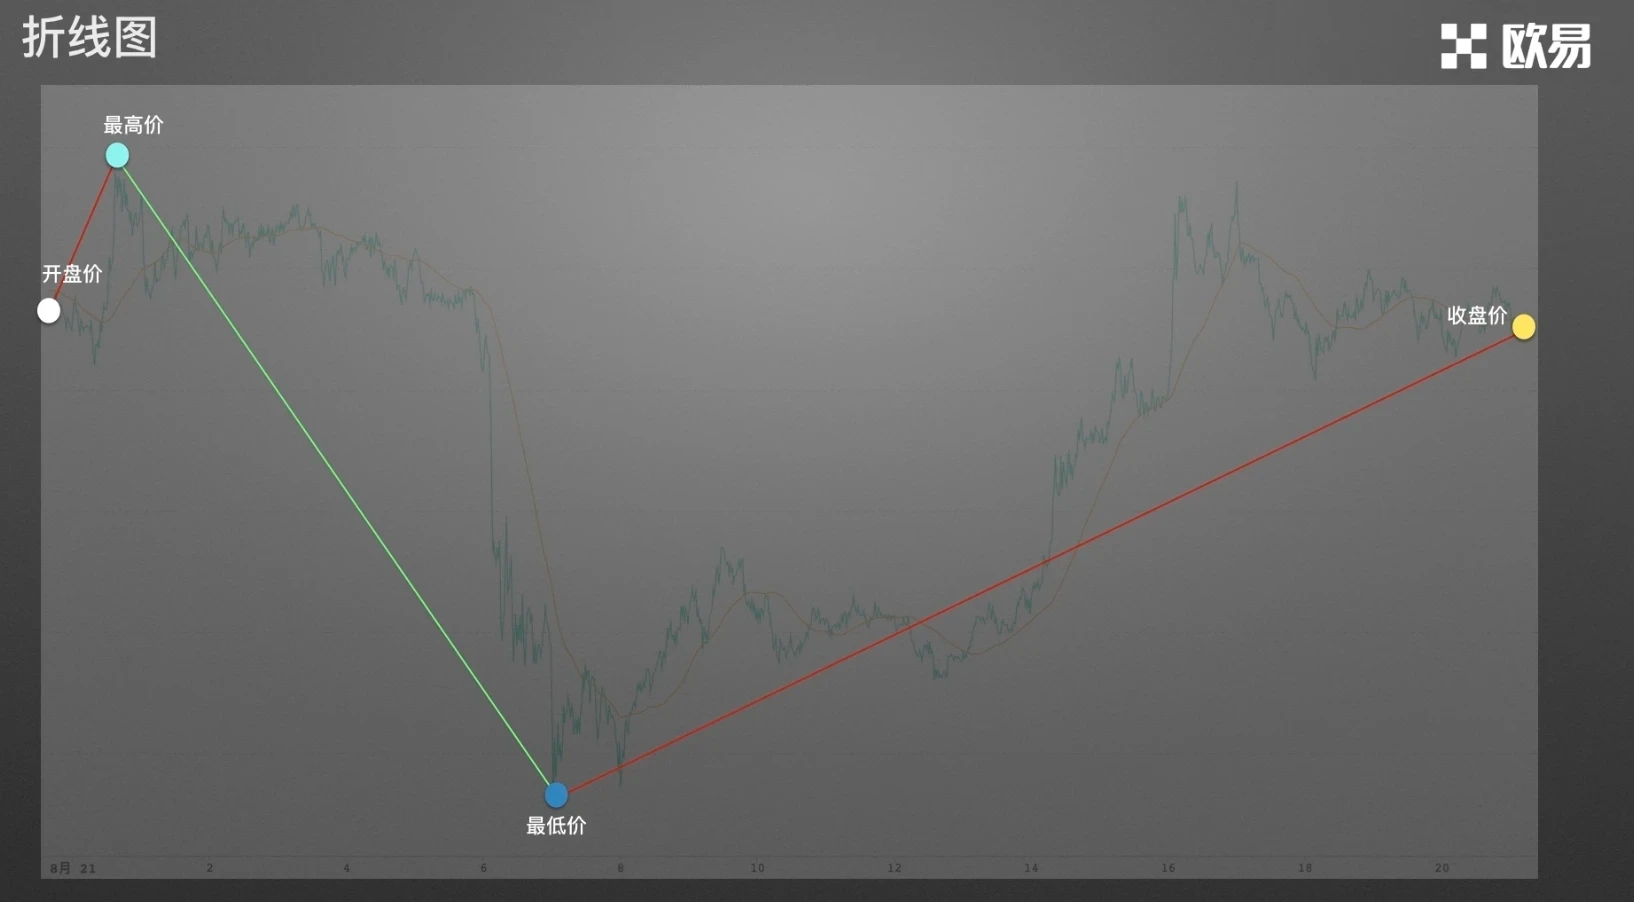
Next, let's do some simple technical analysis processing and mark the key data: opening price, closing price, highest price, lowest price. We filter out the complex price changes and plot them as a line chart. As shown in the figure, isn't this much clearer?
II. What is a Candlestick Chart?
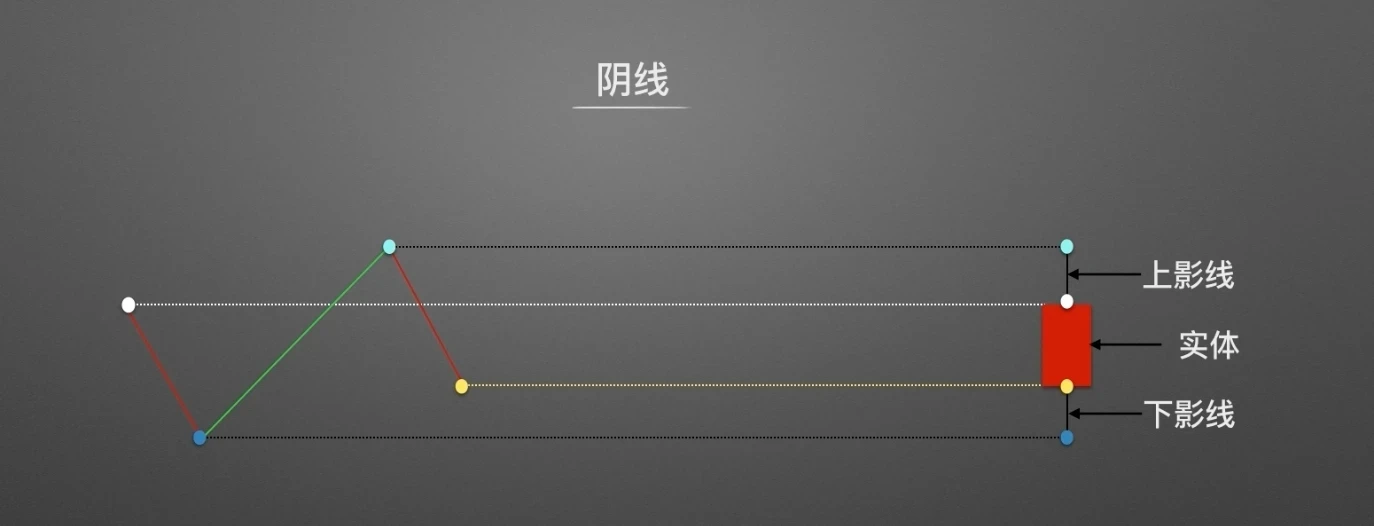
Can we represent it more simply? Of course, let's learn about candlestick charts. As shown in the figure, we process it by aligning the opening price, closing price, lowest price, and highest price on a vertical line. The area between the opening and closing prices forms the candlestick body, which we represent with a thicker line. The areas from the body to the highest and lowest prices are represented with thinner lines, forming the upper shadow and lower shadow respectively.
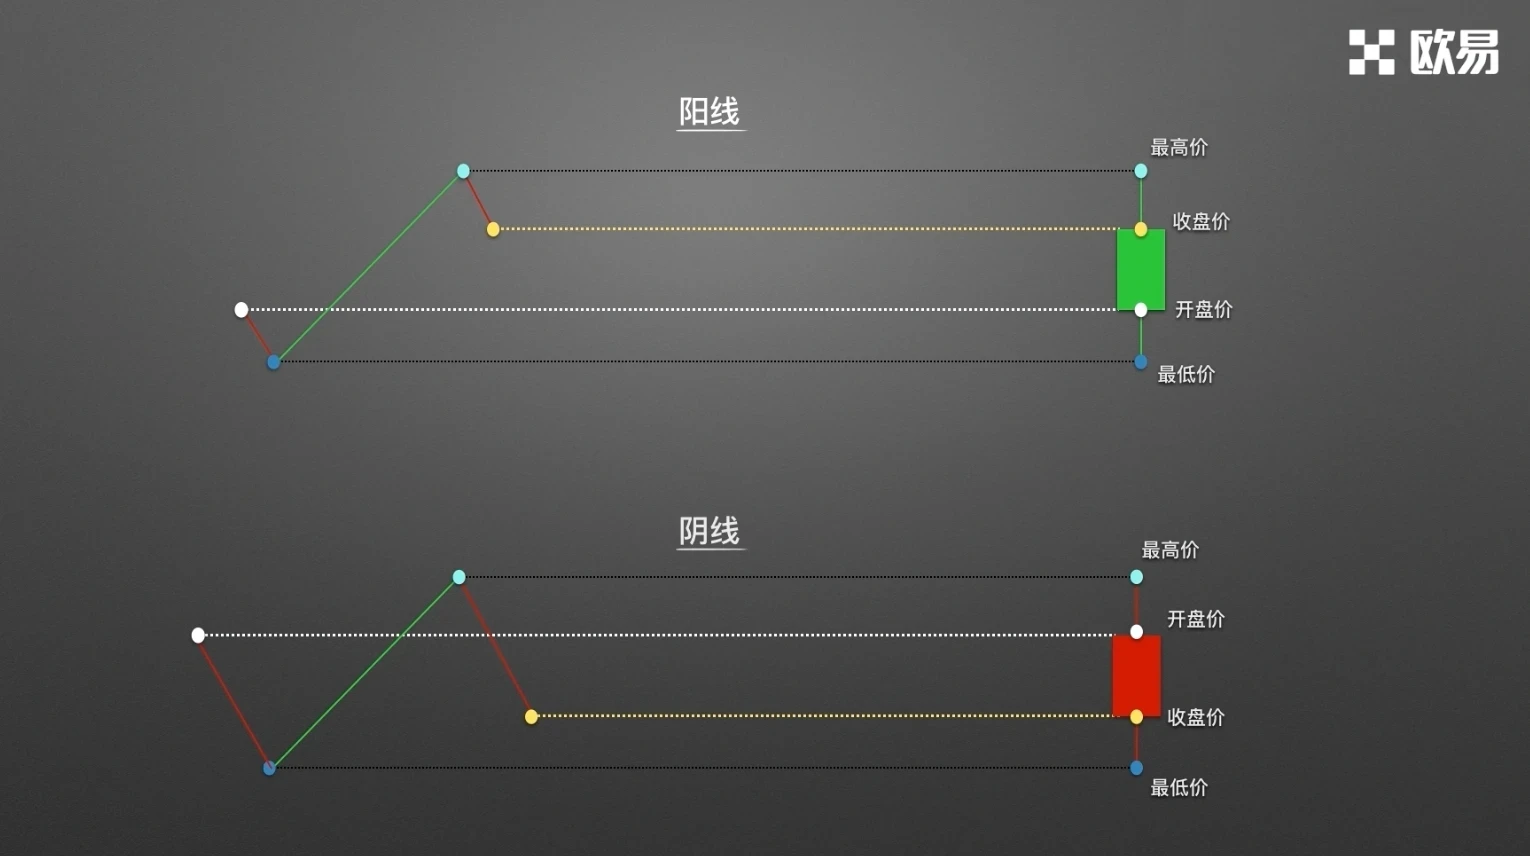
When the closing price is lower than the opening price, we mark the body in red, indicating that the price declined during that period, usually called a bearish candle. When the closing price is higher than the opening price, we mark the body in green, indicating that the price rose during that period, usually called a bullish candle. (Of course, some markets use opposite colors to mark candlestick rises and falls.)
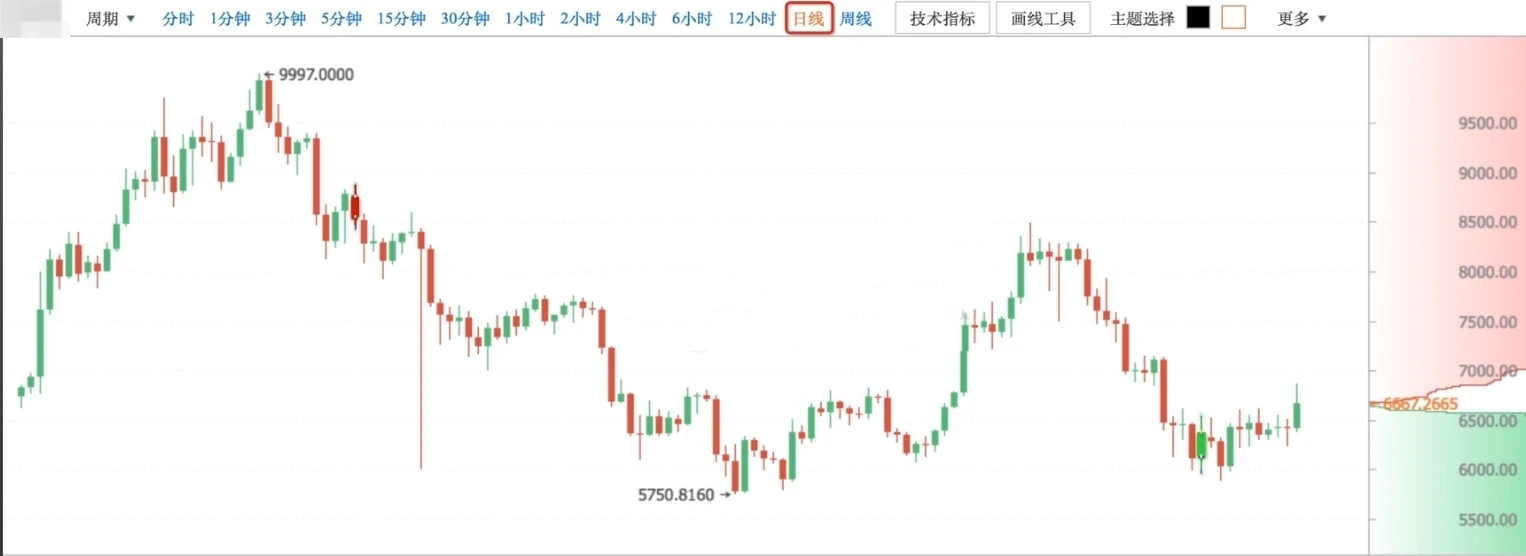
When we connect each day's candlesticks together, we get the familiar candlestick chart pattern. Each red or green candlestick in the chart represents one day's price change data. If one day's price movement can be represented by one candlestick, then what about one minute, one hour, or one week?
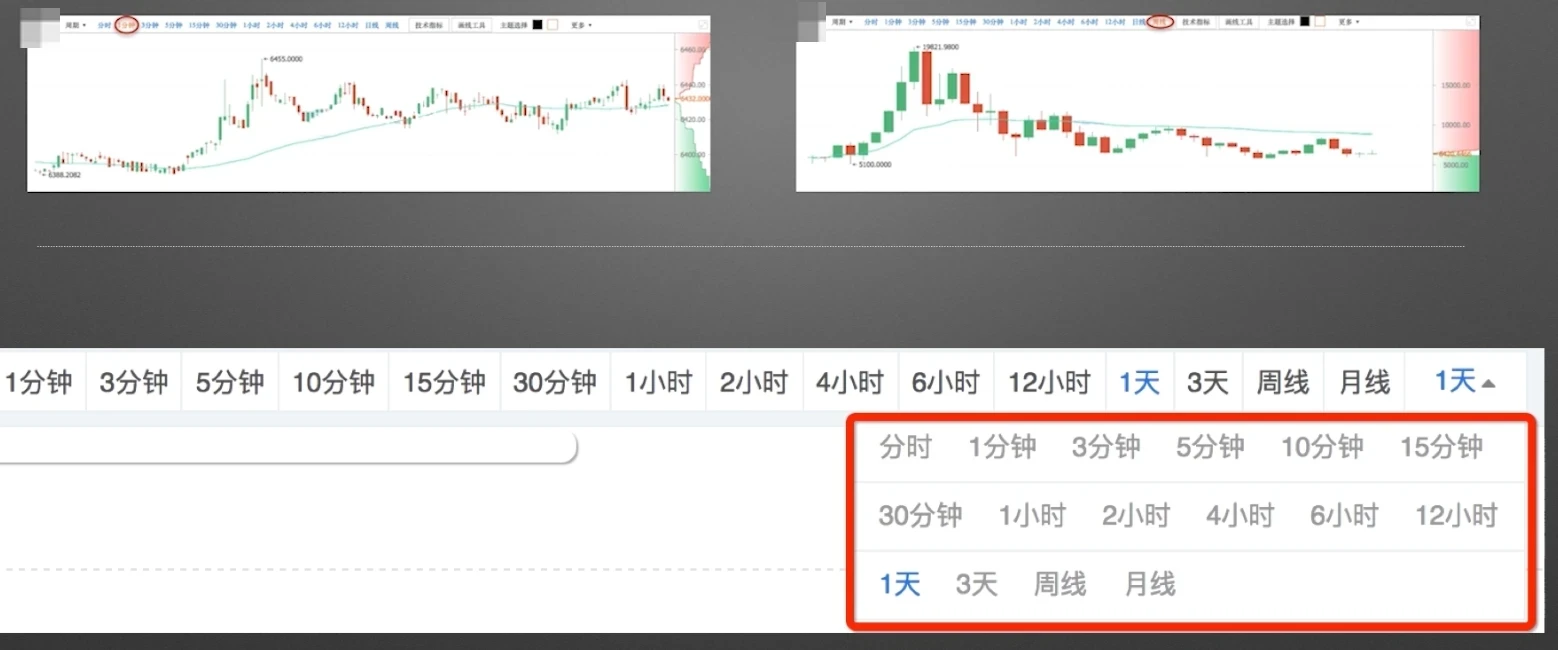
Based on different time ranges for tracking price changes, we divide candlesticks into different periods. This is what multiple one-minute candlesticks connected together looks like, and this is what multiple "weekly candlesticks" connected together looks like. Period division is very flexible—can be a few minutes, a few hours, a few days, a few weeks, or even several months.
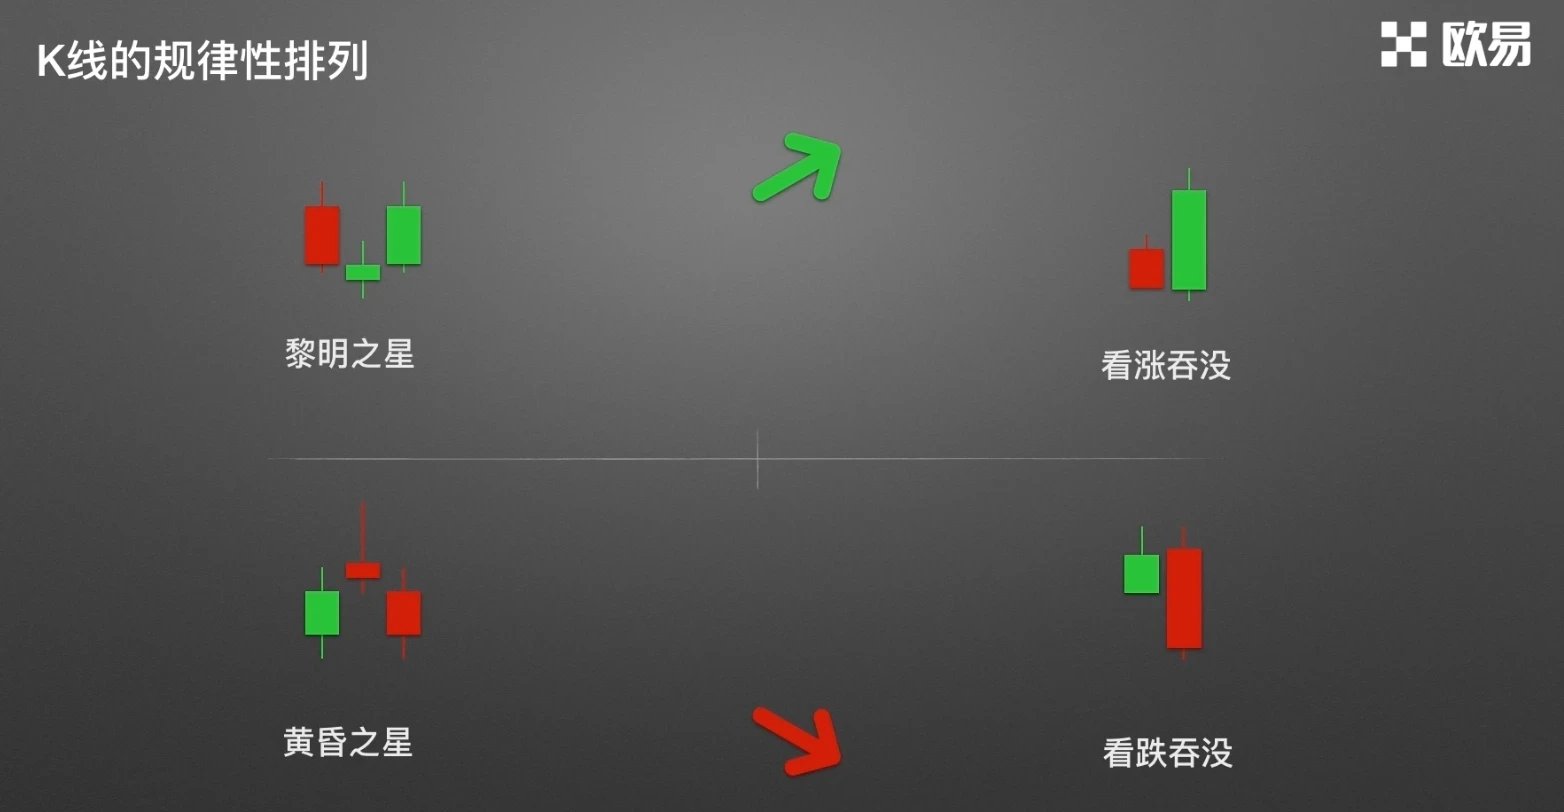
What role do candlesticks play in investment market analysis? When specific candlestick patterns or specific candlestick combinations appear, there is a high probability of specific price trends occurring. Because price reflects all market behavior, history amazingly repeats itself.
In future articles, we'll share methods for predicting future price rises and falls by observing regular candlestick arrangements.
Disclaimer
This article may contain product-related content not applicable to your region. This article is intended to provide general information only and does not take responsibility for any factual errors or omissions therein. This article represents only the author's personal views and does not represent OKX's views. This article is not intended to provide any of the following advice, including but not limited to: (i) investment advice or investment recommendations; (ii) offers or solicitations to buy, sell, or hold digital assets; or (iii) financial, accounting, legal, or tax advice. Holding digital assets (including stablecoins) involves high risk, may fluctuate significantly, and may even become worthless. You should carefully consider whether trading or holding digital assets is suitable for you based on your financial situation. For questions about your specific situation, please consult your legal/tax/investment professional. The information appearing in this article (including market data and statistics, if any) is for general reference only. Although we have taken all reasonable precautions in preparing these data and charts, we assume no responsibility for any factual errors or omissions expressed herein. © 2025 OKX. This article may be reproduced or distributed in full, or excerpts of 100 words or less from this article may be used, provided such use is non-commercial. Any reproduction or distribution of the entire article must also prominently state: "© 2025 OKX, used with permission." Permitted excerpts must cite the article name and include attribution, for example "Article Name, [Author Name (if applicable)], © 2025 OKX". Some content may be generated or assisted by artificial intelligence (AI) tools. Derivative works or other uses of this article are not permitted.
Show More
Recommended Reading

Profit from Bitcoin Declines? How to Trade Contracts
As the cryptocurrency market represented by Bitcoin continues to expand, various forms of derivatives trading have gradually emerged beyond spot trading as tools to hedge risk, with contract trading receiving the most attention. What is contract trading? Contracts are the most common trading contract form in the cryptocurrency derivatives market. Digital assets contract trading refers to buyers and sellers agreeing to trade certain assets at a specified price at a future time.
January 16, 2026

Simpler Than Copy Strategy? One-Click Follow Top Strategy Traders on OKX, Let Traders Earn for You
Whether in traditional finance or the cryptocurrency market, strategy trading is a very important and crucial method in the trading system. When facing complex trading environments and extreme market conditions, even with solid theoretical knowledge and rich trading experience, it's easy to miss trading opportunities or make wrong judgments and operations due to emotional influence. Strategy trading is precisely an effective tool that can solve these problems. Now that you have trading tools, how to make the most of
November 21, 2025

V. Strategy Trading Series Course—Earn
Preface: We often have this hypothesis: there are many digital assets with large gains in bull markets. If we can continuously capture assets with significant increases, for example catching a doubling digital asset every month, your assets would become 2 to the power of 12 after one year, that is 4096 times, which is very amazing. Of course, this is also almost impossible to achieve, because we find it difficult to continuously catch surging assets. This is also a problem many users encounter: in bull markets, although
November 3, 2025

Which Countries/Regions Do Not Support Registration on OKX
OKX currently does not provide services to customers in the following regions: certain US territories, such as New York, Texas, Puerto Rico, American Samoa, Guam, Commonwealth of the Northern Mariana Islands, US Virgin Islands (St. Croix, St. John, and St. Thomas), Cuba, Iran, North Korea, Crimea, Malaysia, Syria, Bangladesh, and Bolivia. For details, please refer to the OKX Terms of Service.
April 25, 2024

Quickly Understand OKX Common Products and Features
OKX (www.okx.com) is one of the world's famous digital asset service platforms, mainly providing global users with Bitcoin, Ethereum, and other digital asset spot and derivatives trading services, while also exploring the world of DeFi, dApps, NFTs, and GameFi with users. On OKX, you can enjoy smooth spot and contract trading experiences, stay updated on token information in hot sectors/concepts, and also
April 25, 2024

Zero-Based Candlestick Learning | 5 Importance of Candlestick Combination Applications
Trends have patterns, understand the language of price; buy and sell signals, say goodbye to emotional trading. I. Bullish Candlestick Combinations at Key Positions In the first two sections of this chapter, we explained the applications of bullish and bearish candlestick combinations, but these combinations are not effective when they appear at any position. In this section, we'll explain the importance of where combinations appear. In which positions can bullish combinations play a better role? The first situation: in a clear uptrend, near the previous
April 25, 2024


