Zero Basics to K-line | 10 Bottom-Fishing Patterns—"W" Bottom
Trends govern the rise and fall; understand price language;
Signals drive the buy and sell; trade without guessing Trading.
1. The "W" Bottom Pattern
What does a "W" bottom look like?
The black trendline marks the W bottom pattern—named for its striking resemblance to the letter "W." It is a classic consolidation pattern, also known as a double bottom.
2. Application Rules for the "W" Bottom
How to use the "W" bottom to predict future price movements?
Through technical analysis, we simplify complex K-line trends:
Let's lay out the simplified W bottom diagram to make its structure clearer. To predict the future price direction, we need a special trendline.
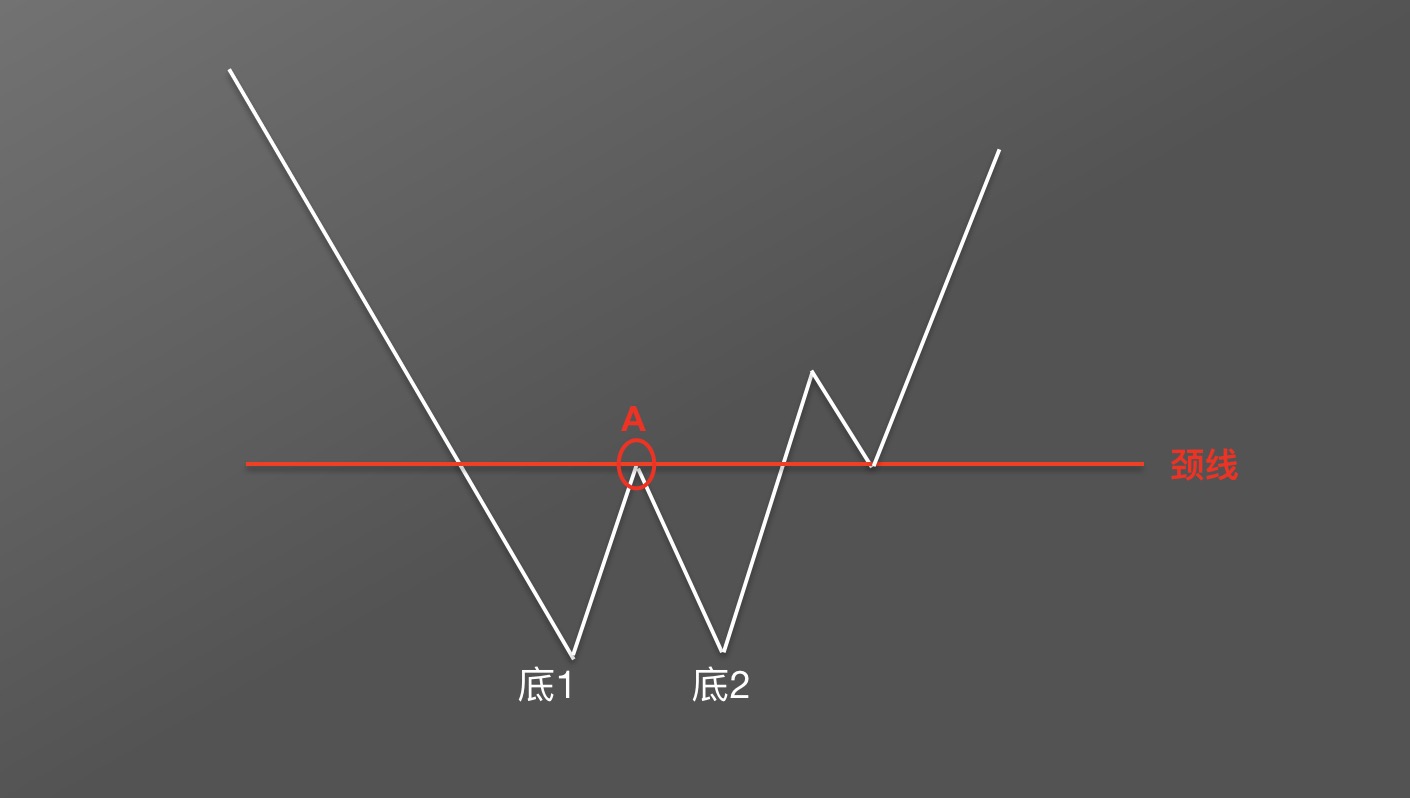
First, locate the high point A between the two bottoms. Draw a horizontal line through point A—this is called the neckline.
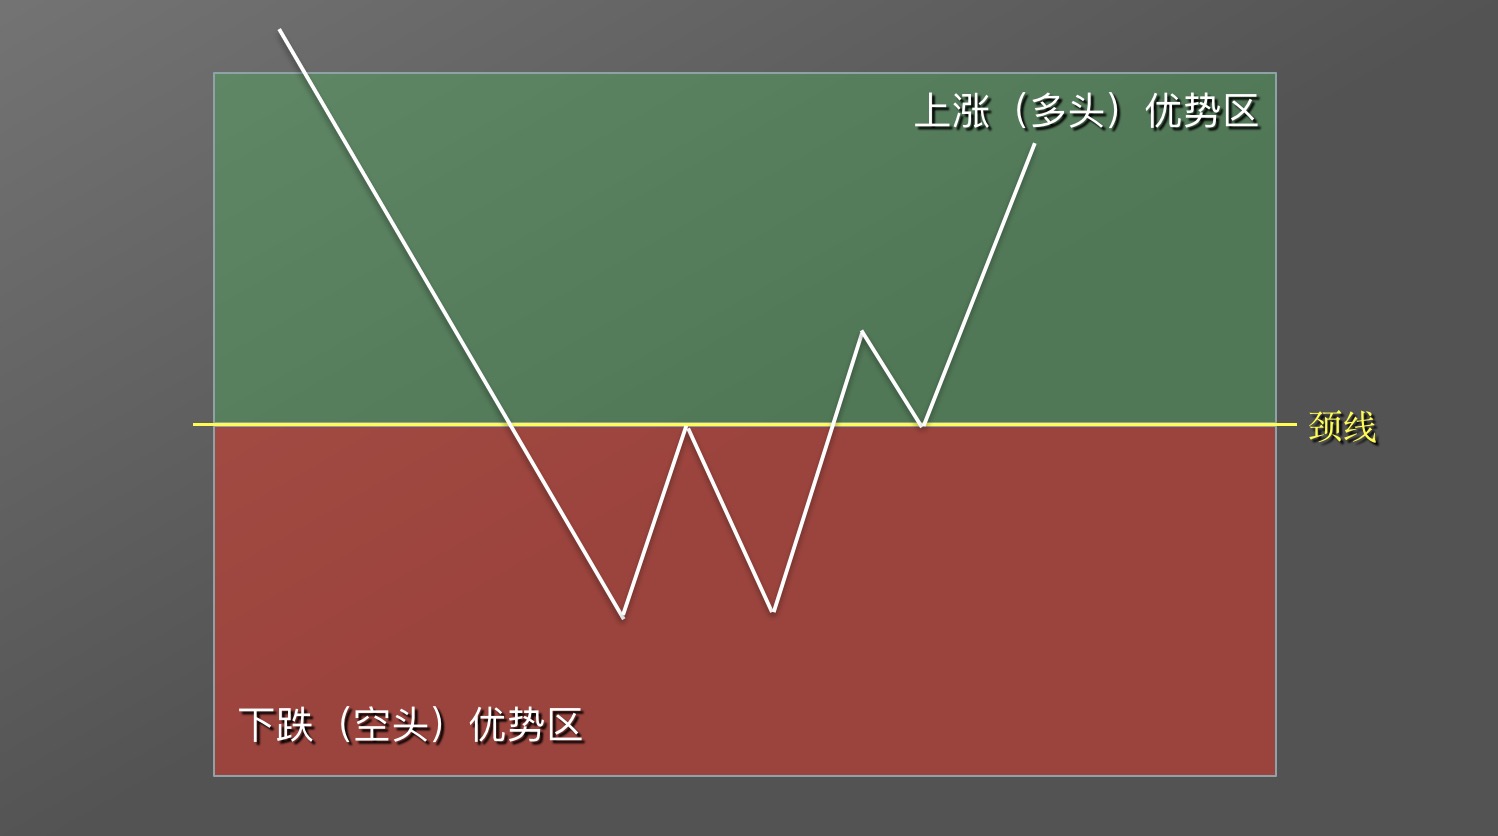
Above the neckline is the bullish advantage zone—favorable for going long, unfavorable for shorting. Below the neckline is the bearish advantage zone—favorable for shorting, unfavorable for going long.
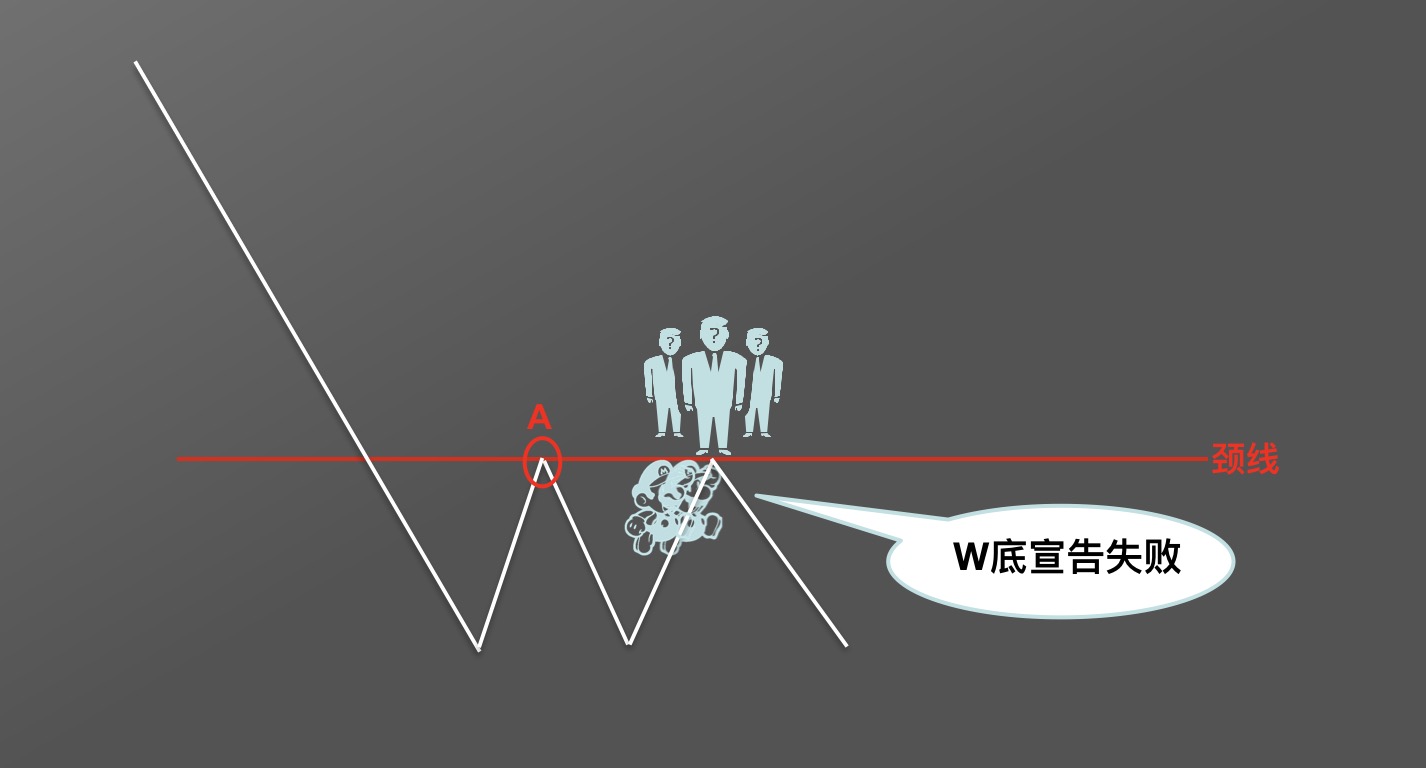
When price is below the neckline, the neckline acts as a resistance line. The market shows: near the neckline price level, the number of active buyers is noticeably lower than the number of sellers preparing to exit—this creates upward resistance. Without sufficient buying pressure, price fails to break through resistance and naturally follows with a decline. In this case, the W bottom pattern fails and does not form.
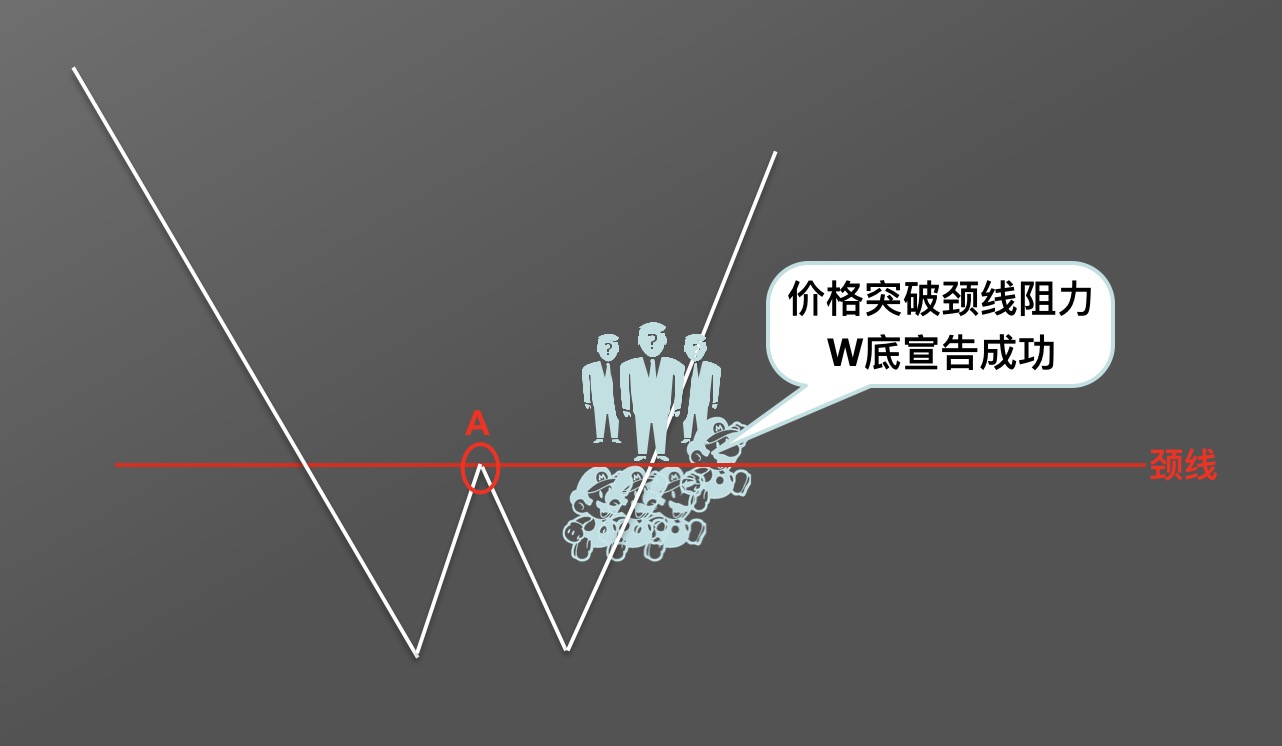
When investors buying at market price continue to pile in, eventually outnumbering willing sellers, price breaks through the resistance line decisively, forming a breakout and upward movement—the W bottom succeeds. Once a major resistance is broken, previously sidelined investors gain renewed confidence in future price appreciation, rushing to buy the asset and pushing prices even higher.
The future direction is clear—how do you seize the optimal entry and exit timing?
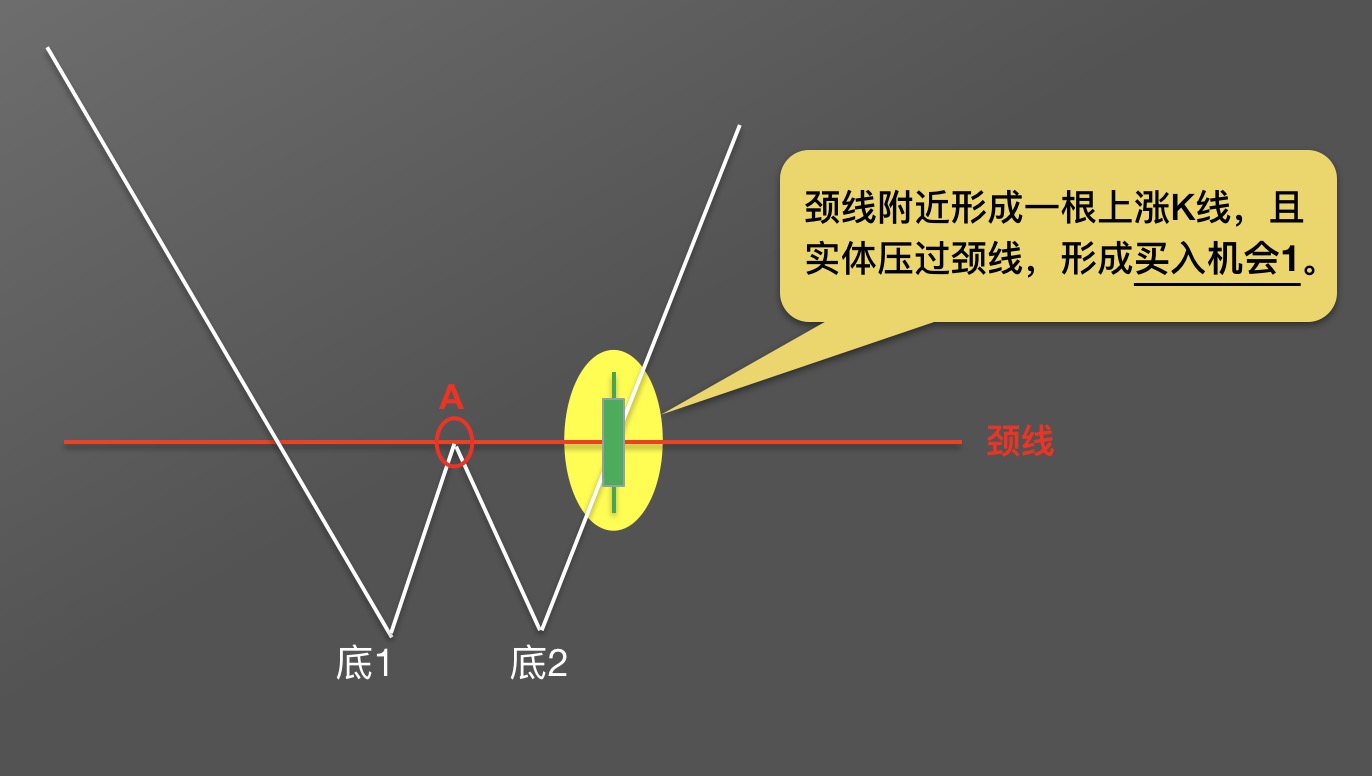
As the W bottom pattern forms, the K-line at the moment of neckline breakout appears as shown—a green bullish candle with the body breaking through the neckline. This is a clear bullish signal and represents the first buying opportunity, with the market most likely moving upward afterward.
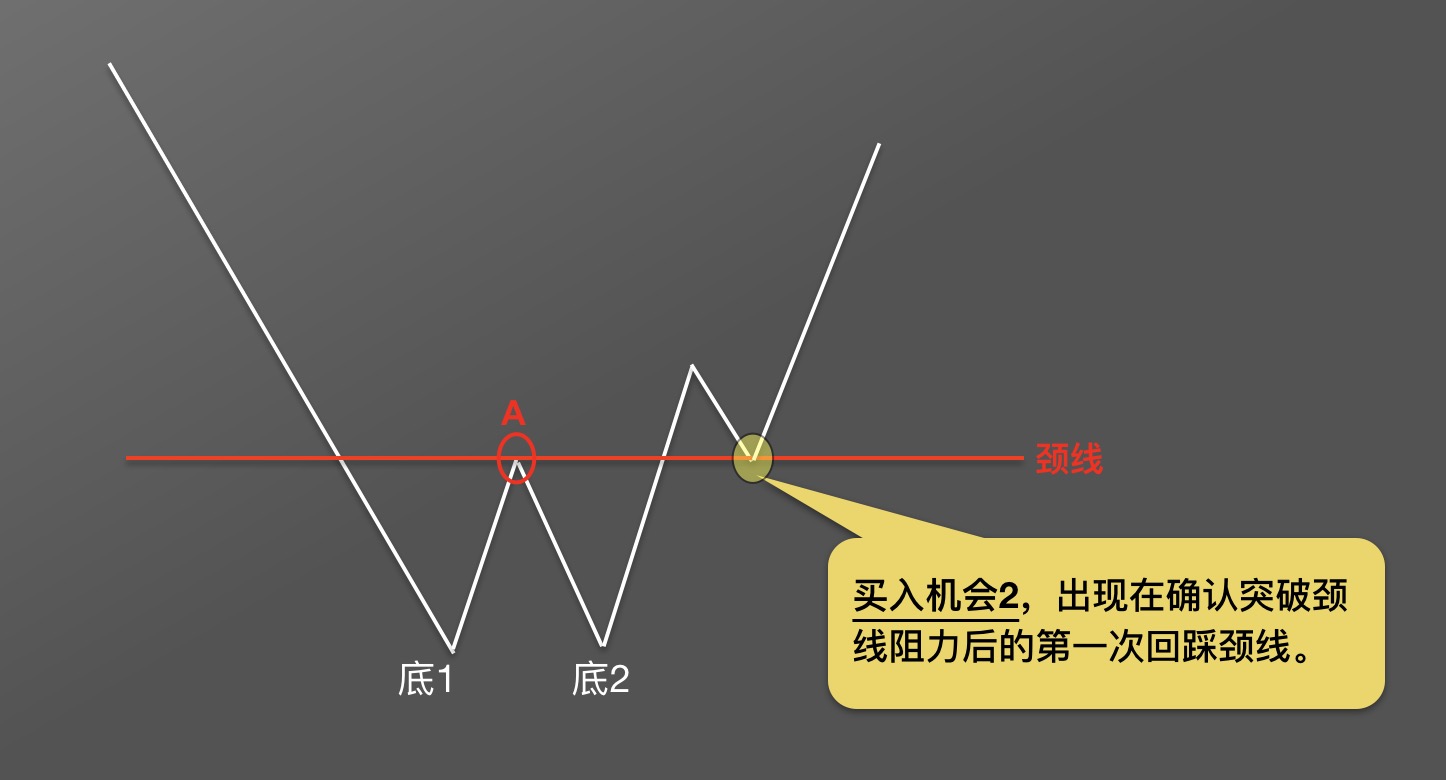
Since the market is always in a state of tug-of-war between bulls and bears, even after a W bottom forms, sellers will inevitably be present to cap price rallies. As shown, after price breaks through the neckline, a minor pullback occurs, retracing to near the neckline before resuming its upward move. This price behavior is called a pullback to confirm support. Pulling back to the neckline constitutes Buying Opportunity 2.
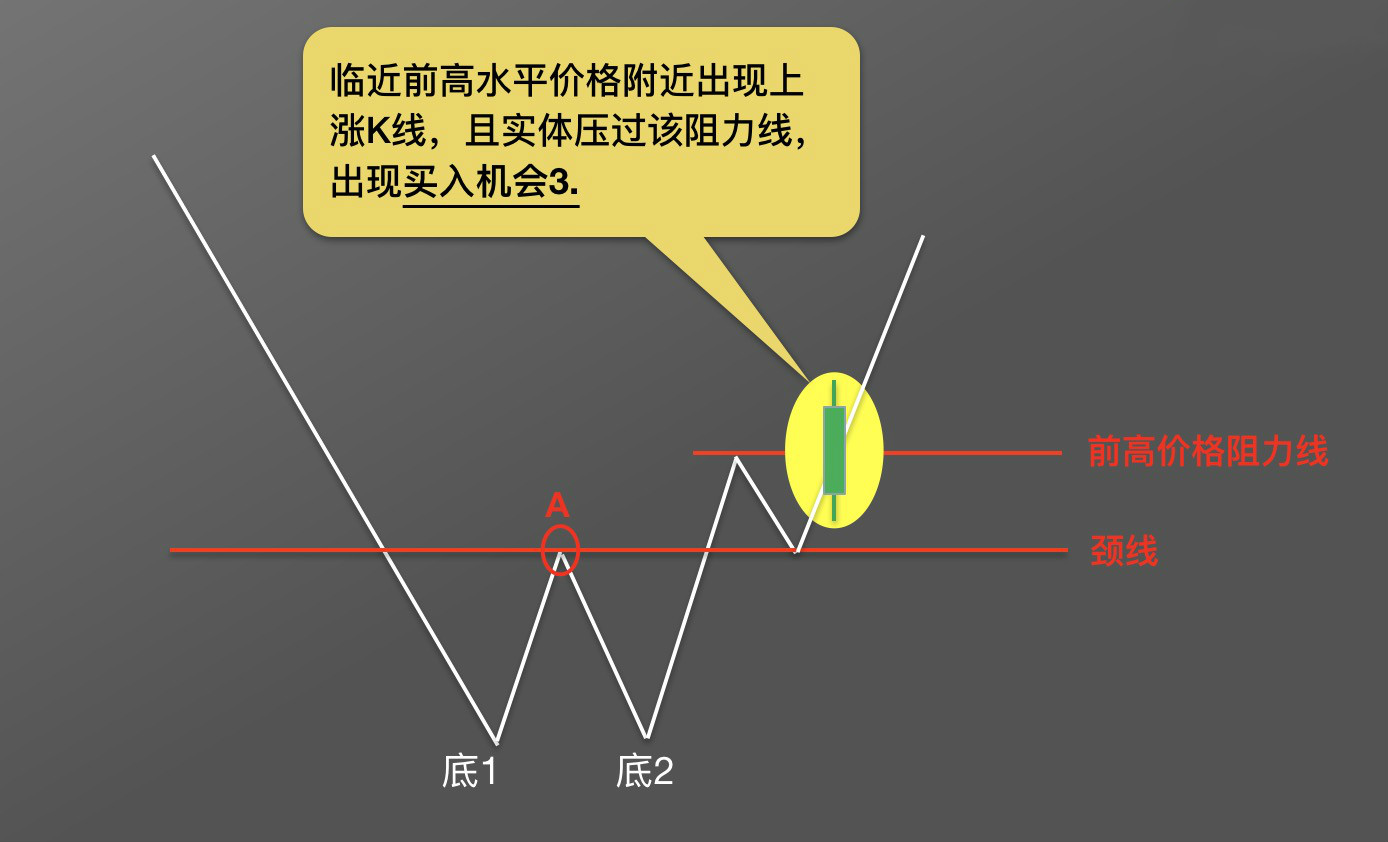
Buying Opportunity 3 appears when, after the pullback to the neckline, price rallies again and breaks above the prior peak. The method to confirm the breakout remains the same—check the K-line close: does the bullish candle body cross the resistance line? If the result matches the chart, Buying Point 3 is confirmed.
Let's summarize the application techniques for the W bottom pattern.
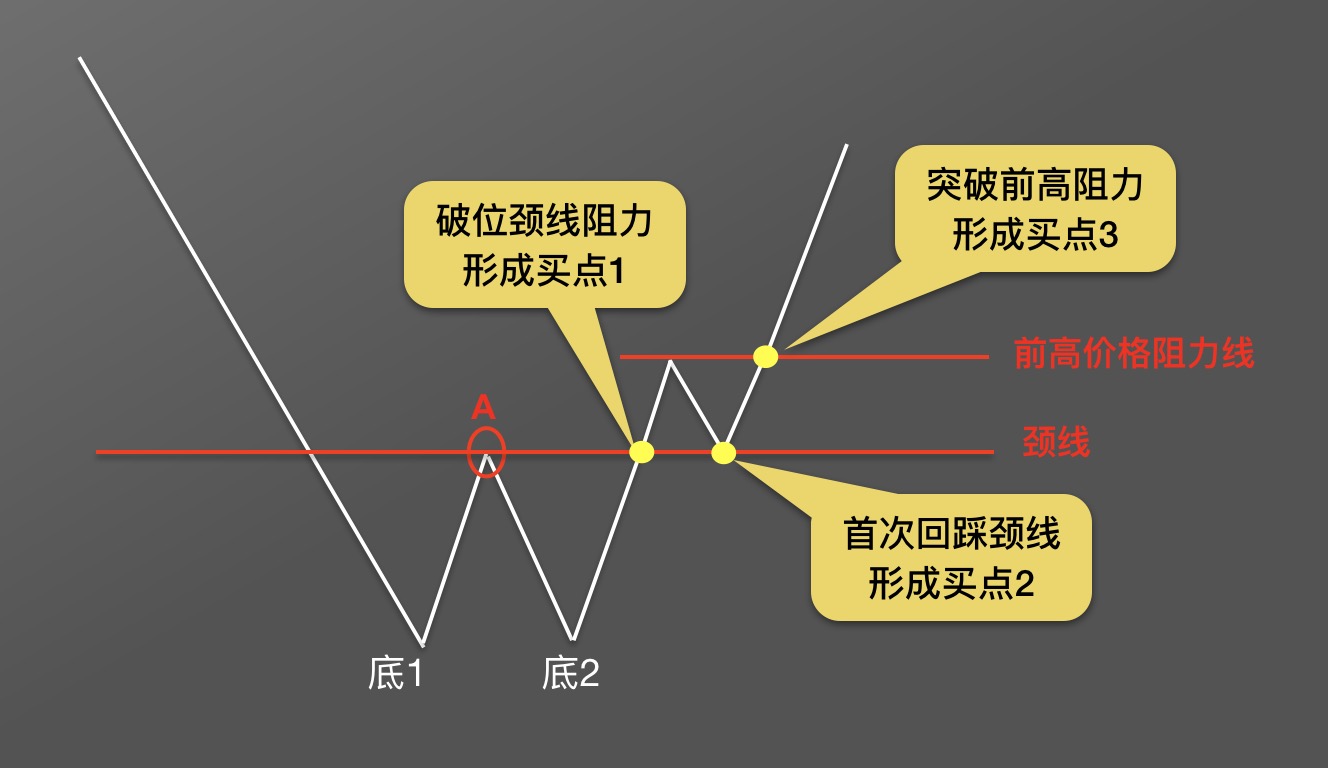
First, confirm the W bottom structure and draw the key bullish/bearish reference line—the neckline. As the market evolves, we can identify up to three prime buying opportunities: breaking through the neckline—Buy Point 1, pulling back to the neckline—Buy Point 2, and breaking above the prior high—Buy Point 3.
Attentive readers may have noticed that the W bottom's application techniques are similar to those of the head and shoulders bottom. What are the differences between them?
1) The number of bottoms differs clearly. The head and shoulders bottom has a triple-bottom structure, while the W bottom has a double-bottom structure.
2) The neckline shape differs. The head and shoulders bottom's neckline can be a slanted line, while the W bottom's neckline is always a horizontal straight line.
Investing requires not only knowing when to buy, but also when to sell.
Earlier we covered how to identify buying opportunities using the W bottom pattern. Now let's learn how to use the W bottom to project future price targets and find optimal selling opportunities.
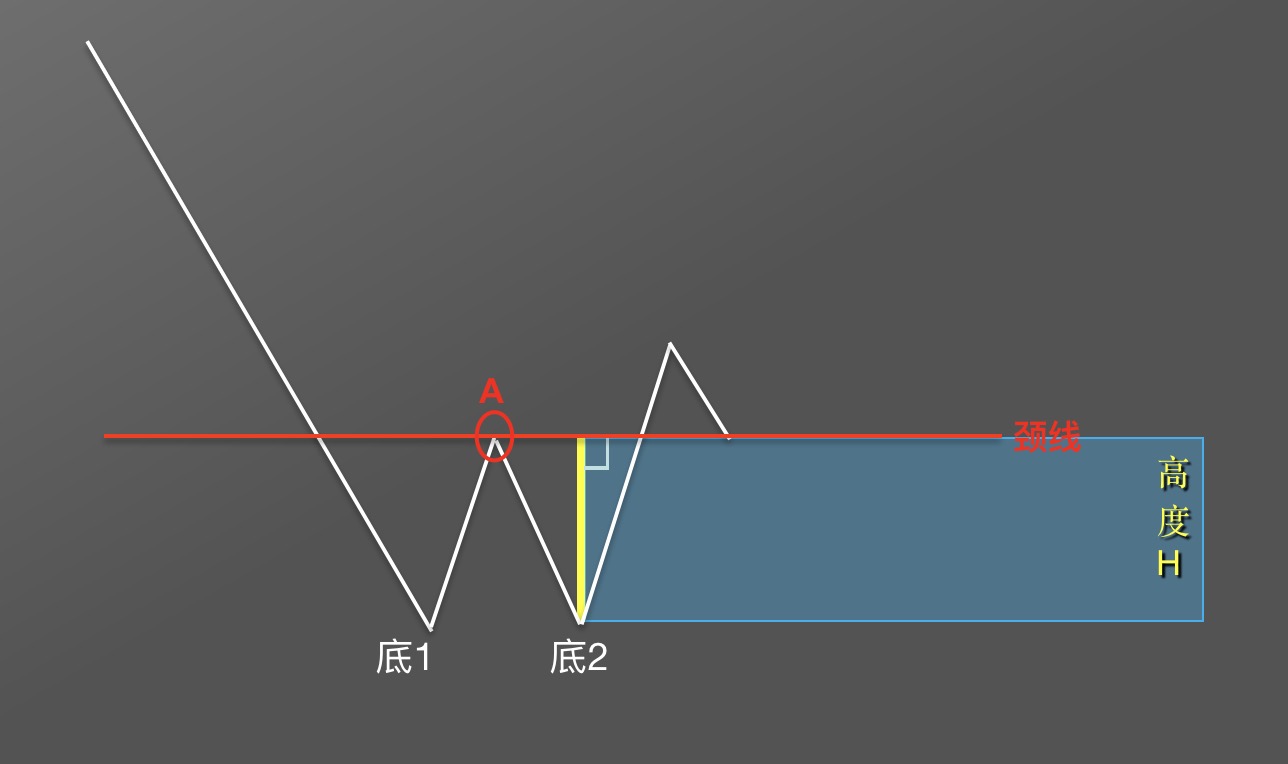
First, from the bottom closest to the neckline, draw a perpendicular to the neckline and measure its height as H.
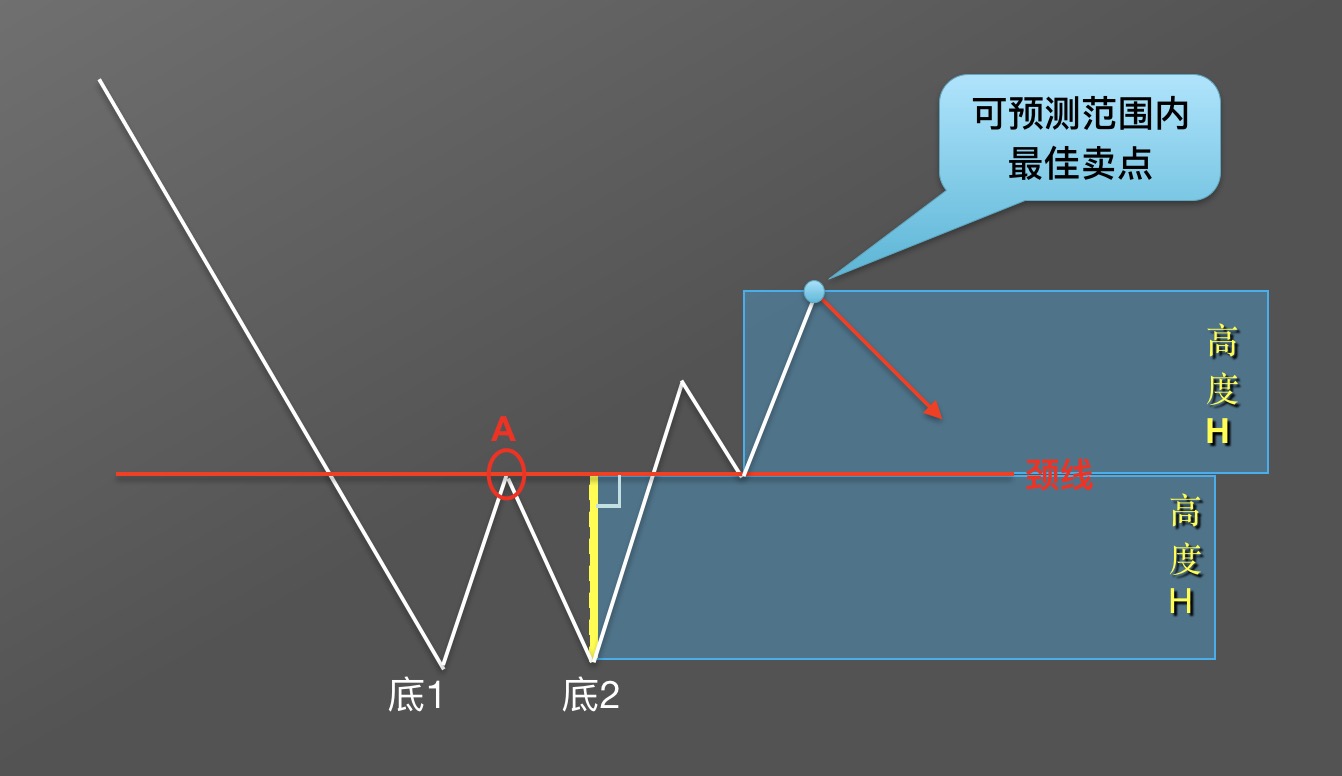
Shift this perpendicular segment above the neckline as shown. When price rises to height H, it forms the best predictable selling opportunity, and the market will most likely reverse downward. Of course, if the uptrend is strong, the rally may extend further and higher. Any gains beyond H constitute超额利润 (excess profit) and fall outside the predictable range.
Let's review a few real-world cases.
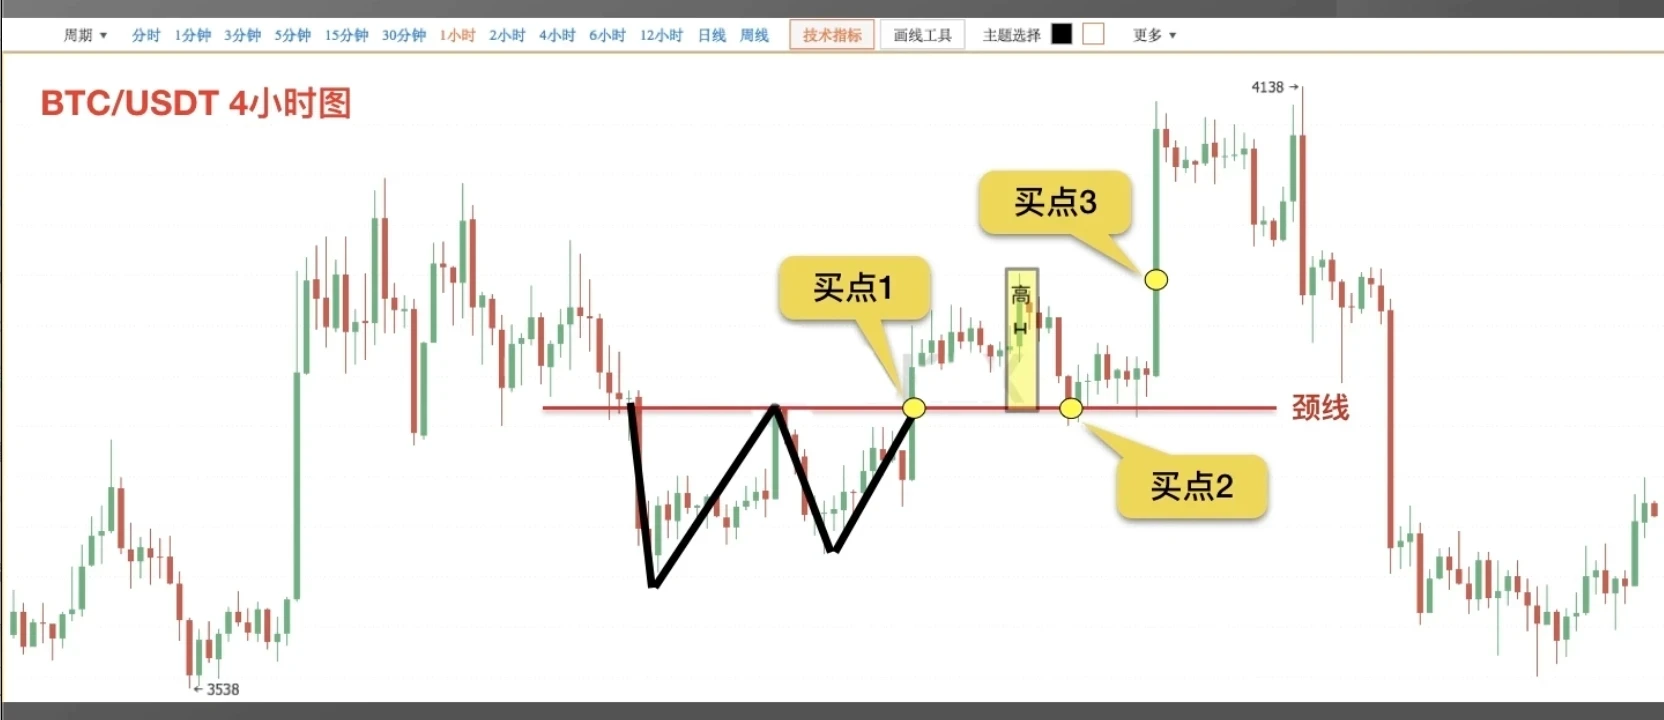
As shown, on the Bitcoin/USDT 4-hour chart, after the W bottom formed, three buying opportunities appeared, marked by the yellow dots. The final rally exceeded the projected range, generating excess profit.
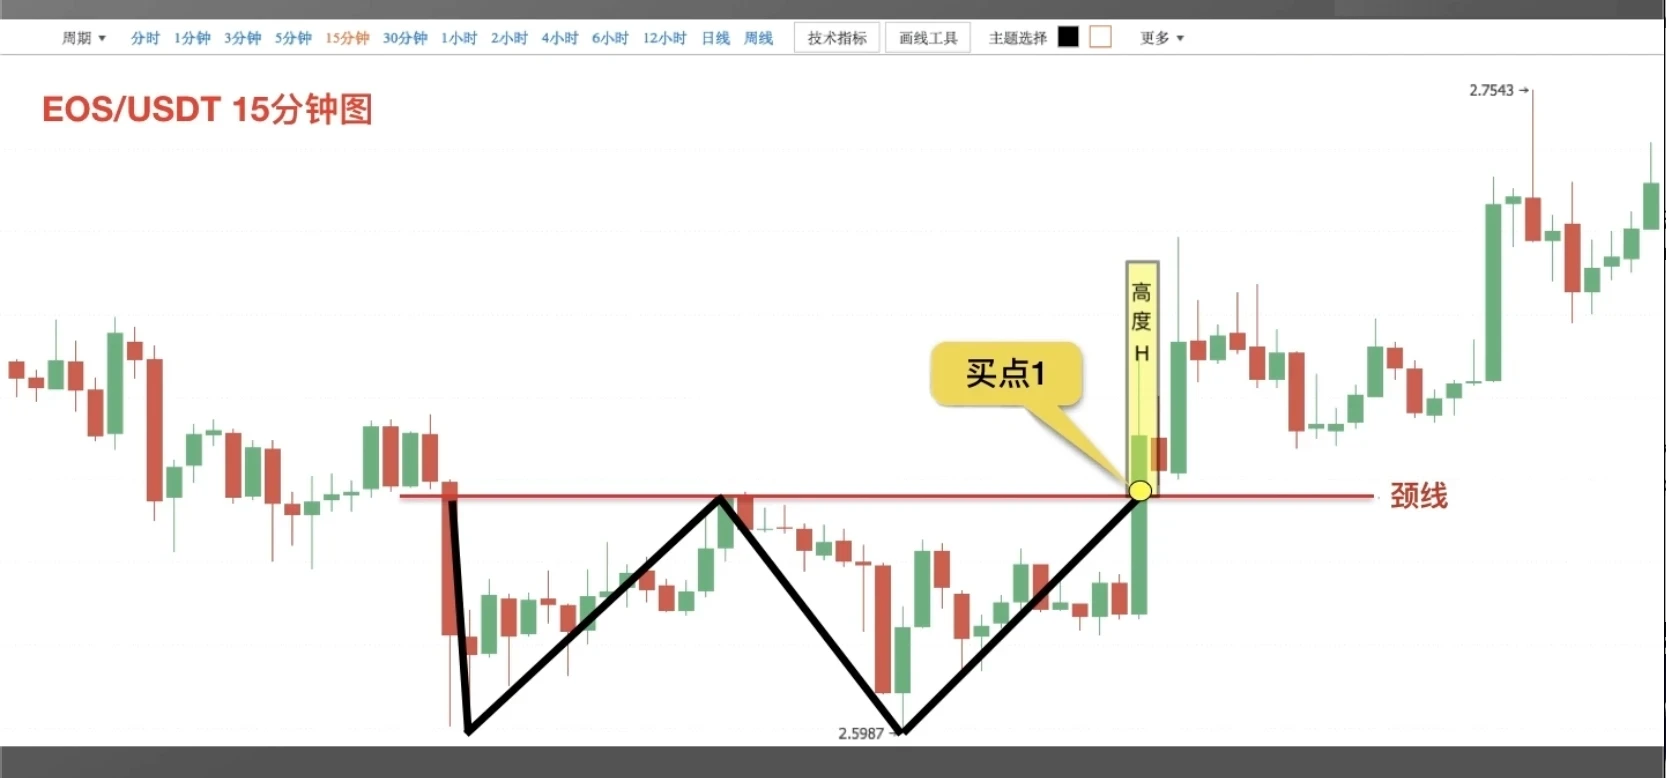
The second case shows the EOS/USDT 15-minute chart. After the W bottom formed, price rallied quickly. Although a pullback occurred, it failed to touch the neckline, leaving only one buying opportunity.
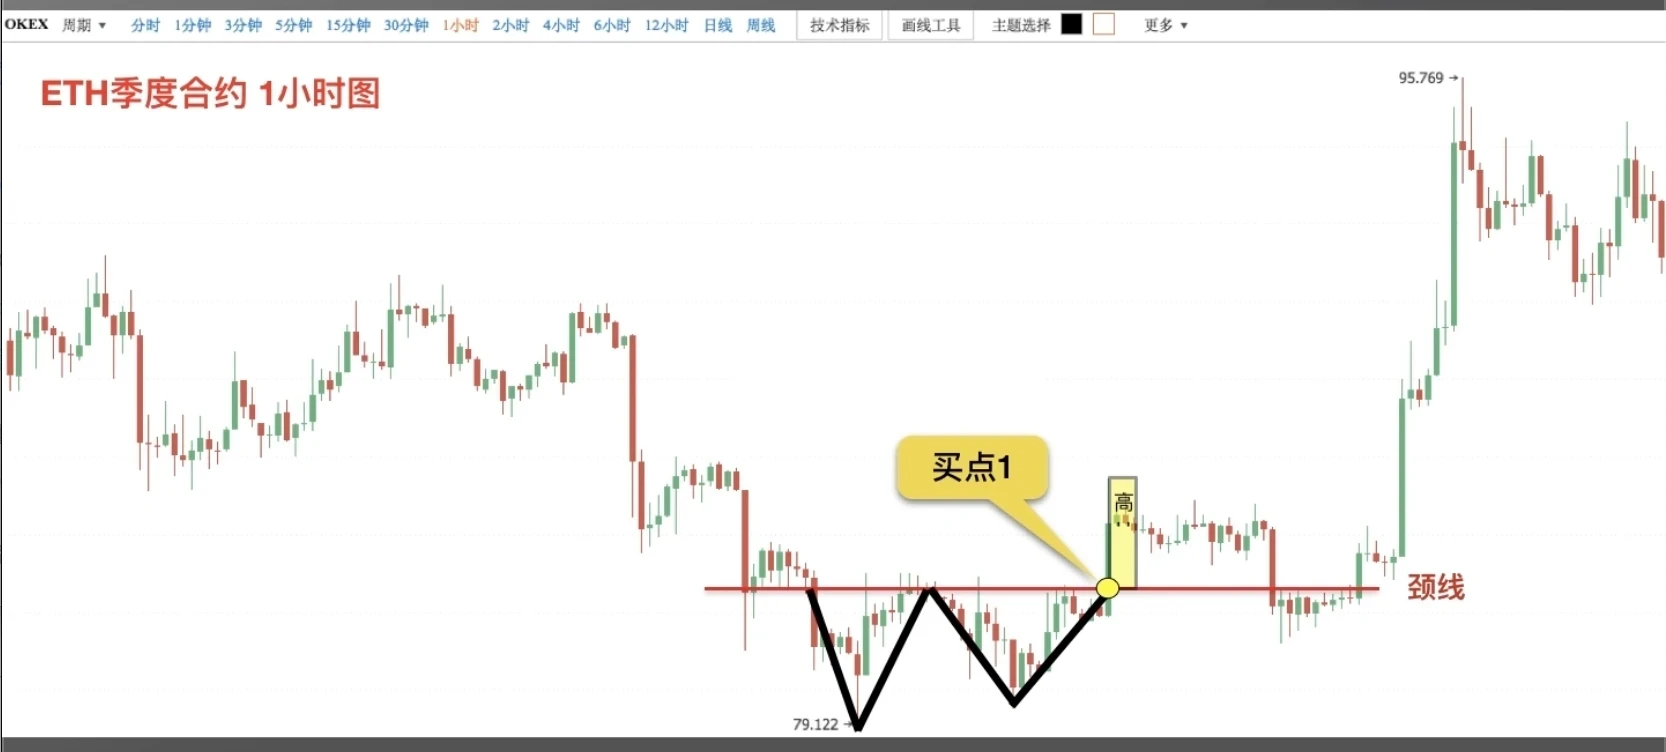
Case three is from the ETH 1-hour chart on OKX quarterly contracts. After the W bottom formed, the initial rally peak coincided precisely with the projected target. Price then entered a new round of bull-bear competition near the neckline.
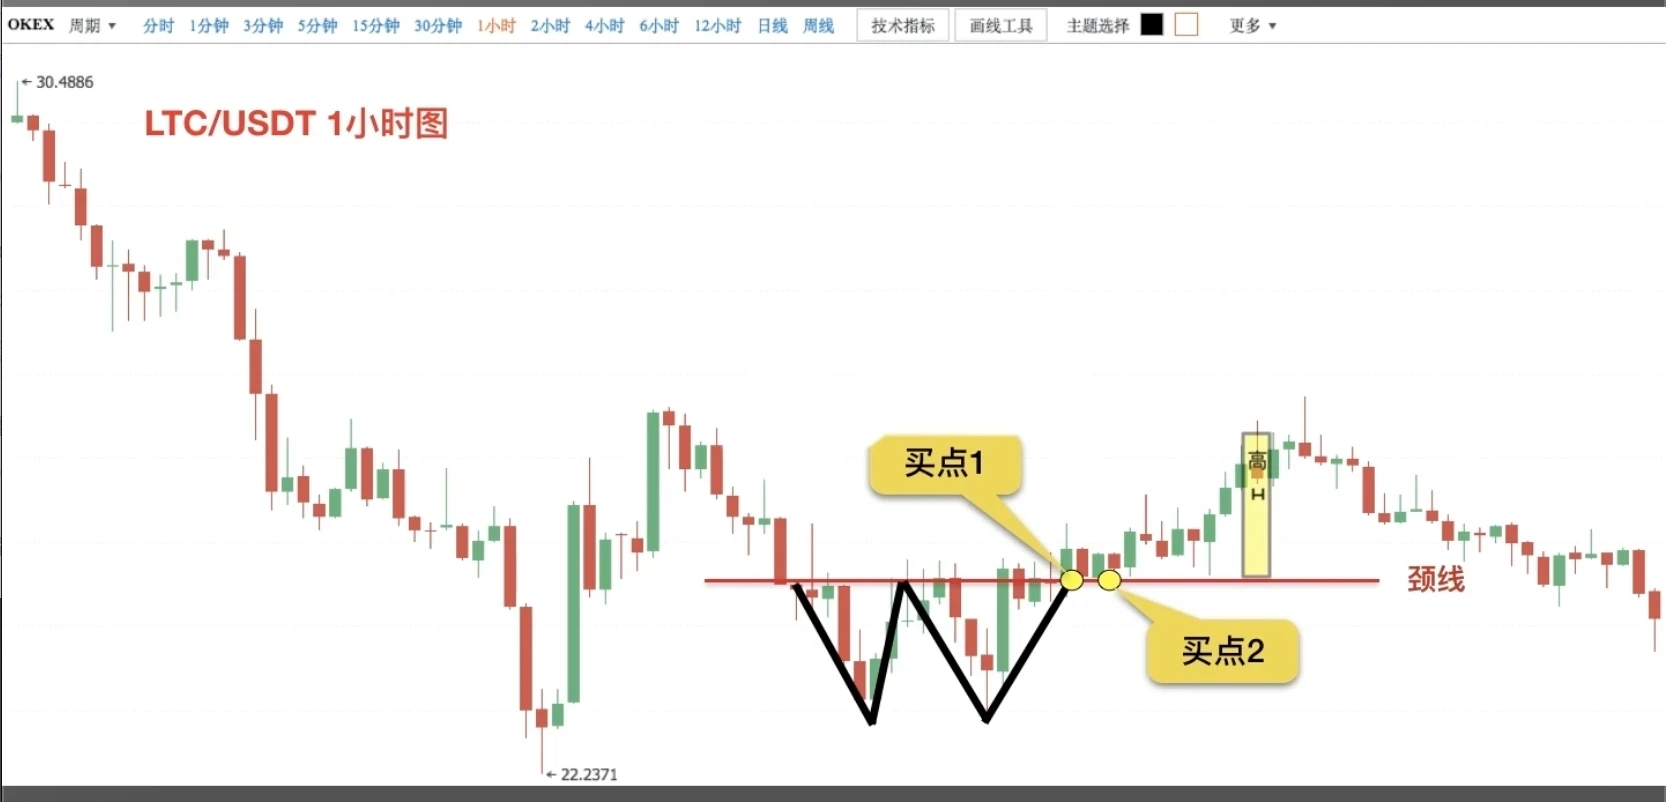
The final case is from the Litecoin/USDT 1-hour chart. The W bottom appeared near the previous low level. When price rallied to the projected target zone, a stall occurred followed by a decline.
Markets shift in an instant—much like the unpredictability of weather, how do you anticipate danger and weather the storm? As the ancients said: the wind rises before the mountain storm. Before a major decline, the market often sends warning signals.
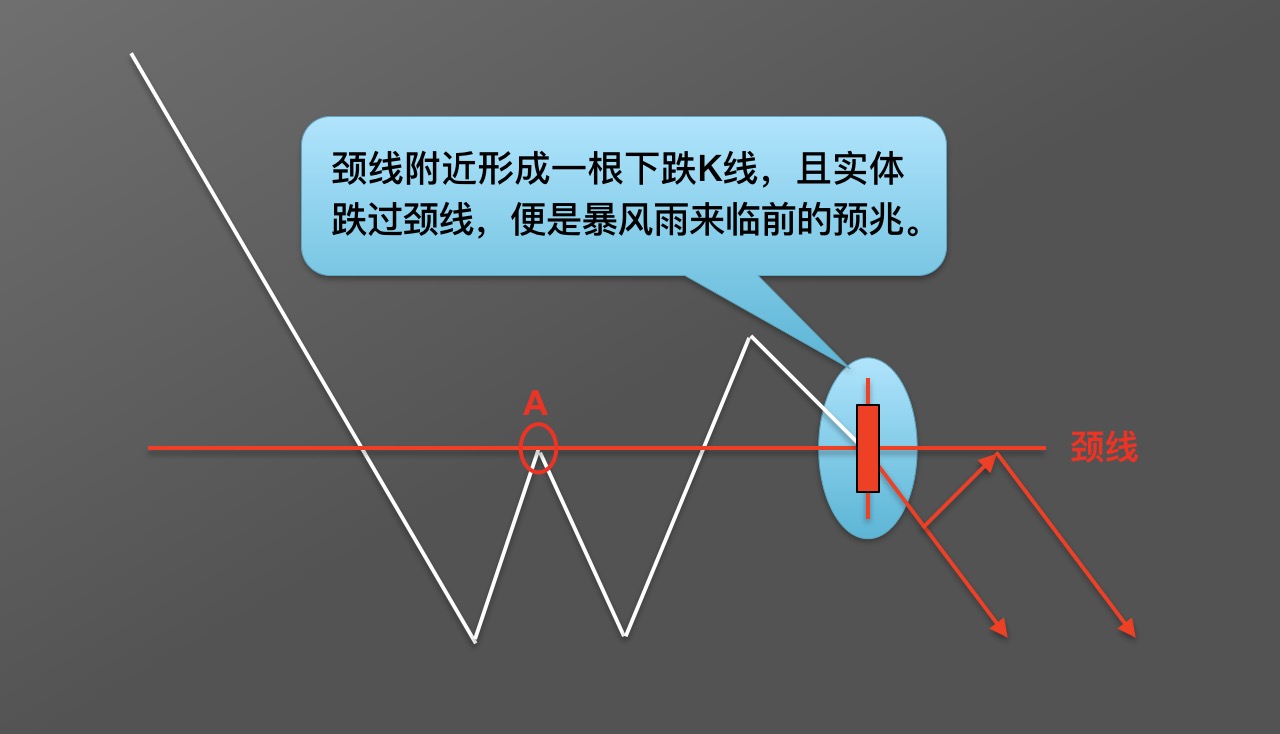
Even with a W bottom formation, there is no guarantee of flawless subsequent gains. If, when price pulls back to the neckline support, a bearish K线 candle forms with its body breaking below the neckline, this is a warning of the coming storm—a sell signal, with the market most likely following the downward path as shown.
Exceptional investors not only lock in profits by selling when they're winning, maximizing gains within the predictable range—they also know how to cut losses by selling when they're losing, minimizing damage within a controllable range.
Disclaimer
This article may contain product-related information not applicable to your region. This article is intended to provide general information only and makes no representation as to any factual errors or omissions. The views expressed in this article are those of the author and do not reflect the views of OKX. This article is not intended to provide any advice, including but not limited to: (i) investment advice or investment recommendations; (ii) offers or solicitations to buy, sell, or hold digital assets; or (iii) financial, accounting, legal, or tax advice. Holdings in digital assets (including stablecoins) involve a high degree of risk and may fluctuate dramatically or become worthless. You should carefully consider whether trading or holding digital assets is appropriate for you based on your financial situation. Please consult your legal/tax/investment professional regarding questions specific to your circumstances. Any information contained herein (including market data and statistics, if applicable) is provided for general reference purposes only. While reasonable precautions have been taken in preparing such data and charts, we make no representations and accept no responsibility for any factual errors or omissions expressed herein. © 2025 OKX. This article may be reproduced or distributed in its entirety or with excerpts of 100 words or less, provided such use is non-commercial in nature. Any reproduction or distribution of the full article must prominently state: "This article is copyrighted © 2025 OKX, used with permission." Permitted excerpts must cite the article title and include attribution, e.g., "Article title, [author name if applicable], © 2025 OKX." Some content may be generated or assisted by artificial intelligence (AI) tools. Derivative works and other uses of this article are not permitted.
Show More
Recommended Reading

Profit from Bitcoin Declines? How to Trade Contracts
As the cryptocurrency market represented by Bitcoin continues to expand, diverse derivatives trading has emerged alongside spot trading as a risk-hedging tool. Among these, contract trading has garnered the most attention. What is contract trading? Contracts are the most common trading instrument in the cryptocurrency derivatives market. Digital assets contract trading refers to buyers and sellers agreeing to trade a specific asset at a predetermined price on a future date.
January 16, 2026

Simpler Than Copying Strategies? Copy the Top Traders on OKX with One Click and Let Them Earn for You
Whether in traditional finance or the cryptocurrency market, strategy trading is a critical component of the trading system. When facing complex trading environments and extreme market conditions, even traders with solid theoretical knowledge and extensive experience can easily miss trading opportunities or make poor decisions driven by emotions. Strategy trading is precisely an effective tool to address these challenges. You have the trading tools—now how do you
November 21, 2025

Part 5: Strategic Trading Series—DCAP
Preface: We often wonder: during a bull market, there are many digital assets that surge. If you could consistently capture coins with large gains—for example, catching one that doubles every month—your assets would grow to 2 to the 12th power, or 4,096 times, in a year. That is staggering, though nearly impossible to achieve, as it's difficult to consistently capture assets that surge. This is a common challenge many users face: during a bull market, while
November 3, 2025

Which Countries/Regions Do Not Support OKX Registration
OKX currently does not provide services to customers from the following regions: certain U.S. territories such as New York, Texas, Puerto Rico, American Samoa, Guam, the Commonwealth of the Northern Mariana Islands, the U.S. Virgin Islands (St. Croix, St. John, and St. Thomas), Cuba, Iran, North Korea, Crimea, Malaysia, Syria, Bangladesh, and Bolivia. For details, please refer to the OKX Terms of Service.
April 25, 2024

Quick Guide to OKX Products and Features
OKX (www. okx. com) is one of the world's leading digital assets service platforms, primarily serving global users with Bitcoin, Ethereum, and other digital assets spot and derivatives trading services, while also exploring the world of DeFi, dApps, NFTs, and GameFi alongside users. On OKX, you can enjoy a seamless trading experience across spot, contracts, and more, stay ahead of hot sector and concept token information, and
April 25, 2024

Zero Basics to K-line | 5 K-line Pattern Combinations and Their Importance
Trends govern the rise and fall; understand price language; Signals drive the buy and sell; trade without guessing. Part 1: Key Levels for Bullish K-line Combinations In the previous two installments of this chapter, we covered bullish and bearish K-line pattern combinations. However, these patterns are not effective in every situation. In this section, we explain the importance of where these combinations appear. Where do bullish combinations work best? The first scenario: at a clear uptrend's late stage, a
April 25, 2024


