Candlestick Charts for Beginners | 11 Bottom-Fishing Patterns — Rounding Bottom
ACT+5. 56%
Price movements follow trends; understand the language of price;
Buy and sell signals exist; say goodbye to emotional trading.
I. The Rounding Bottom Pattern
In this lesson, we continue our study of bottom-fishing patterns with part three: the Rounding Bottom. First, let's see what a Rounding Bottom looks like?
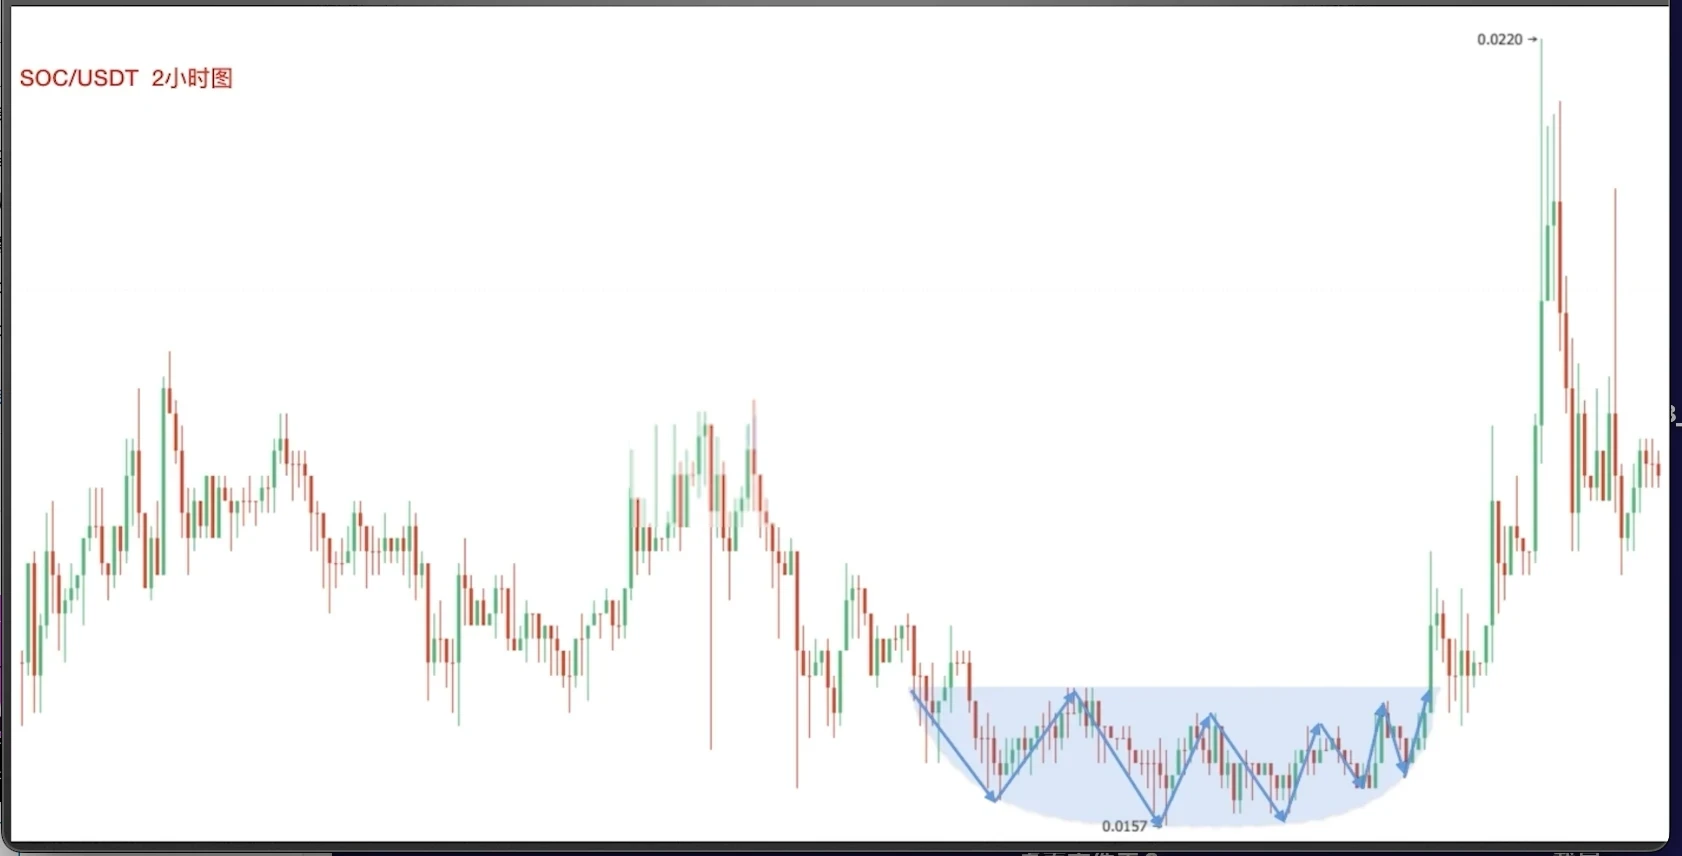
As shown in the figure, in a downtrend, the downward momentum gradually slows down. Connecting the lows of this slowing trend, the bottom presents a curved shape. Therefore, such a candlestick pattern is called a Rounding Bottom.
Extracting this pattern, we get a simplified diagram:
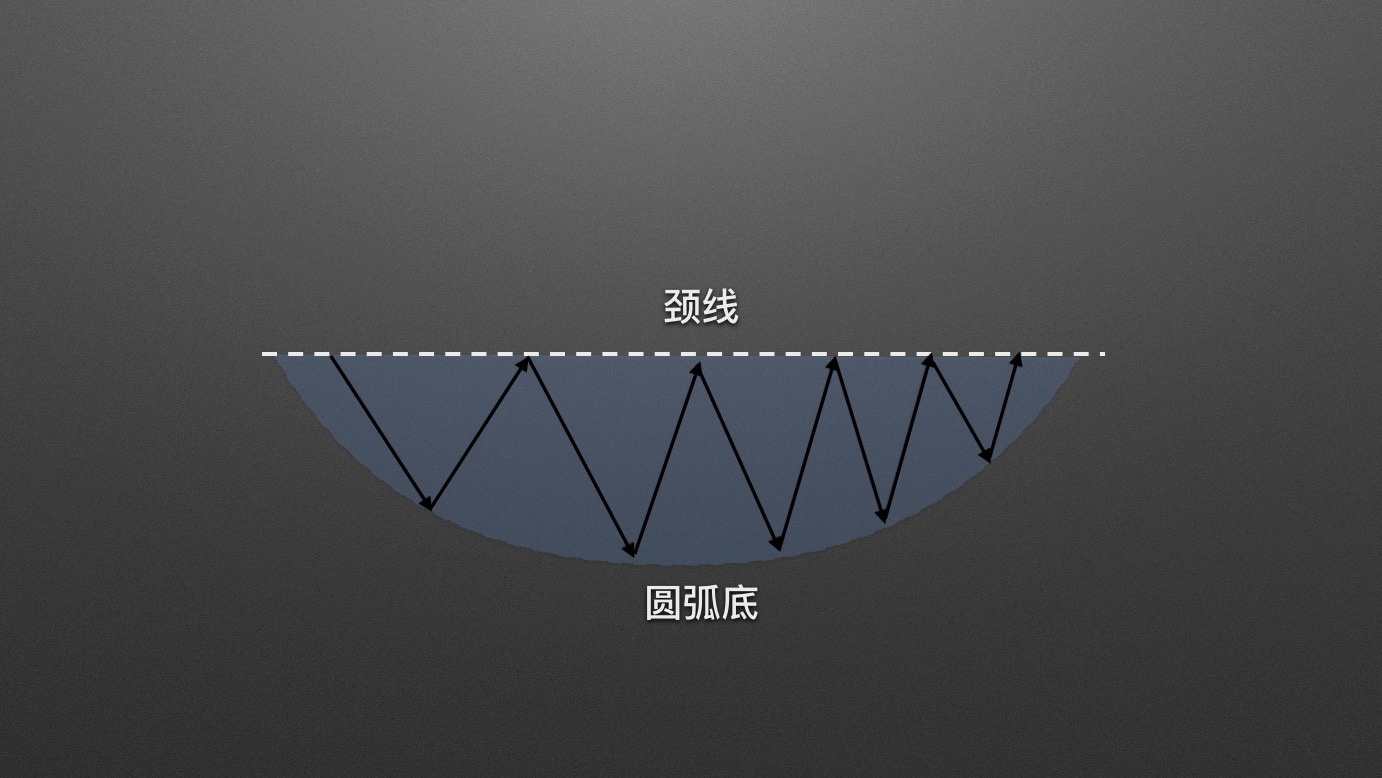
Using the highest point of the rounding as a reference, draw a horizontal line. This is called the neckline.
Not all rounded shapes are Rounding Bottoms. How do you confirm a Rounding Bottom is valid?
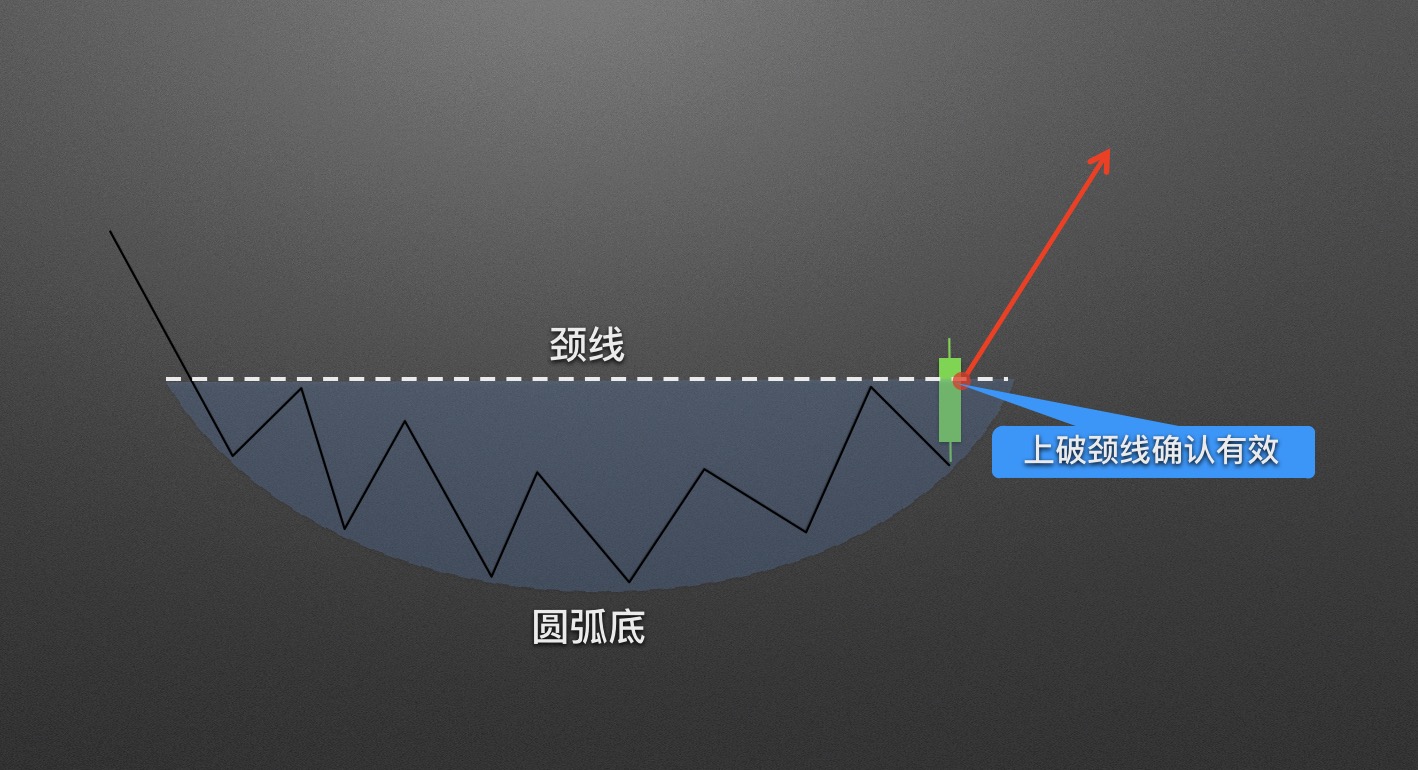
As shown in the figure, when a bullish candle closes and its body breaks above the neckline, only then can we confirm the Rounding Bottom is valid.
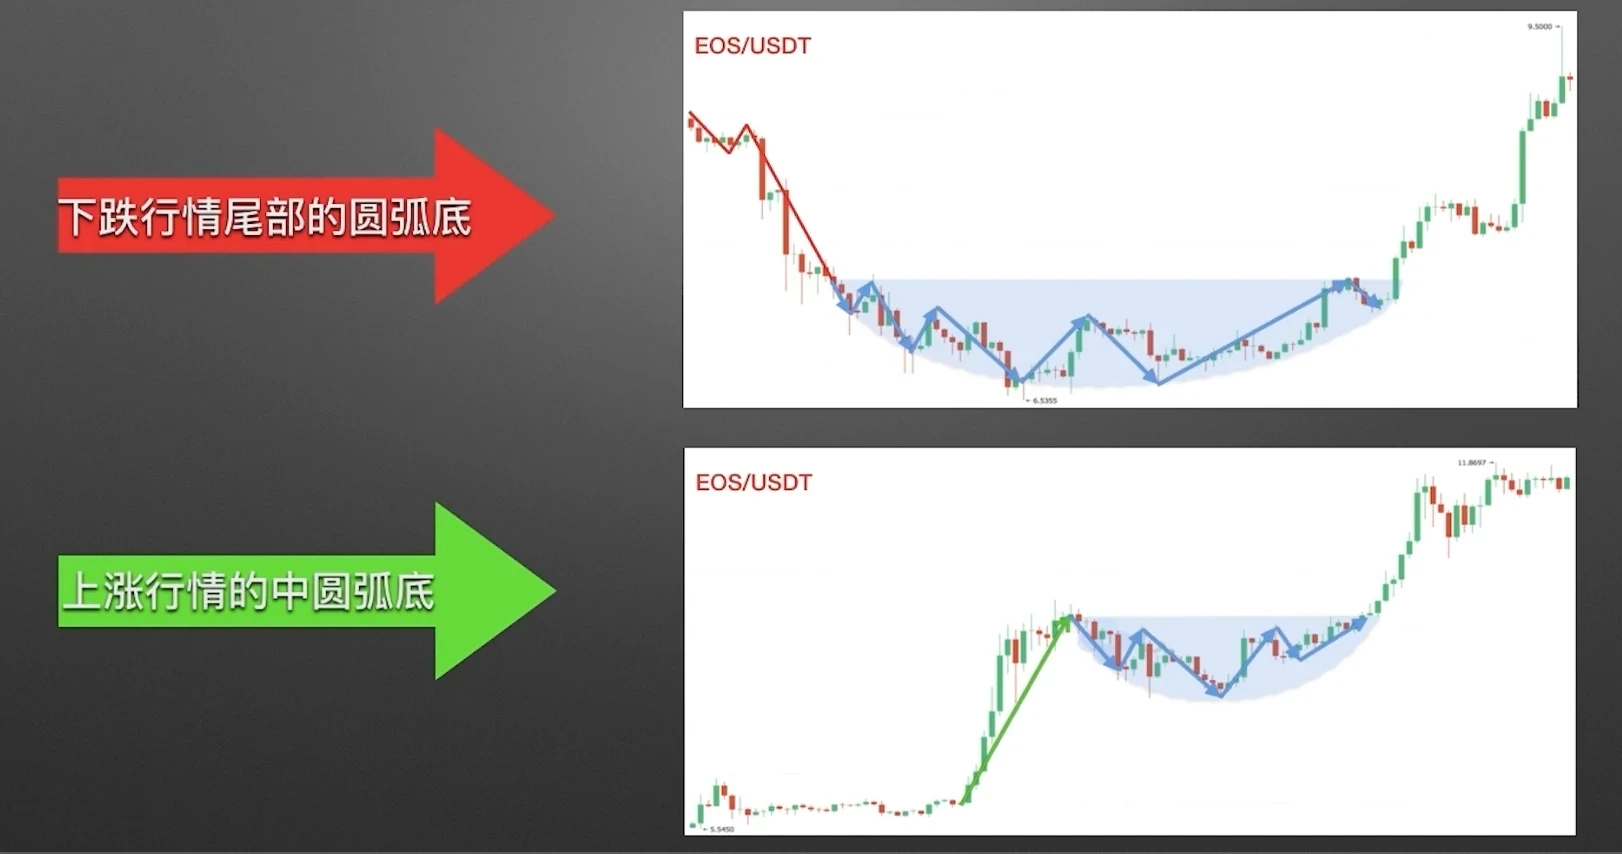
Based on where Rounding Bottoms appear, we classify them into two types: 1) Rounding Bottoms at the end of a downtrend. 2) Rounding Bottoms during an uptrend.
II. Application Rules for Rounding Bottoms
We now have a preliminary understanding of Rounding Bottoms. What guidance do they provide in actual trading?
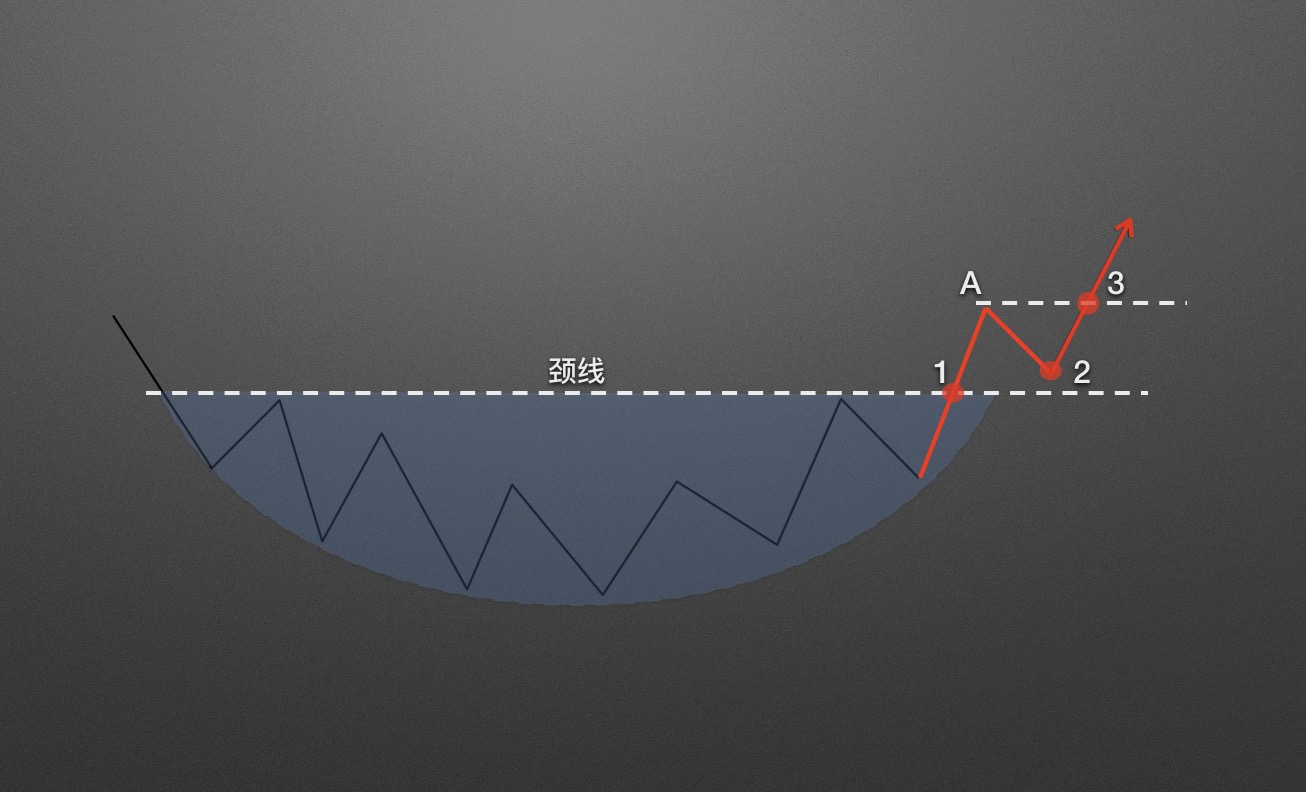
When price effectively breaks above the neckline, the first buy point forms. This buy point belongs to the aggressive category. Buy point 2 appears at the first retest of the neckline after confirming price has broken through neckline resistance. Buy point 3 appears when price, after retesting and confirming support, rises again to break through the level near the previous high.
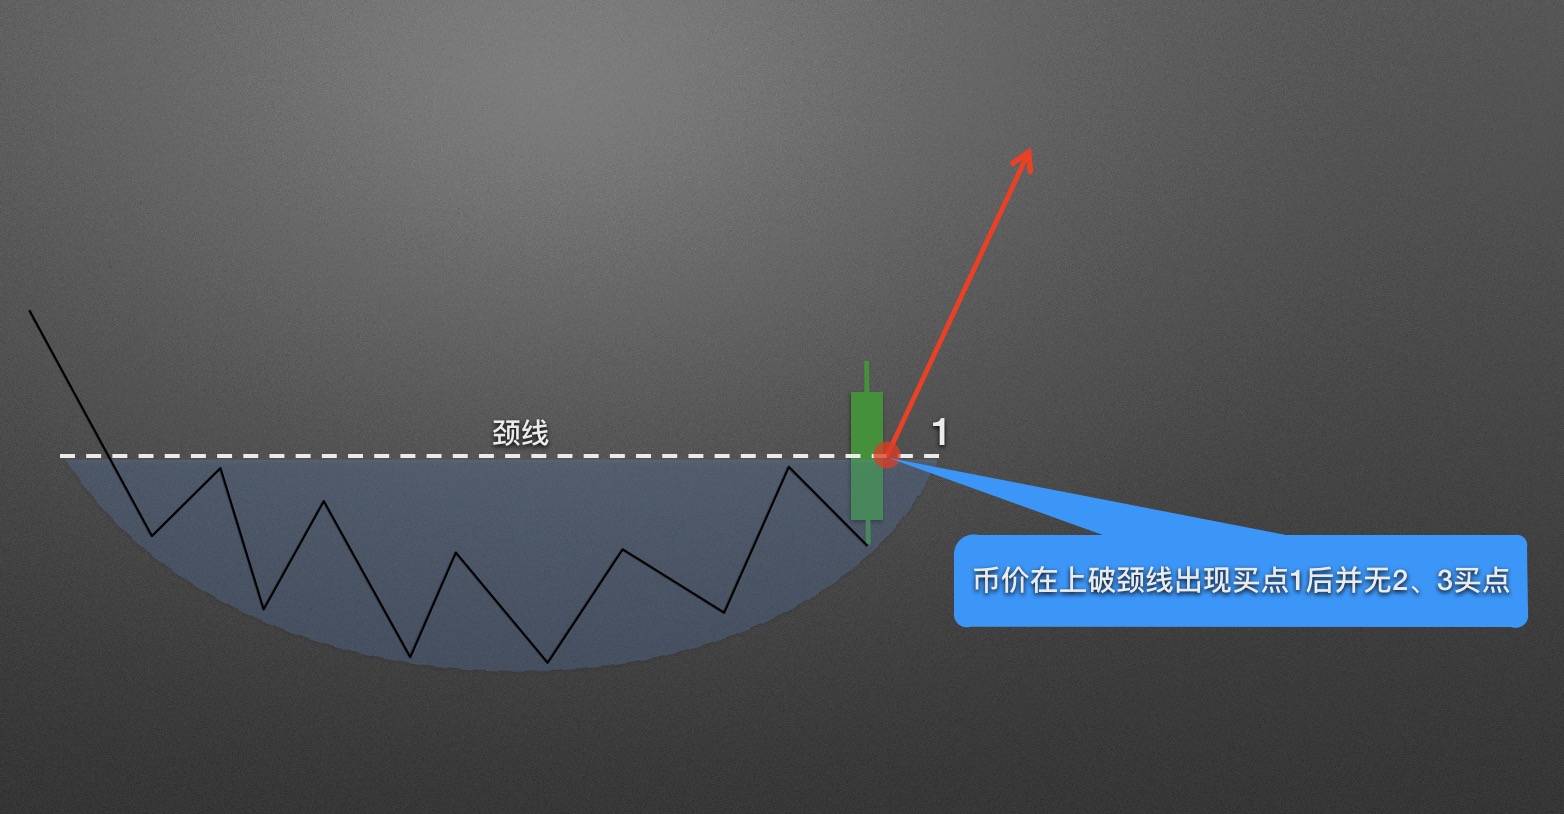
Not every Rounding Bottom will present three buy points. In strong markets, there is usually only one buy point. Price breaks above the neckline with a strong bullish candle, then accelerates upward, leaving nothing behind.
As the saying goes, being able to sell is more important than being able to buy. Knowing how to buy is only the first step of investment. When to sell ultimately determines your profit.
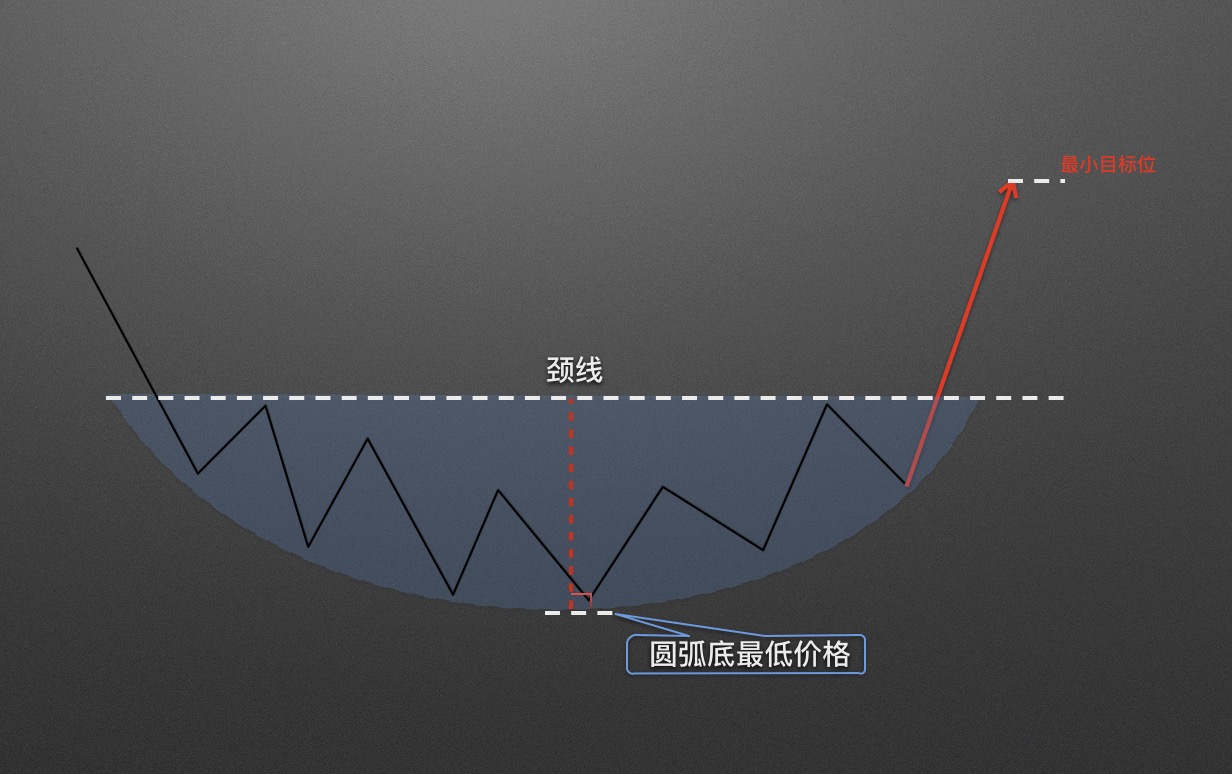
The minimum target for a Rounding Bottom is easily established: it is the vertical distance from the neckline to the bottom of the rounding pattern, as shown in the figure.
We can also roughly predict future upward magnitude based on the formation cycle of the Rounding Bottom.
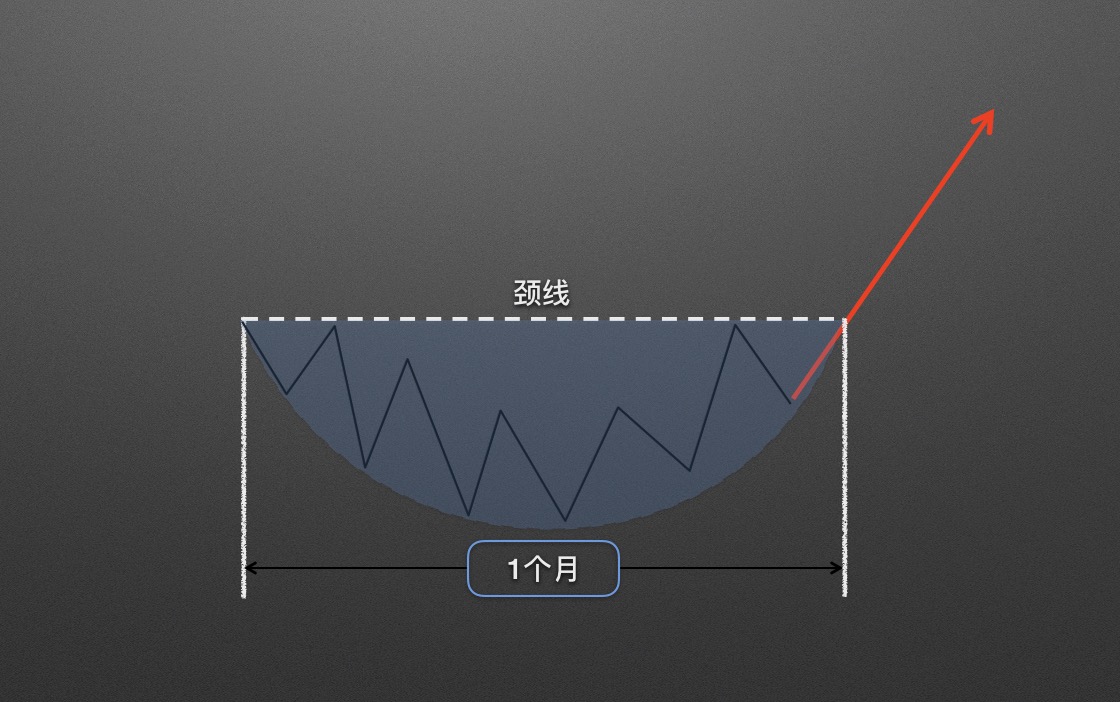
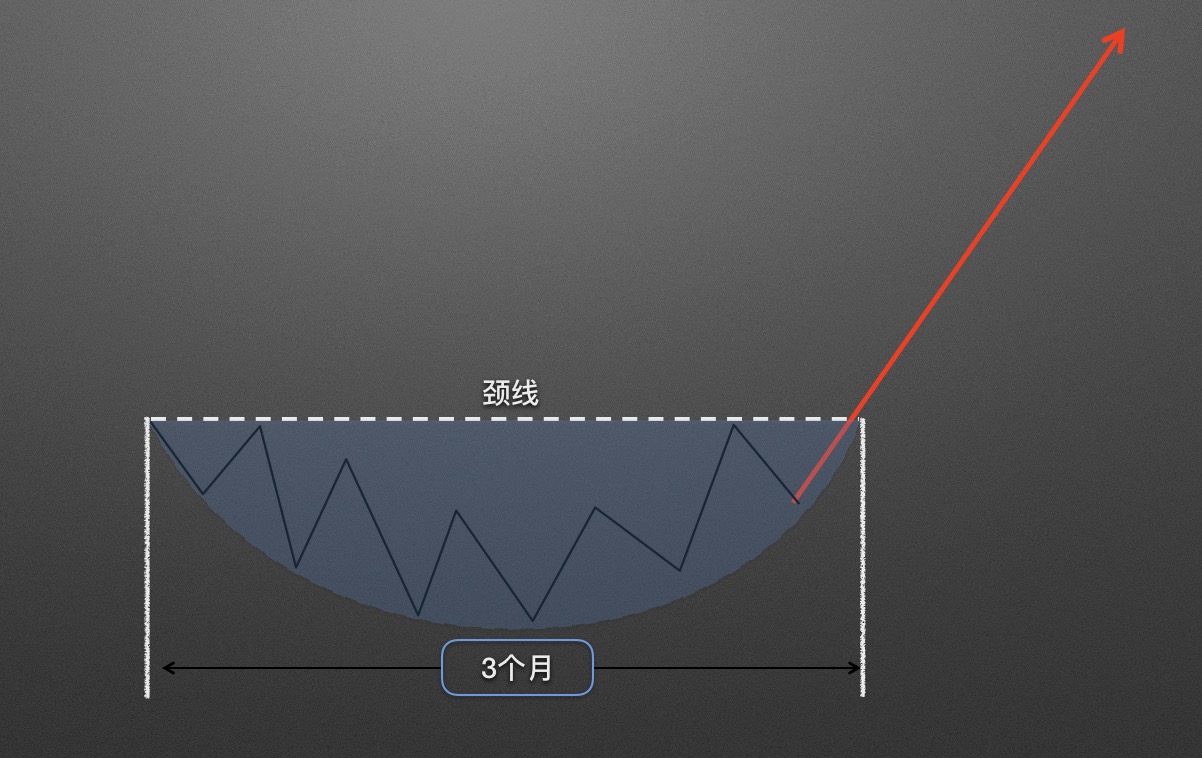
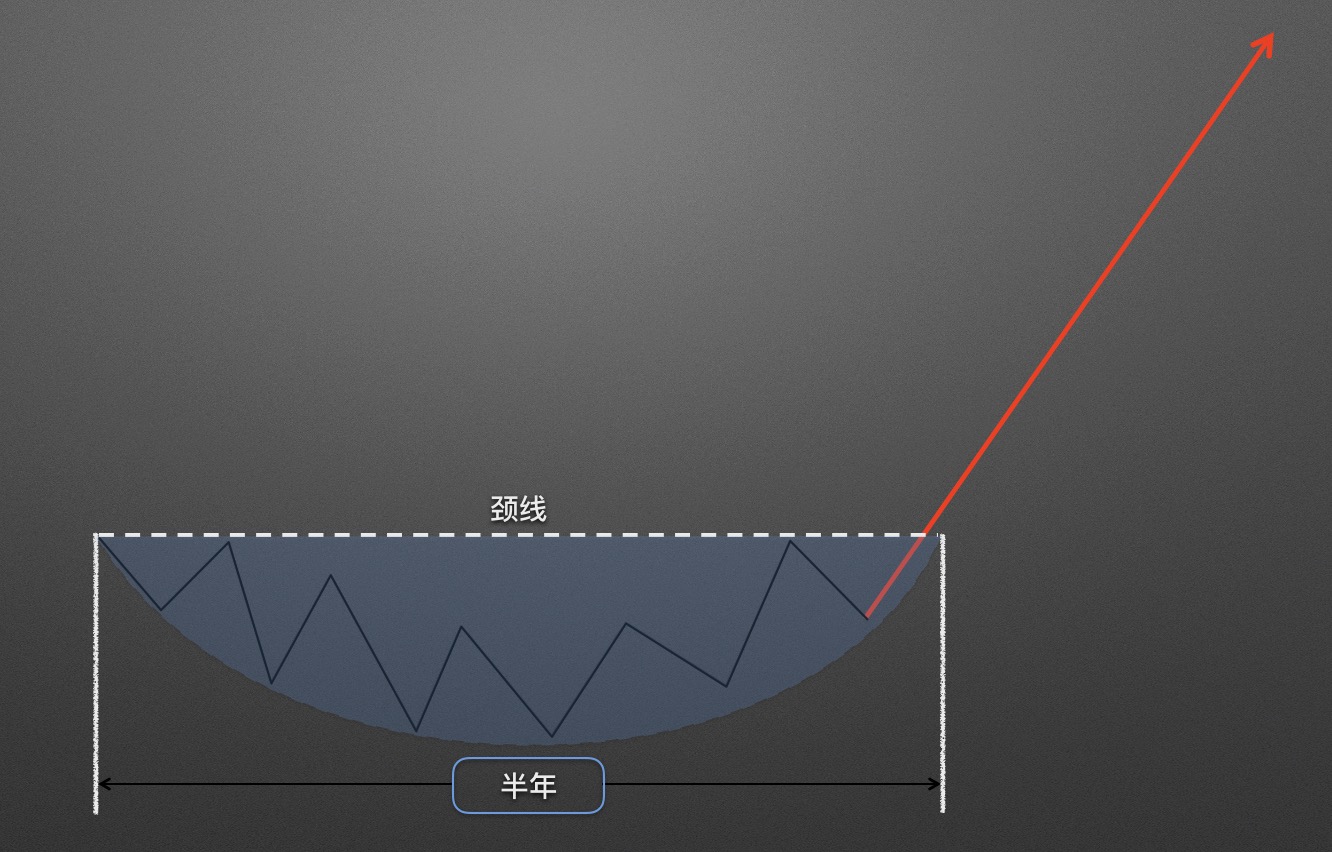
The upside potential of a Rounding Bottom is closely related to the time it takes to form. The longer the Rounding Bottom spans, the greater the potential upside.
Next, let's look at three actual trend charts and do a brief summary.
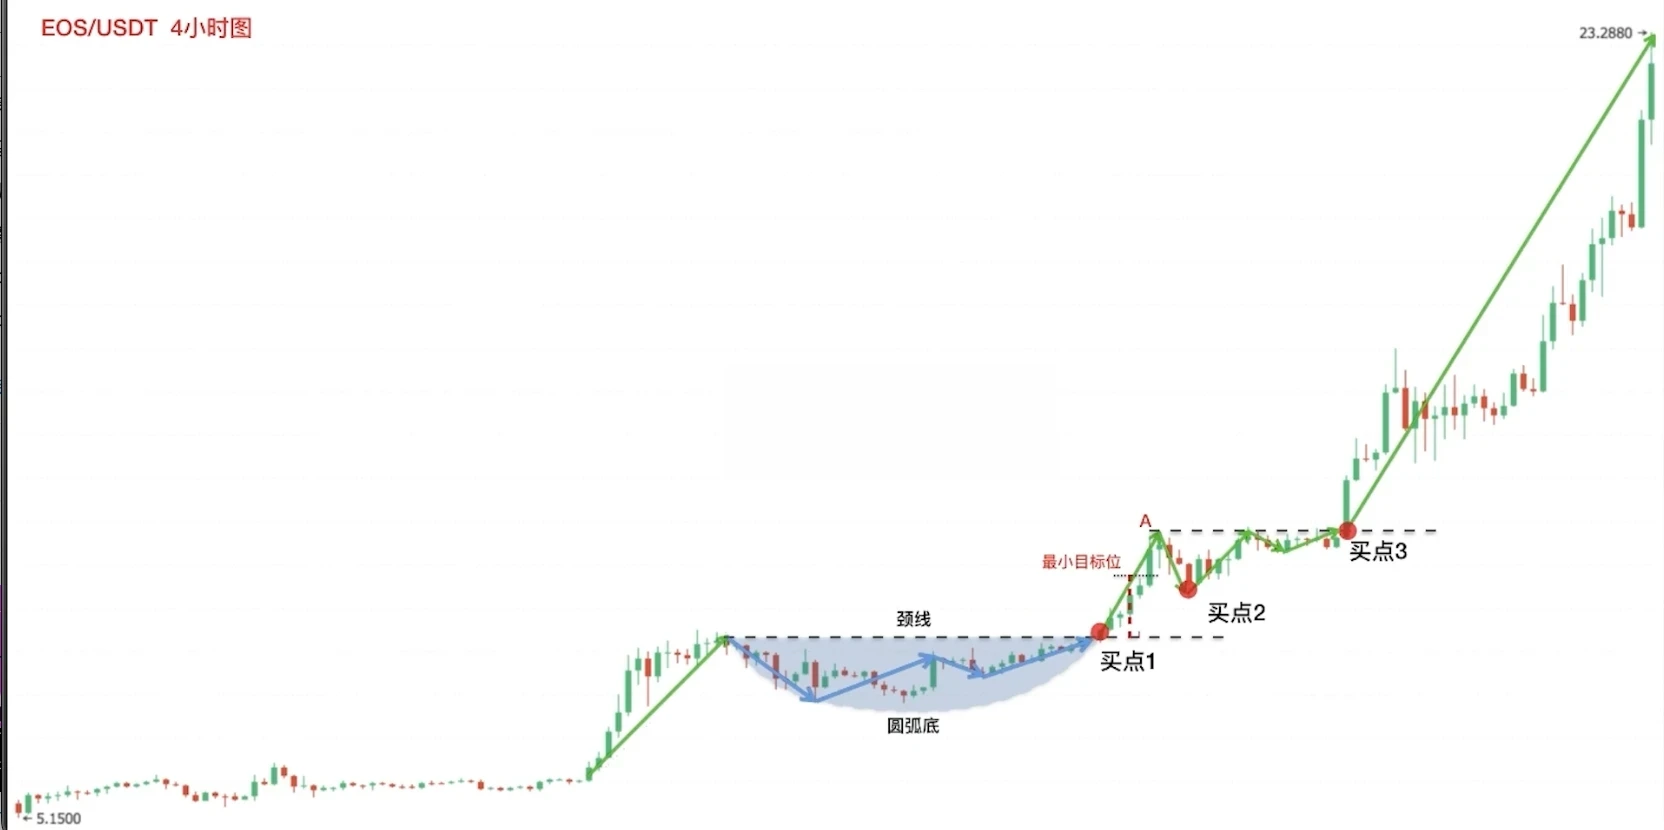
Case 1: The screenshot is a 4-hour chart of EOS/USDT. The Rounding Bottom appeared in the middle of an uptrend. Although the formation time of this Rounding Bottom was relatively short, the subsequent upside was strong, and it successively presented all three types of buy points.
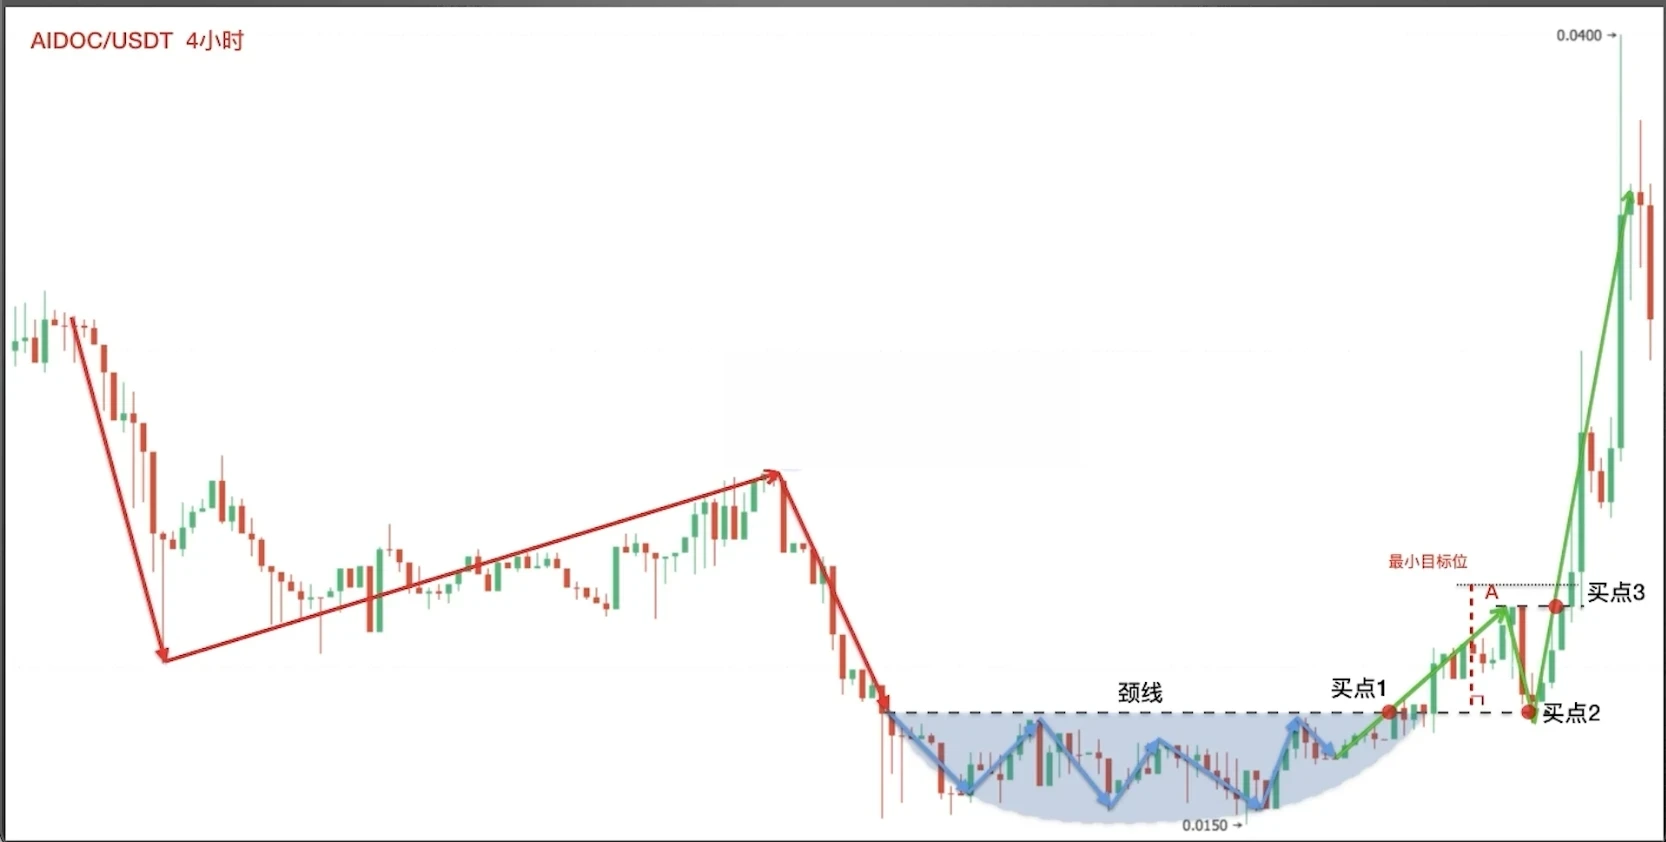
Case 2: The screenshot is a 4-hour chart of AIDOC/USDT. The Rounding Bottom appeared at the end of a downtrend, becoming a reversal pattern, and presented textbook-like three buy points. The final upside far exceeded the minimum predicted target.
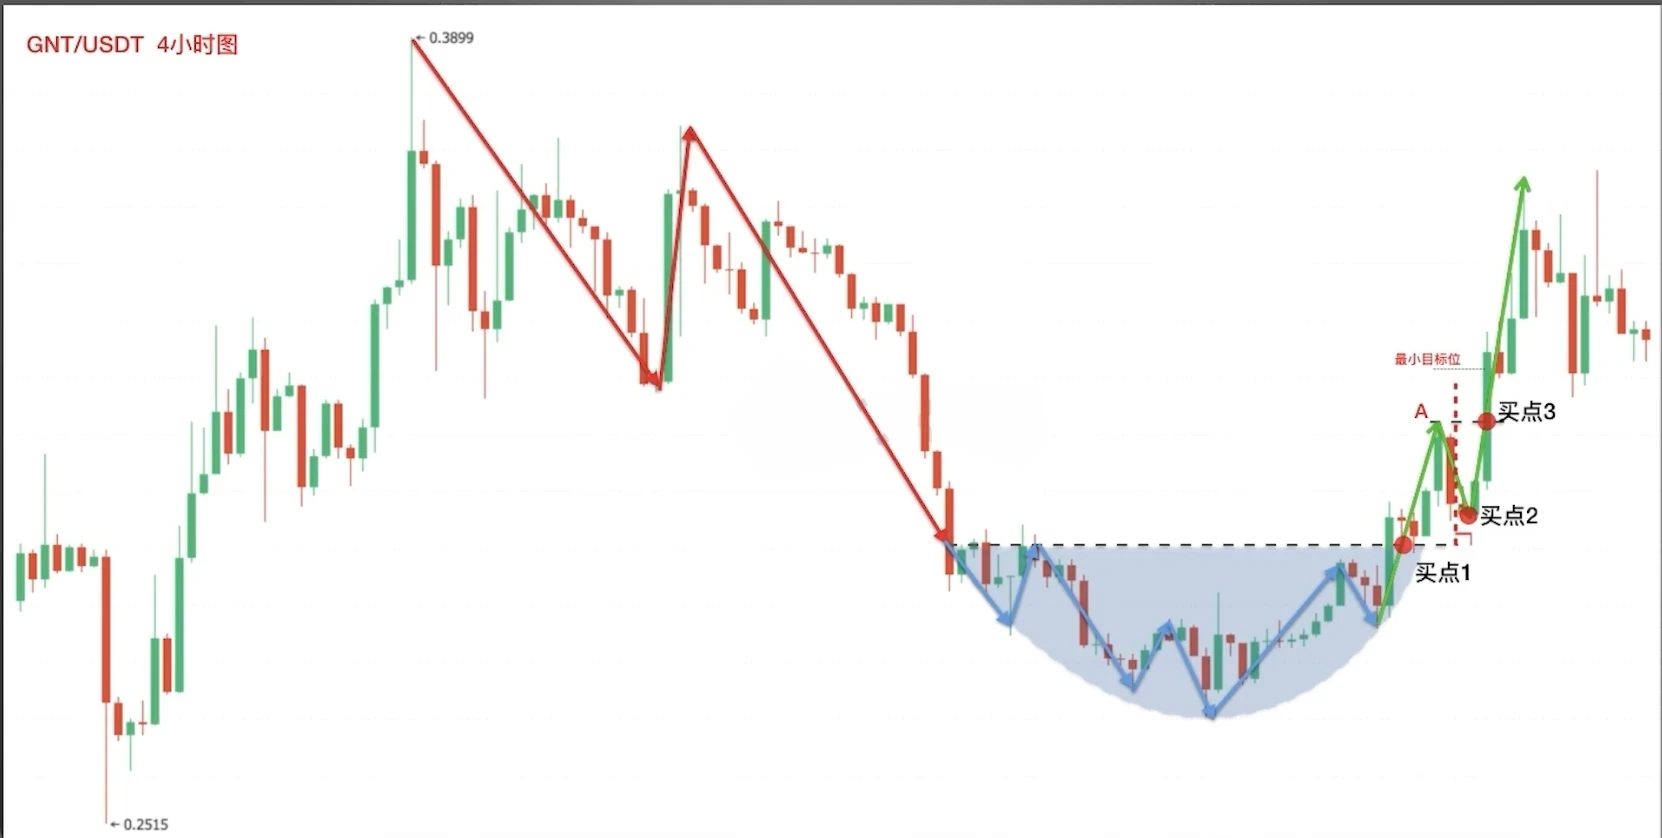
Case 3: The screenshot is a 4-hour chart of OKX GNT/USDT. The Rounding Bottom also appeared at the end of a downtrend. This rounding formation had a relatively short time span, and the subsequent upside continuation was correspondingly short.
Nothing is absolute. Not every Rounding Bottom will necessarily lead to a significant upside. How to guard against "just in case" risks and confirm Rounding Bottom formation failure?
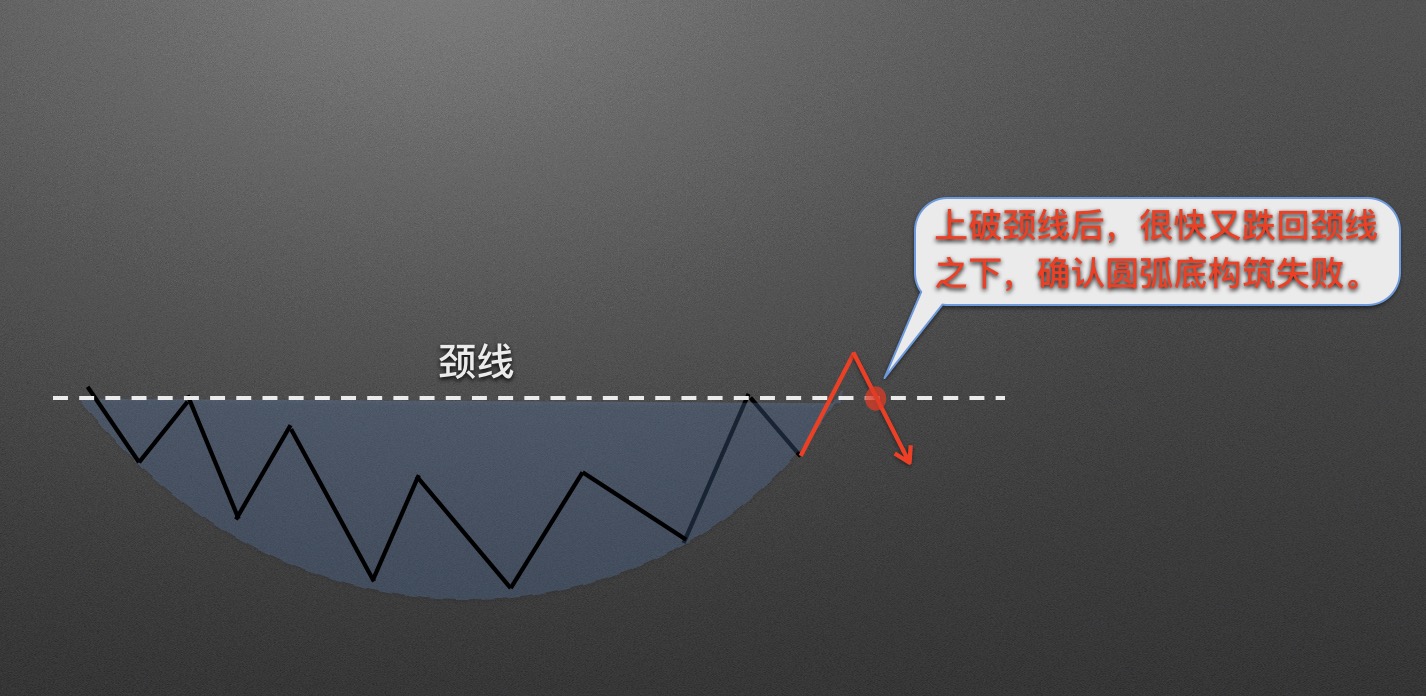
When price, shortly after breaking above the Rounding Bottom neckline, falls back below the neckline again, it can be confirmed as a failed Rounding Bottom formation, and risk avoidance strategies should be executed promptly.
Let's look at two failed cases:
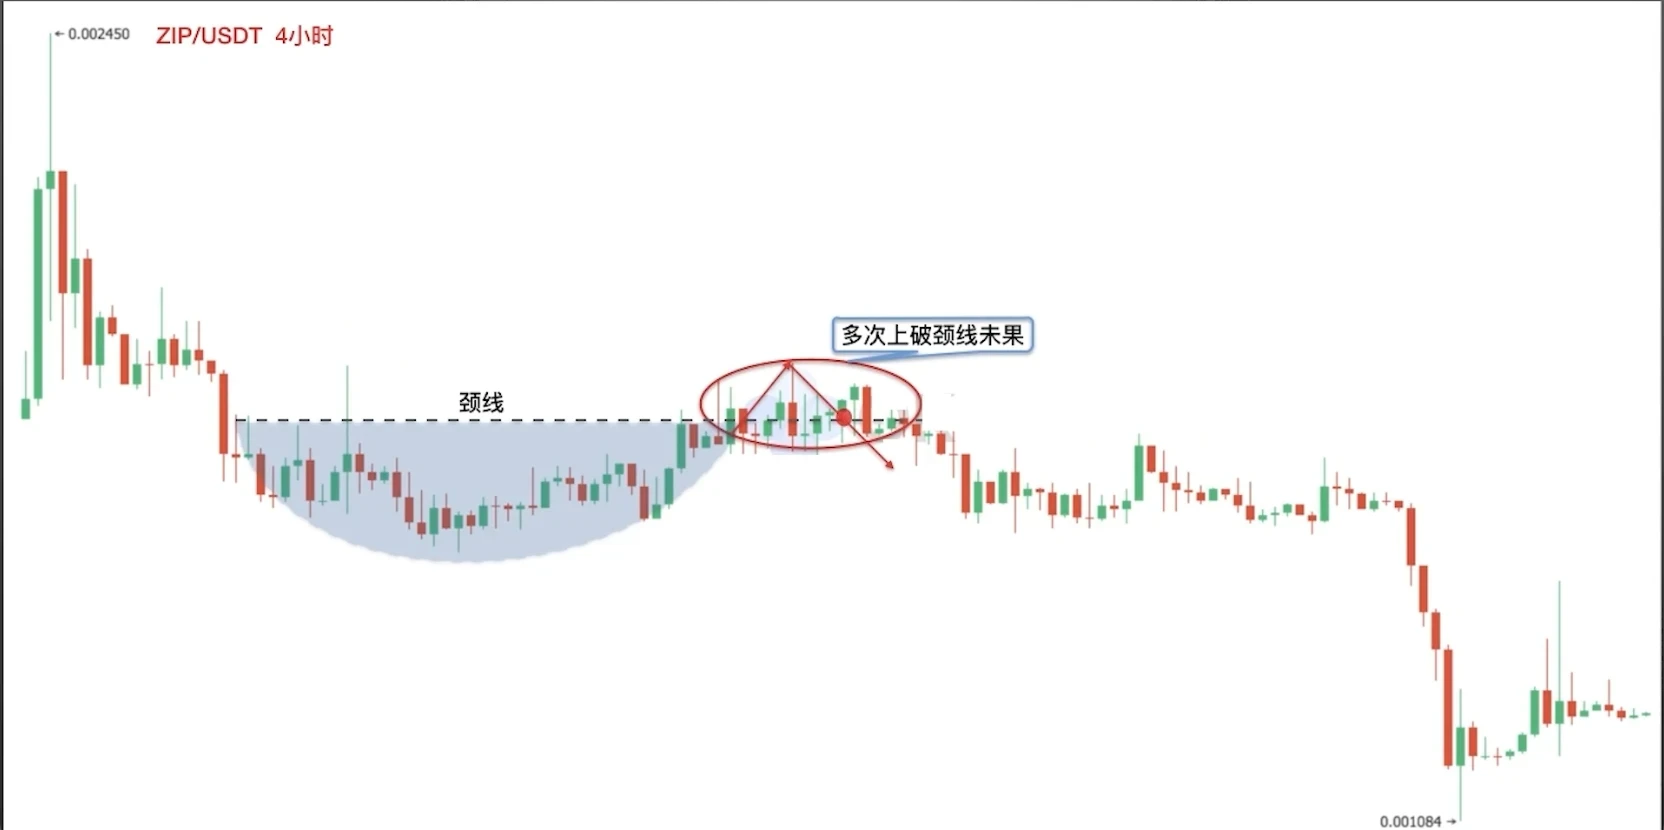
Figure 1 is a 4-hour chart of ZIP/USDT. In this trend, after forming a Rounding Bottom pattern, price attempted to break above the neckline multiple times, but unfortunately failed repeatedly. The Rounding Bottom formation ultimately failed, followed by a decline.
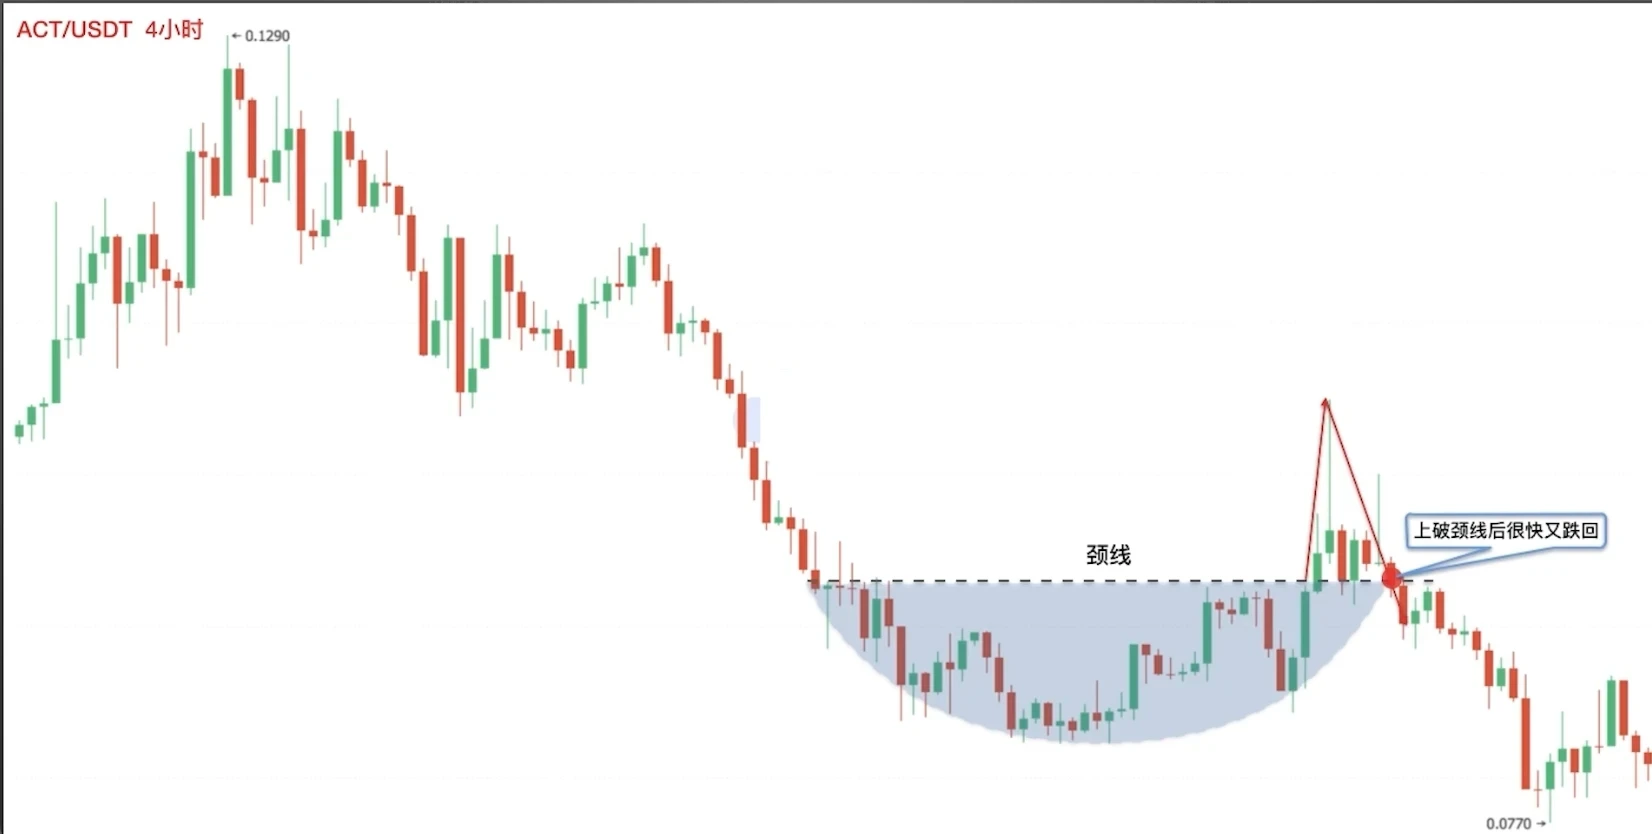
Figure 2 is a 4-hour chart of ACT/USDT. Although price stood above the neckline, it did not show stronger upside after retesting the neckline, and ultimately fell below the neckline again. The Rounding Bottom formation failed, and price continued to trend lower.
The explanation of bottom-fishing patterns ends here. The next lesson will share "top-escape patterns."
Disclaimer
This article may contain product-related content that is not applicable to your region. This article is intended only to provide general information and assumes no responsibility for any factual errors or omissions herein. This article represents only the author's personal views and does not represent the views of OKX. This article is not intended to provide any recommendations, including but not limited to: (i) investment advice or investment recommendations; (ii) offers or solicitations to buy, sell, or hold digital assets; or (iii) financial, accounting, legal, or tax advice. Holding digital assets (including stablecoins) involves high risk, may fluctuate significantly, and may even become worthless. You should carefully consider whether trading or holding digital assets is suitable for you based on your financial situation. For questions regarding your specific situation, please consult your legal/tax/investment professional. The information appearing in this article (including market data and statistics, if any) is for general reference only. Although we have taken all reasonable precautions in preparing these data and charts, we assume no responsibility for any factual errors or omissions expressed herein. © 2025 OKX. This article may be reproduced or distributed in full, or excerpts of 100 words or less from this article may be used, provided such use is non-commercial. Any reproduction or distribution of the entire article must also prominently state: "Copyright © 2025 OKX. Used with permission." Permitted excerpts must cite the article name and include attribution, for example "Article Name, [Author Name (if applicable)], © 2025 OKX". Some content may be generated or assisted by artificial intelligence (AI) tools. Derivative works or other uses of this article are not permitted.
Show More
Recommended Reading

Profit from Bitcoin Declines? How to Trade Contracts
As the cryptocurrency market scale represented by Bitcoin continues to expand, various forms of derivative trading have gradually emerged beyond spot trading as tools to hedge risk. Among them, contract trading attracts the most attention. What is contract trading? Contracts are the most common trading form in the cryptocurrency derivatives market. Digital asset contract trading refers to buyers and sellers agreeing to trade a specific asset at a specified price at a future time.
January 16, 2026

Simpler Than Copy Trading? One-Click Follow Top Strategy Traders on OKX, Let Traders Earn for You
Whether in traditional finance or the cryptocurrency market, strategy trading is a very important and crucial method in the trading system. When facing complex trading environments and extreme market conditions, even with solid theoretical technical knowledge and rich trading experience, it's easy to miss trading opportunities or make wrong judgments and operations due to emotional influence. Strategy trading is precisely an effective tool that can solve these problems. With trading tools available, how to use them
November 21, 2025

Five, Strategy Trading Series — Crypto Savings
Preface: We often have this speculation: In bull markets, there are many digital assets with significant gains. If you can continuously capture assets with large increases, for example, catching a doubling digital asset every month, after one year your assets will become 2 to the power of 12, that is, 4096 times, which is very amazing. Of course, this is also almost impossible to complete, because we find it difficult to continuously catch surging assets. This is also a problem many users encounter: In bull markets, although
November 3, 2025

Which Countries/Regions Do Not Support Registration to Use OKX
OKX currently does not provide services to customers in the following regions: certain U.S. territories, such as New York, Texas, Puerto Rico, American Samoa, Guam, Commonwealth of the Northern Mariana Islands, U.S. Virgin Islands (St. Croix, St. John, and St. Thomas), Cuba, Iran, North Korea, Crimea, Malaysia, Syria, Bangladesh, and Bolivia. For details, please refer to the OKX Terms of Service.
April 25, 2024

Quickly Understand OKX Common Products and Features
OKX (www. okx. com) is one of the globally renowned digital asset service platforms, primarily providing global users with Bitcoin, Ethereum, and other digital asset spot and derivative trading services, while also exploring the world of DeFi, dApps, NFTs, and GameFi with users. On OKX, you can enjoy smooth trading experiences such as spot and contract trading, keep up to date with token information in hot areas/concepts, and also
April 25, 2024

Candlestick Charts for Beginners | 5 Importance of Candlestick Combination Applications
Price movements follow trends; understand the language of price; buy and sell signals exist; say goodbye to emotional trading. I. Bullish Candlestick Combinations at Key Positions In the first two lessons of this chapter, we explained applications of bullish and bearish candlestick combinations, but these combinations are not effective in any position. In this section, we explain the importance of where combinations appear. In which positions can bullish combinations better play their role? The first situation: In a clear uptrend, near the previous
April 25, 2024


