Zero-Basics of Candlestick Charts | 13 Top Escape Pattern — "M" Head
Uptrends and downtrends reveal price action;
Buy and sell signals take the guesswork out of trading.
1. The "M" Head Pattern
In this lesson, we will learn about the top escape pattern Part 2 — the M head. Let's take a look at what the "M" head pattern looks like.
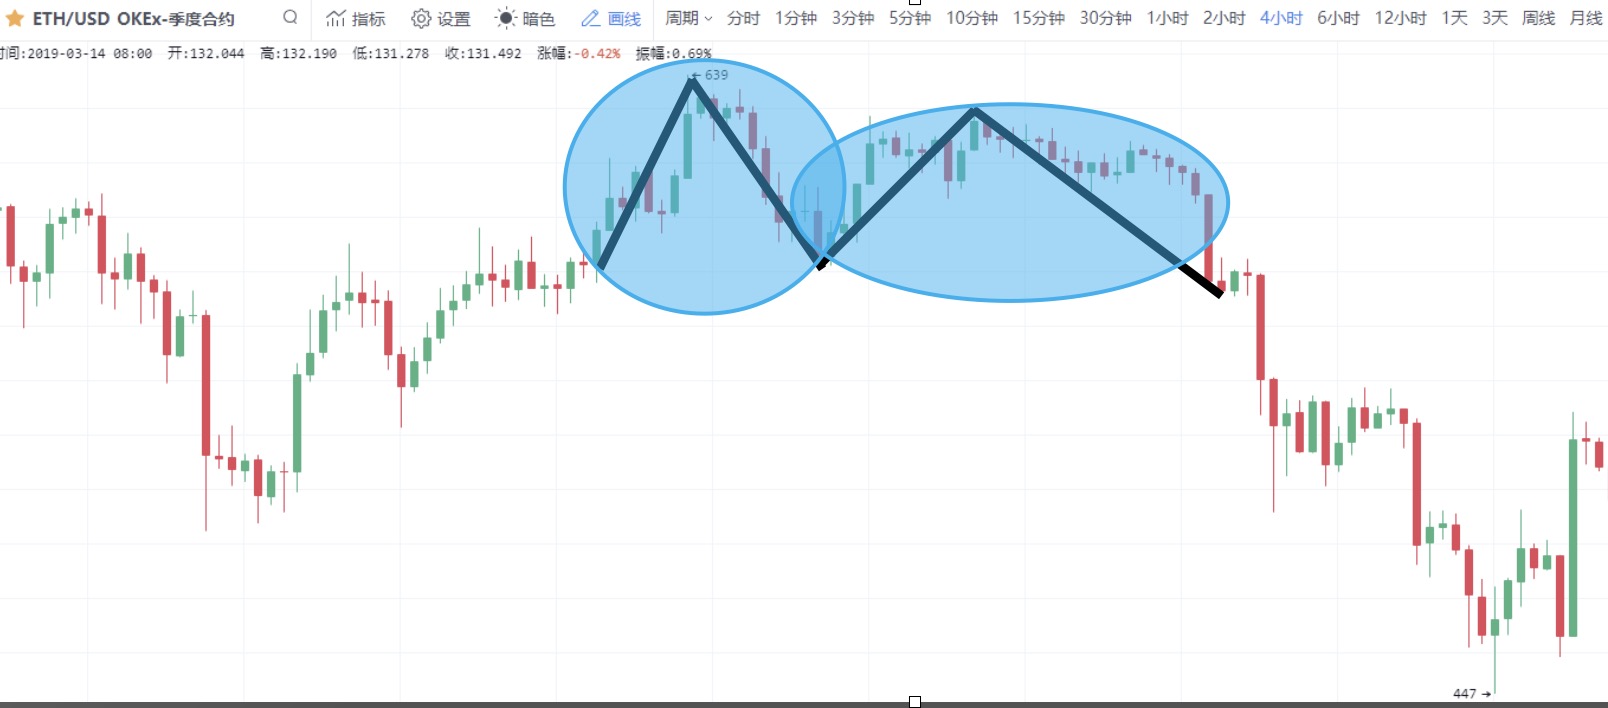
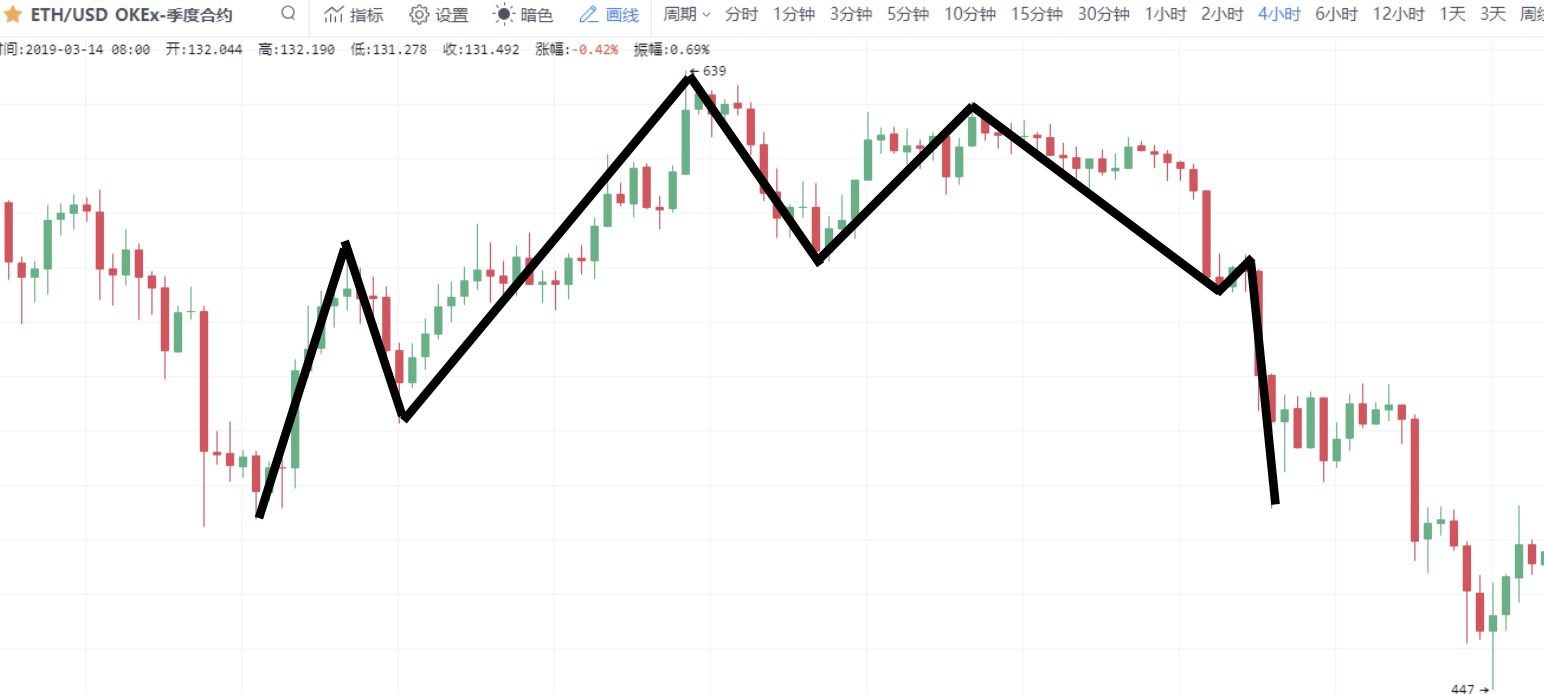
Screenshot from OKX Ethereum Quarterly Contract candlestick chart. The drawn lines show the M head structure. Because its shape resembles a double-headed monster, it is also called a double top pattern.
How do we use the M head to predict future price direction?
Let's pull up a simplified diagram of the M head after technical analysis processing, making its structure look cleaner and clearer. We also draw an important bull-bear boundary reference line — the neckline.
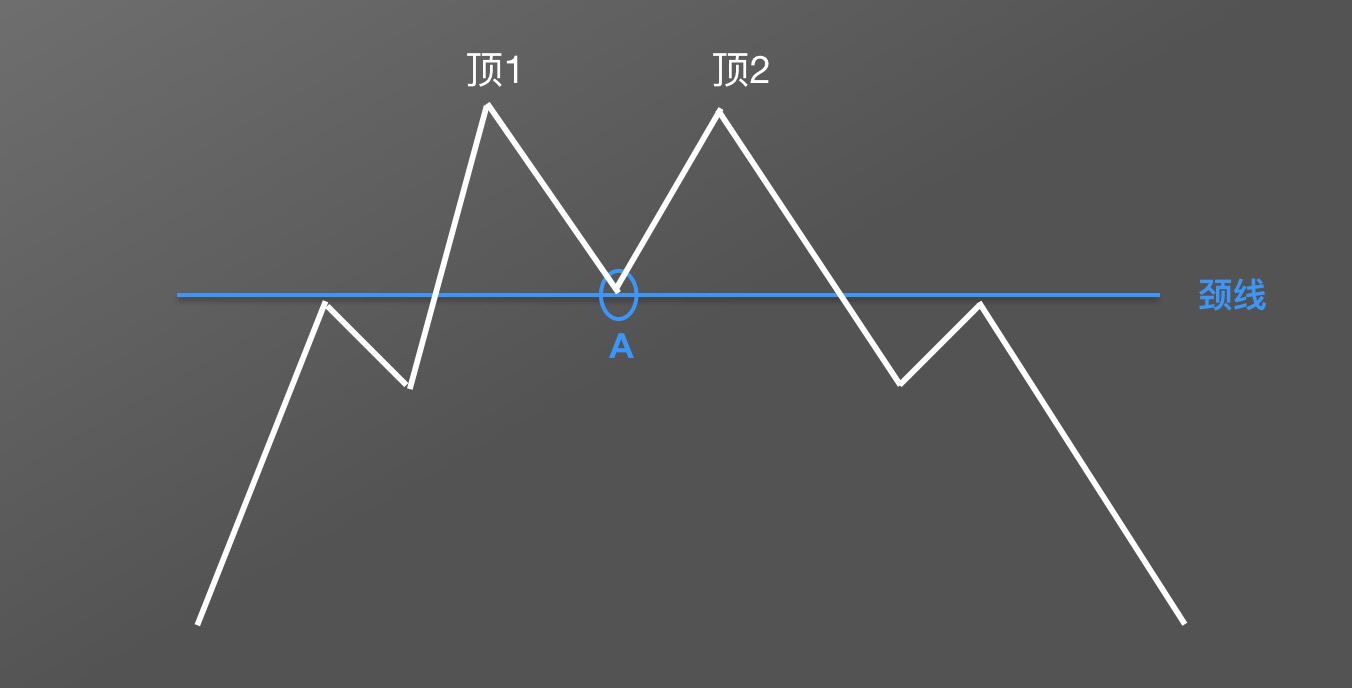
First, find the lowest point A between the two tops. Draw a horizontal straight line through point A to get the neckline.
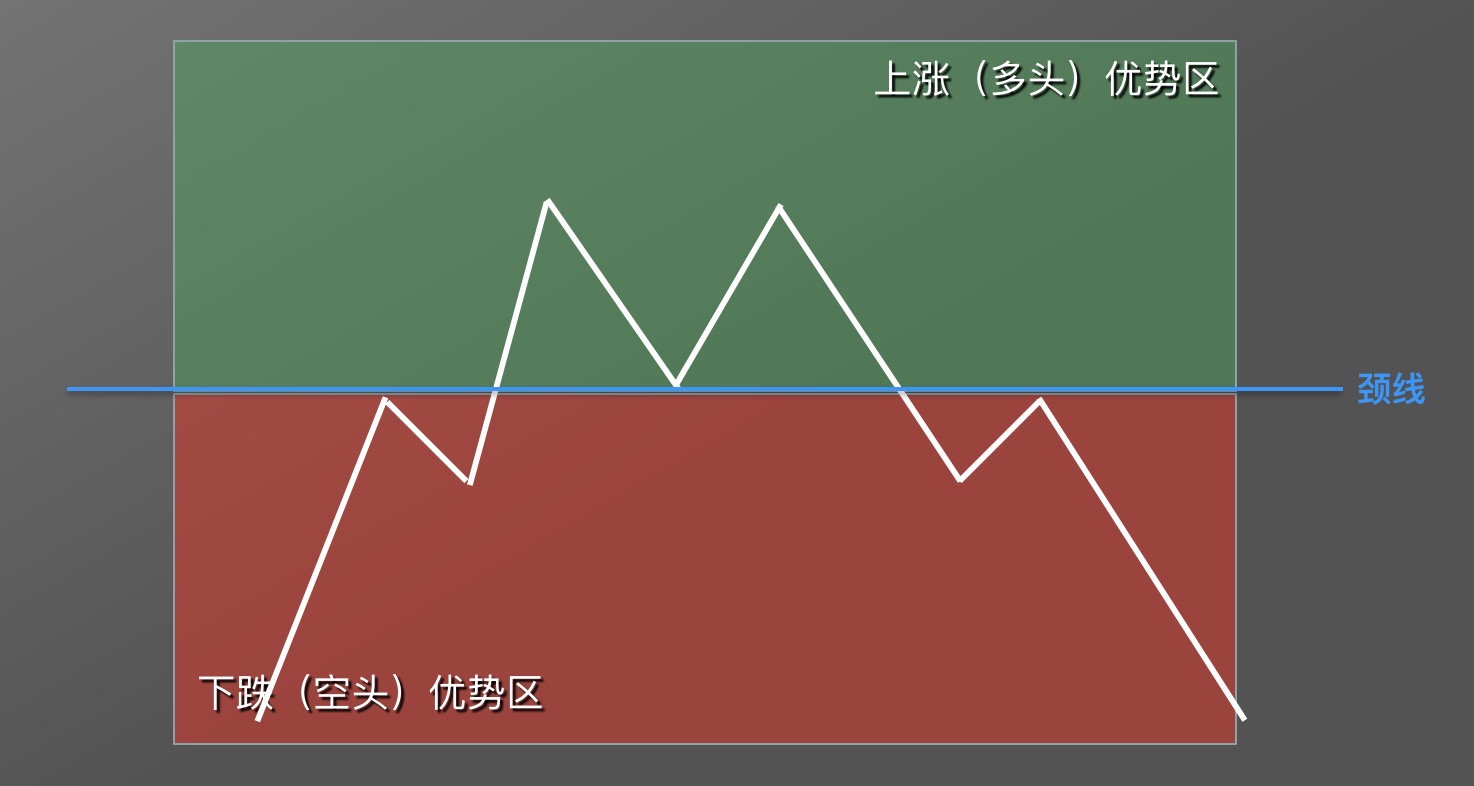
Above the neckline is the uptrend bull advantage zone — within this range, going long is advisable and shorting is not. Below the neckline is the downtrend bear advantage zone — within this range, shorting is advisable and going long is not.
2. Application Rules for the "M" Head Pattern
How do we seize a good selling opportunity?
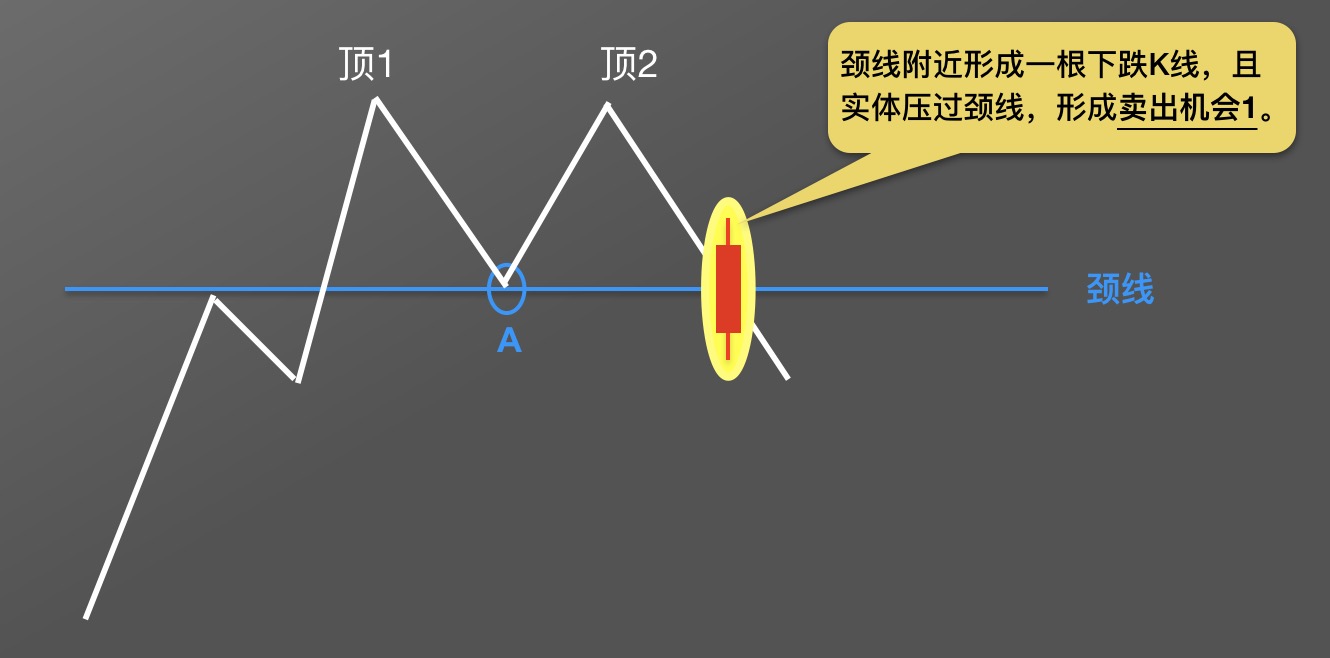
When an M head forms within a certain candlestick period, the candlestick that breaks through the neckline is shown in the diagram — it is a red bearish candlestick, and the candlestick body breaks through the neckline. This position forms the first selling opportunity.
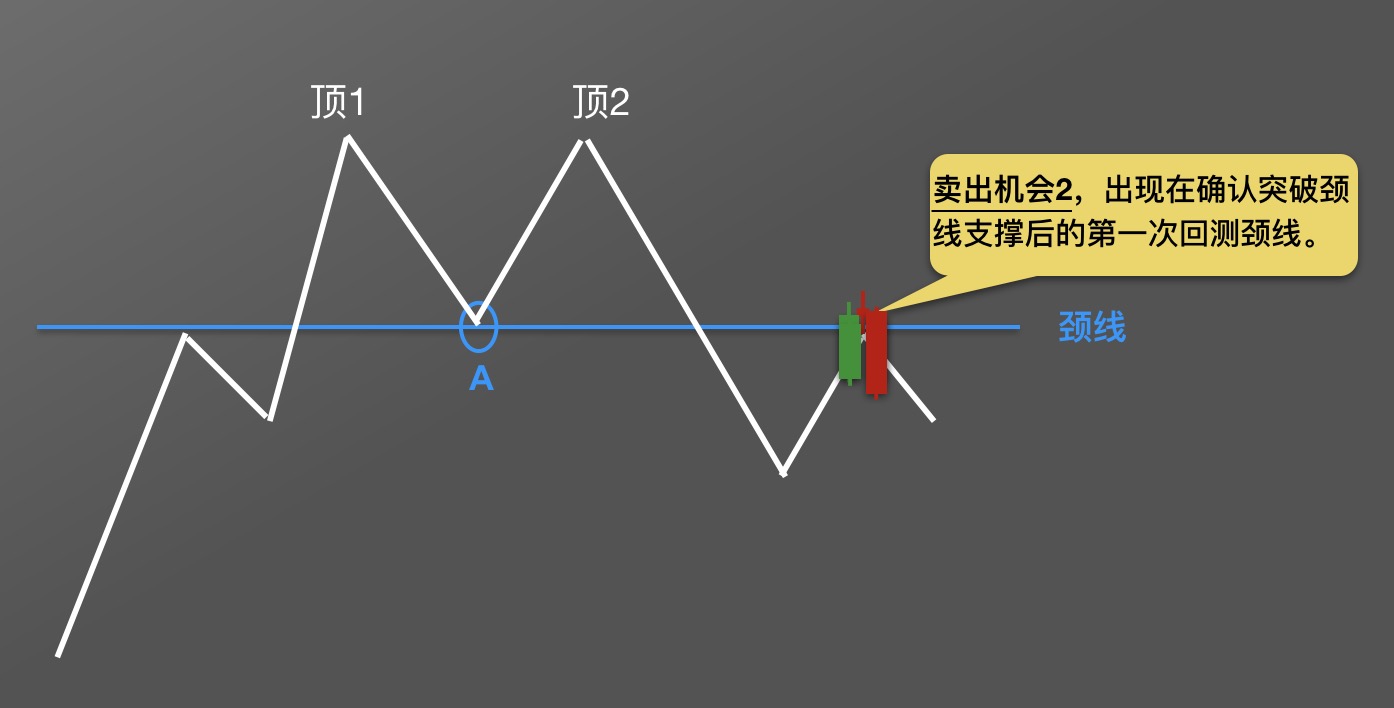
After the price breaks below the neckline, it may form a small upward retracement. When price pulls back near the neckline and appears as bearish candlestick patterns such as engulfing or evening star, Selling Opportunity 2 is formed. Engulfing and evening star patterns were covered in Lessons 4 and 5 — you can review them for reinforcement.
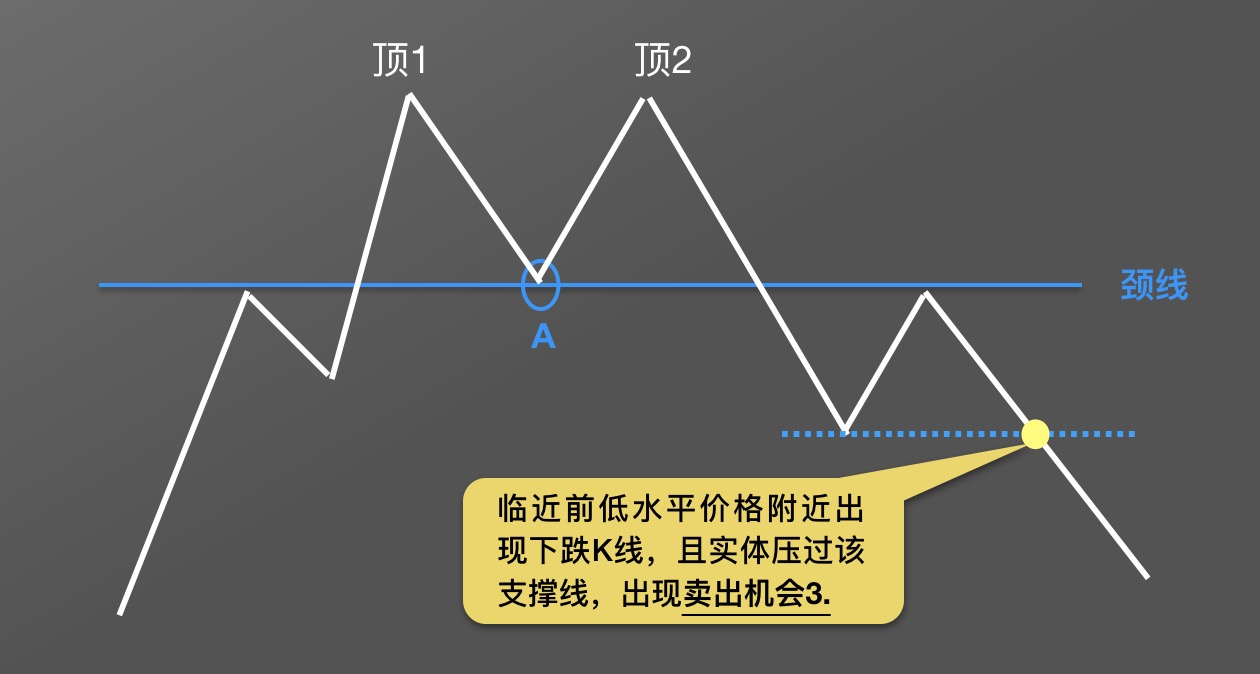
Selling Opportunity 3 appears when, after the price retraces to the neckline, it breaks down again by penetrating the nearby swing low.
Let's summarize the selling techniques for the M head pattern.
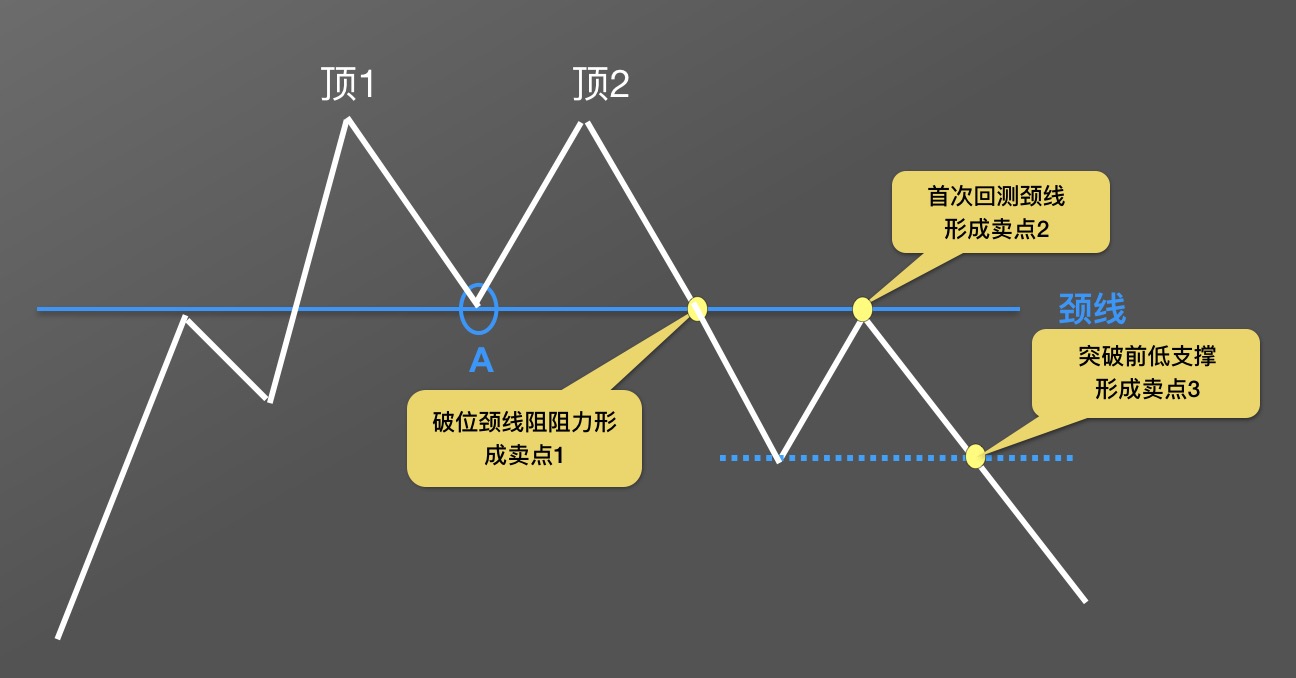
First, confirm the two important peaks of the M head pattern and draw the important bull-bear reference line — the neckline. ① As the market evolves, we identify the neckline break — Selling Opportunity 1, ② the pullback to the neckline — Selling Opportunity 2, ③ the break below the nearby swing low — Selling Opportunity 3.
Can the M head pattern predict the future decline target?
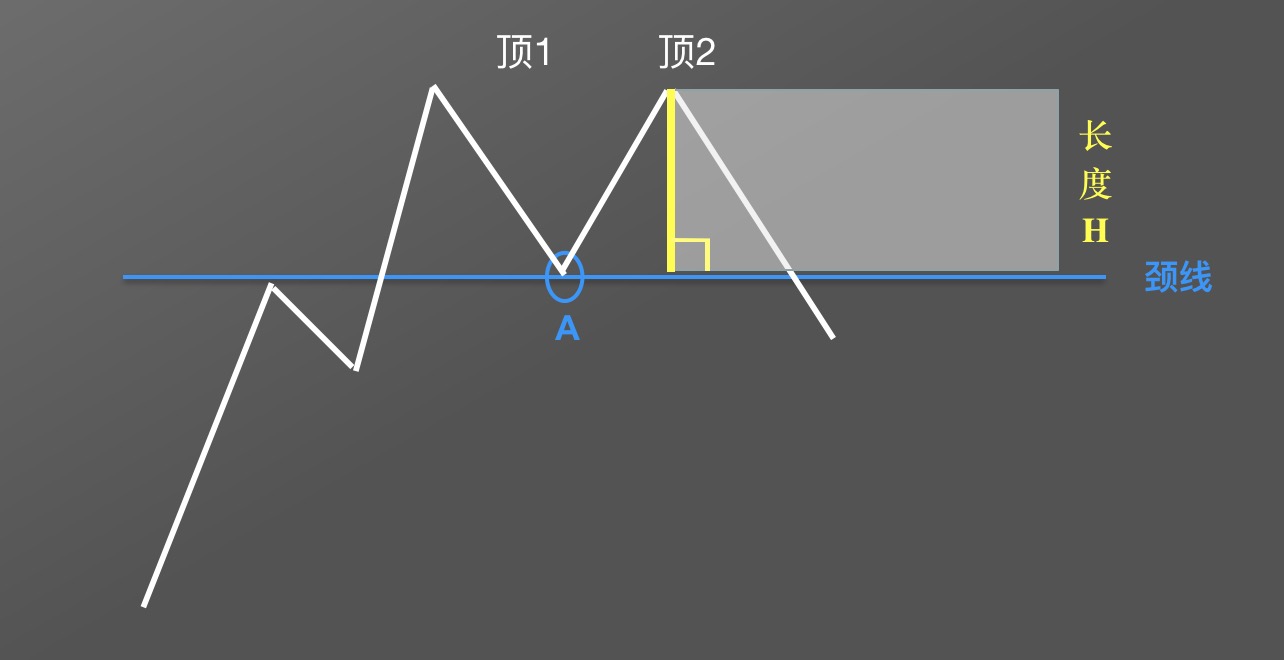
First, draw a vertical line segment from the peak of the shorter head down to the neckline, and determine the length of this vertical segment as H.
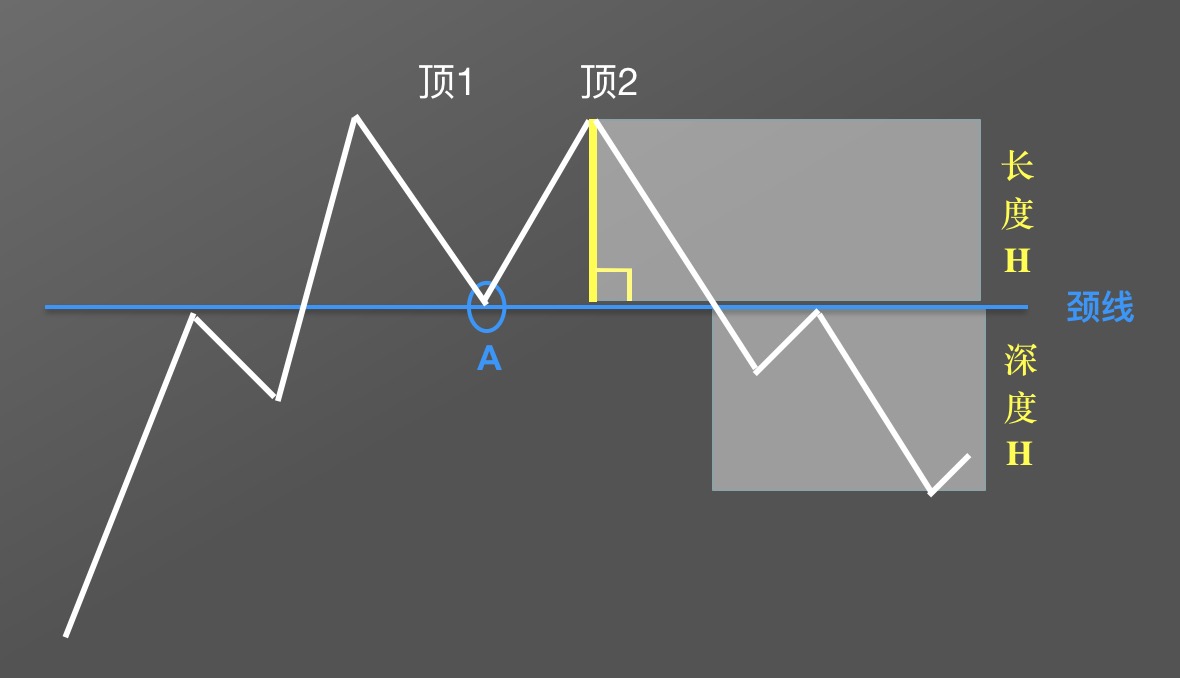
Move this vertical segment below the neckline as shown. The future price will most likely fall to a depth of H. Of course, if the downward trend is strong, the decline will continue longer and deeper. The excess portion falls outside the predictable range.
Let's review a few real-world cases to test the practical application results.
Screenshot from OKX Bitcoin Quarterly Contract 4-hour candlestick chart. After a sustained rally, a double top structure formed at the high, followed by a medium bearish candlestick completing the breakdown. The afterward saw a sustained decline, forming a complete trend reversal.
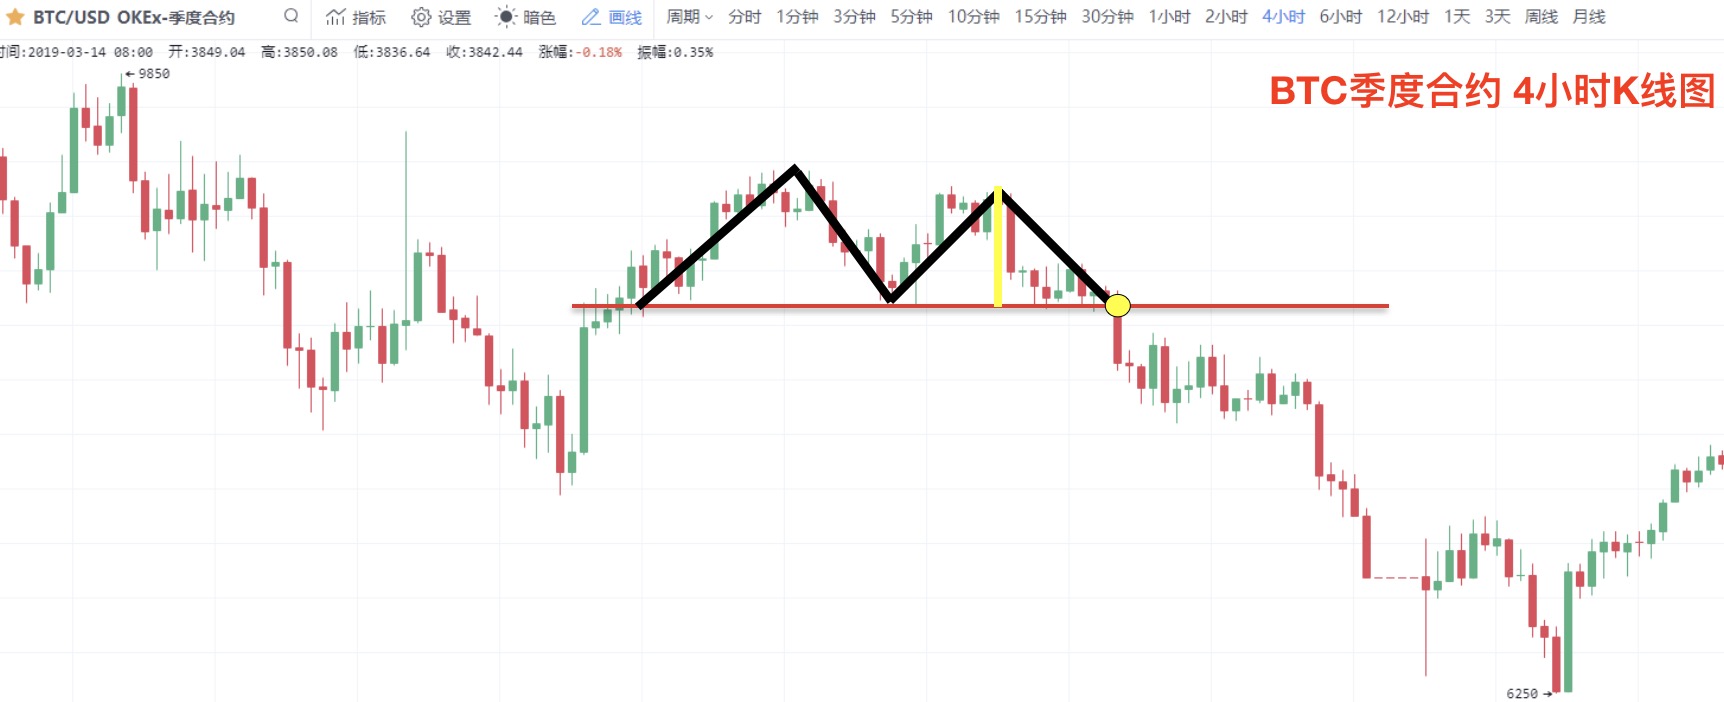
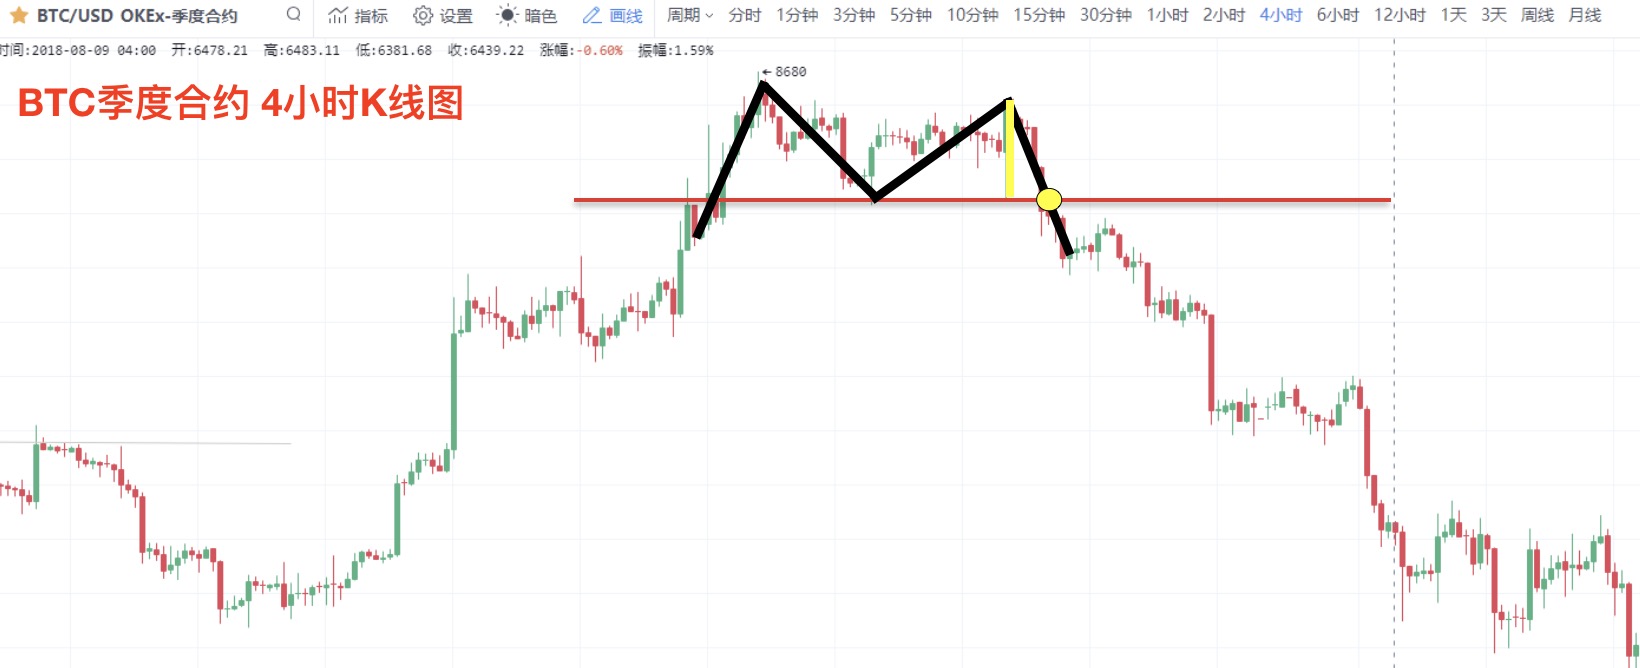
Case 2 screenshot is also from OKX Bitcoin Quarterly Contract 4-hour candlestick chart. This M head structure appeared near the end of a minor rally trend. After the price broke below the neckline, it only provided one textbook selling opportunity.
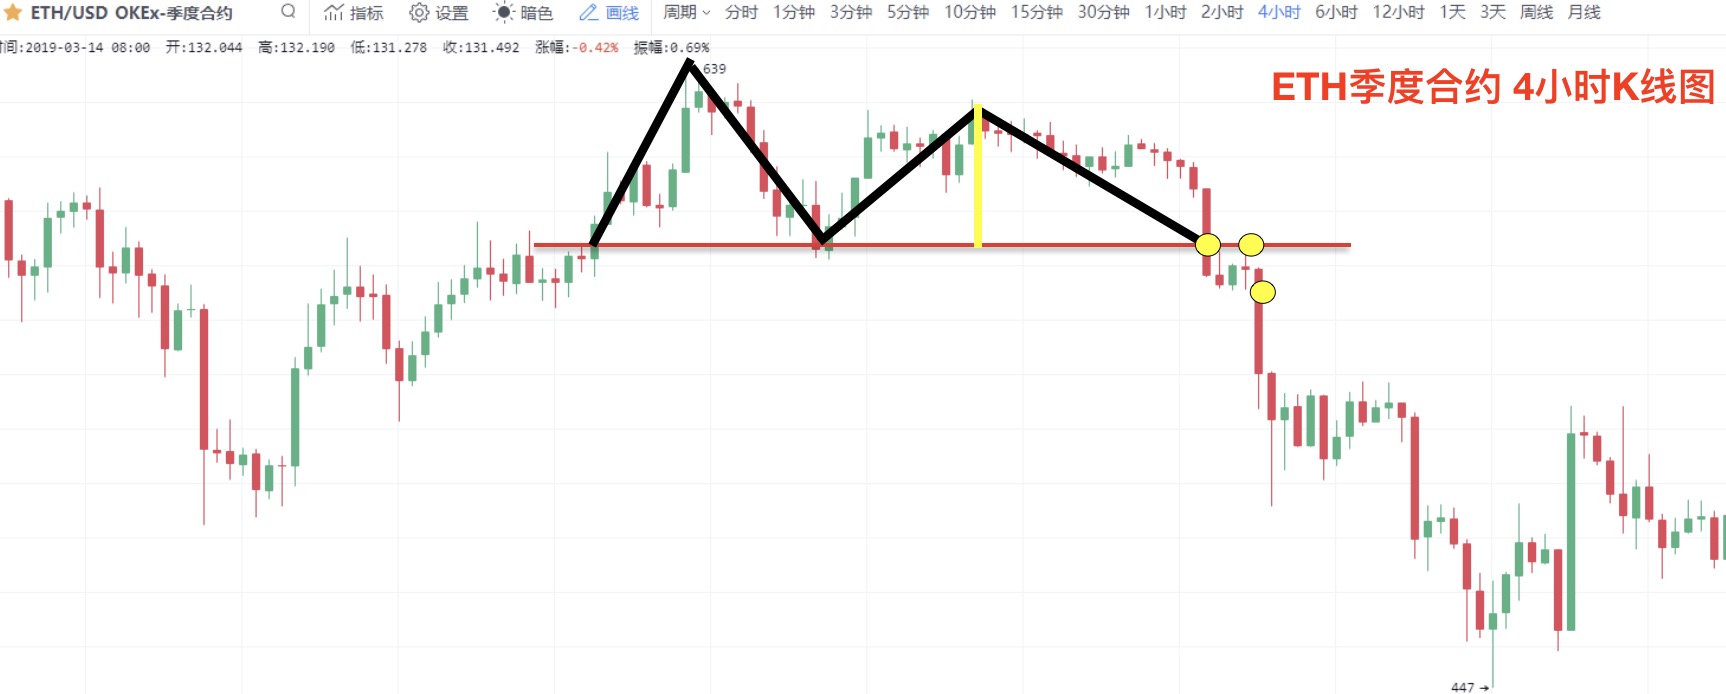
Case 3 screenshot is from OKX Ethereum Quarterly Contract 4-hour candlestick chart. After the price broke below the M head structure's neckline, three textbook selling opportunities appeared in succession.
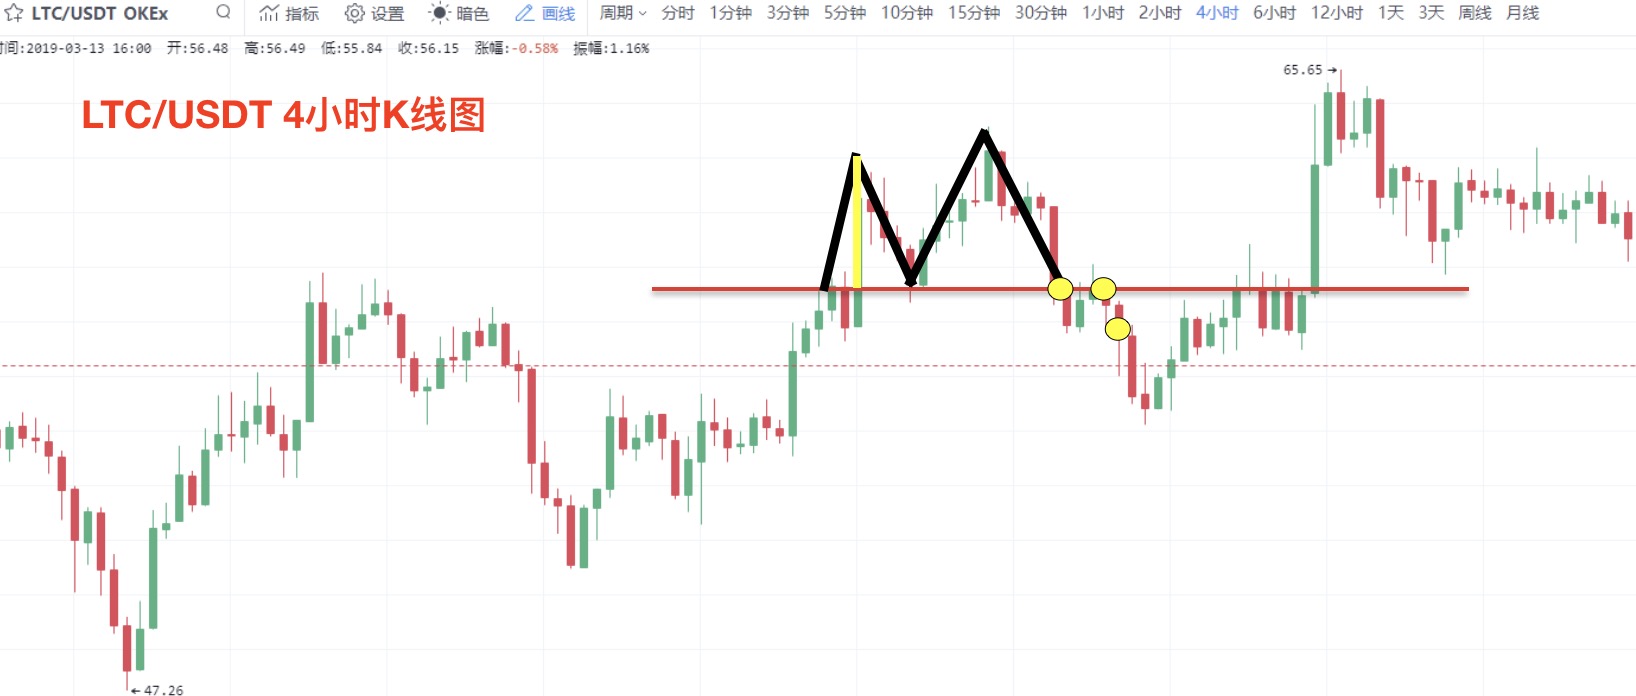
The final case screenshot is from OKX Litecoin/USDT 4-hour candlestick chart. This M head formed over a relatively short period, and the validity after the breakdown was correspondingly shorter. The final decline depth just touched the limit of the predictable range.
We should all be clear that risk and returns share the same origin and coexist. Therefore, always stay vigilant for risk signals and be prepared to escape.
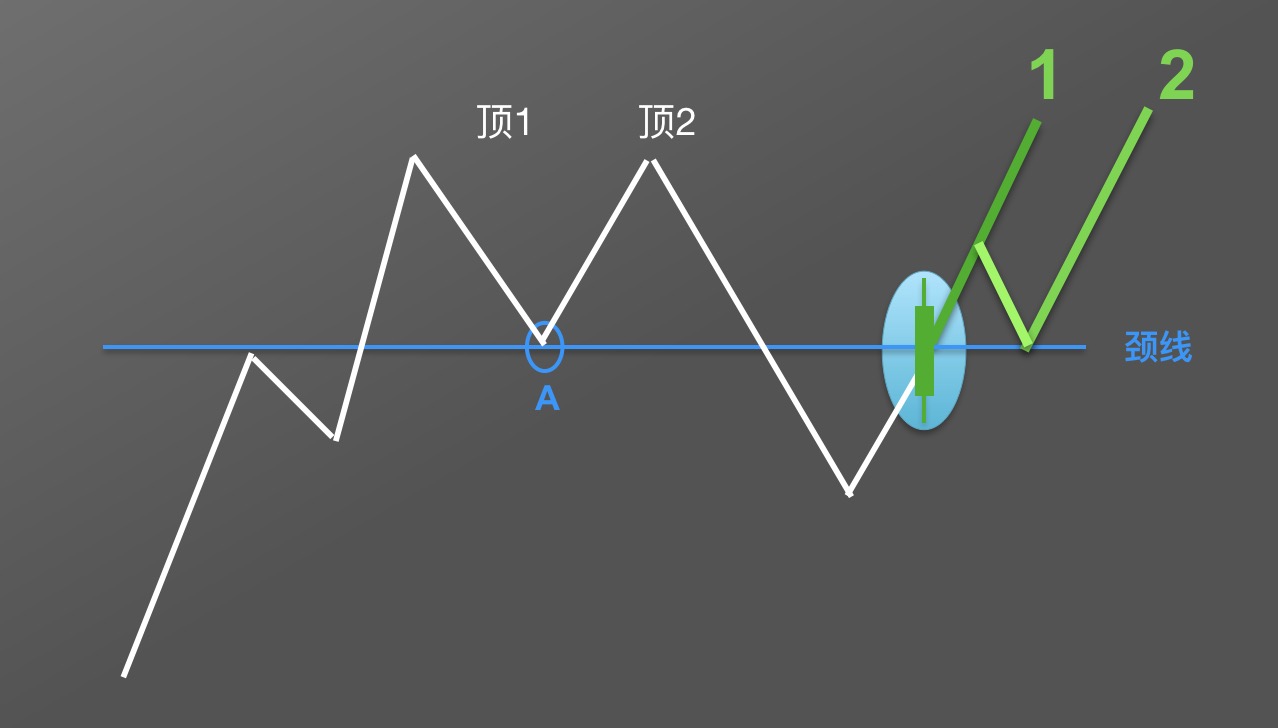
When an M head has formed, if the price retraces to test the neckline support and forms a bullish candlestick as shown, with the body breaking above the neckline, this is a clear risk warning signal. The afterward will most likely form the upward movements shown in Diagrams 1 and 2. Let's look at a real case.
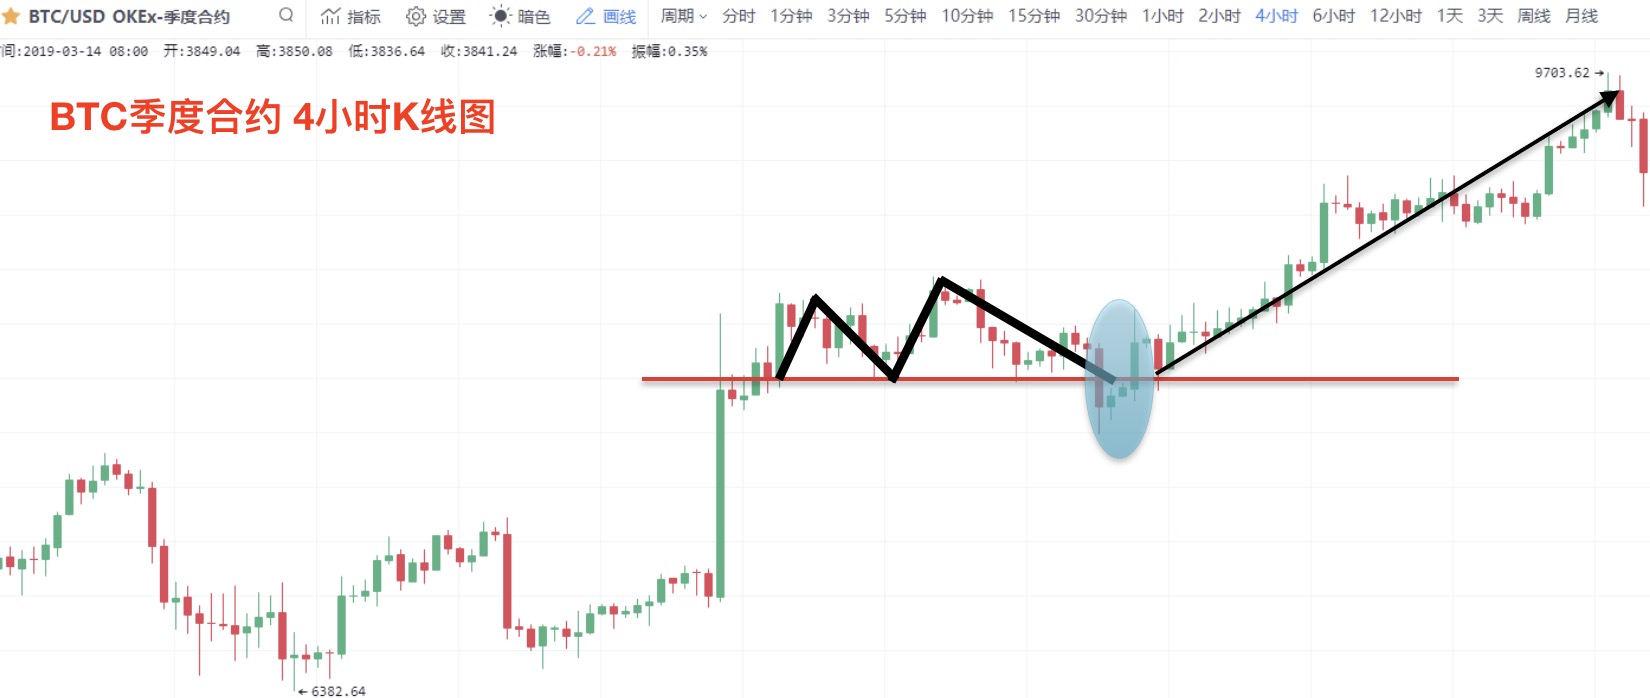
Screenshot from OKX Bitcoin Quarterly Contract 4-hour chart. After a strong rally, a small M head formed. Notably, after the price broke below the neckline, it failed to sustain the decline, and soon the price rose back above the neckline, breaking out of the M head pattern. The blue-shaded area shows the risk signal, and the afterward continued to rise as expected.
Disclaimer
This article may contain product-related content not applicable to your region. This article is dedicated to providing general information only and accepts no responsibility for any factual errors or omissions. This article represents the author's personal views only and does not constitute the views of OKX. This article is not intended to provide any advice, including but not limited to: (i) investment advice or investment recommendations; (ii) offers or solicitations to buy, sell, or hold digital assets; or (iii) financial, accounting, legal, or tax advice. Holdings in digital assets (including stablecoins) carry a high level of risk and may be subject to significant volatility, potentially becoming worthless. You should carefully consider whether trading or holding digital assets is suitable for you based on your financial situation. For questions specific to your circumstances, please consult your legal/tax/investment professional. The information contained in this article (including market data and statistics, where applicable) is for general reference purposes only. Although we have taken all reasonable precautions in preparing such data and charts, we accept no responsibility for any factual errors or omissions expressed herein. © 2025 OKX. This article may be reproduced or distributed in its entirety, or excerpted in passages of 100 words or less, provided that such use is for non-commercial purposes. Any reproduction or distribution of the full article must prominently state: "This article is copyrighted © 2025 OKX, used with permission." Permitted excerpts must cite the article title and include attribution, e.g., "Article title, [Author name (if applicable)], © 2025 OKX." Some content may have been generated or assisted by artificial intelligence (AI) tools. Derivative works and other uses of this article are not permitted.
Show More
Recommended Reading

Can You Profit When Bitcoin Falls? How to Trade Contracts
As the cryptocurrency market represented by Bitcoin continues to expand, various forms of derivatives trading have gradually emerged alongside spot trading as a hedging tool, among which contract trading has garnered the most attention. What is contract trading? Contracts are the most common form of trading instrument in the cryptocurrency derivatives market. Digital assets contract trading refers to buyers and sellers agreeing to trade a certain asset at a specified price at a future time.
January 16, 2026

Simpler Than Copying Strategies? One-Click to Copy the Top Traders on OKX — Let Them Make Money for You
Whether in traditional finance or the cryptocurrency market, copy trading is a very important and key method in the trading system. When facing complex trading environments and extreme market conditions, even with solid theoretical knowledge and rich trading experience, it is easy to miss trading opportunities or make wrong judgments and decisions influenced by emotions. Copy trading is precisely an effective tool to solve these problems. With the trading tools ready, how do you use
November 21, 2025

5. Strategic Trading Series — DCA Bot
Preface: We often wonder: In a bull market, there are many digital assets that surge significantly. If we could continuously capture coins with large gains — for example, catching one that doubles every month — your assets would grow to 2 to the 12th power, or 4,096 times, over a year. That's quite astonishing, but of course it's nearly impossible to achieve because it's very difficult to continuously catch surging coins. This is a common problem many users face: in a bull market, although
November 3, 2025

Which Countries/Regions Do Not Support Registration for OKX
OKX currently does not support providing services to customers in the following regions: certain US territories such as New York, Texas, Puerto Rico, American Samoa, Guam, the Northern Mariana Islands, the US Virgin Islands (St. Croix, St. John, and St. Thomas), Cuba, Iran, North Korea, Crimea, Malaysia, Syria, Bangladesh, and Bolivia. For details, please refer to the OKX Terms of Service.
April 25, 2024

Quick Guide to OKX Products and Features
OKX (www.okx.com) is one of the world's renowned digital assets service platforms, primarily serving global users with Bitcoin, Ethereum, and other digital assets spot and derivatives trading services, while also exploring the worlds of DeFi, dApps, NFTs, and GameFi together with its users. On OKX, you can enjoy seamless spot and contract trading experiences, stay updated on tokens in trending sectors/concepts in real time, and much more.
April 25, 2024

Zero-Basics of Candlestick Charts | 5 The Importance of Candlestick Pattern Combinations
Uptrends and downtrends reveal price action; buy and sell signals take the guesswork out of trading. 1. Bullish Candlestick Combinations at Key Levels In the previous two chapters of this section, we covered bullish and bearish candlestick combinations. However, these combinations are not effective in every position. In this lesson, we will explain the importance of where these combinations appear. Where do bullish combinations work best? First scenario: toward the end of a clear uptrend, approaching a prev
April 25, 2024


