
Zero Basics of K-Line | 14 Top Escape Pattern — Rounding Top
MANA+4. 48%
Price movements follow trends; understand the language of price;
Trading signals indicate entry and exit; no more trading on gut feeling.Trading.
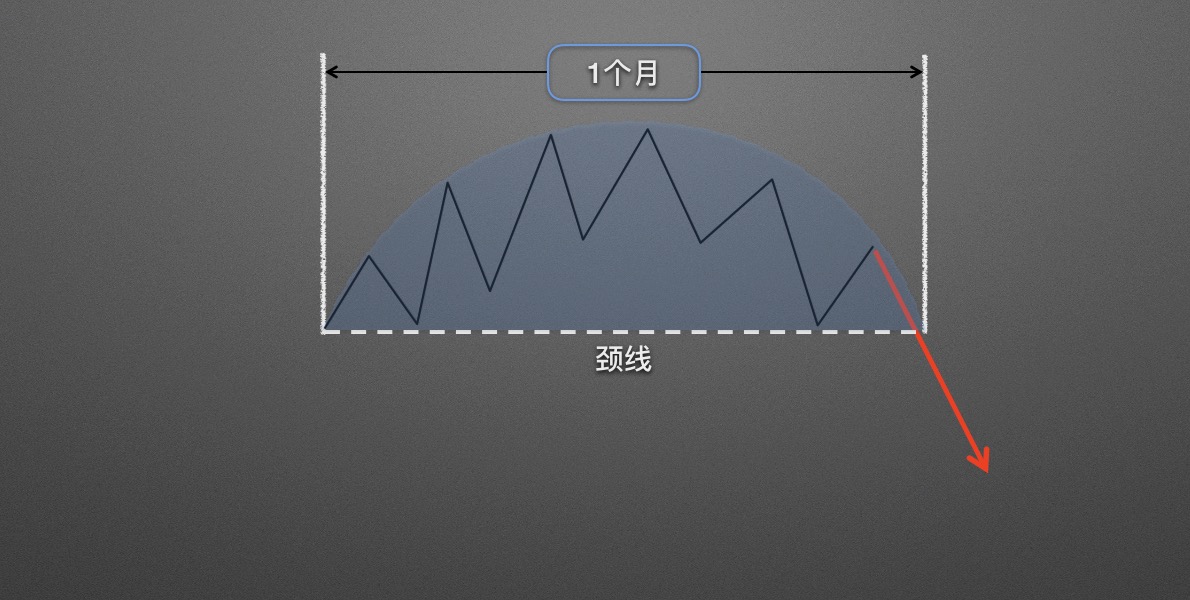
In this lesson, we will introduce a top pattern that is the opposite of the rounding bottom — the rounding top. Let's first look at what a rounding top looks like.
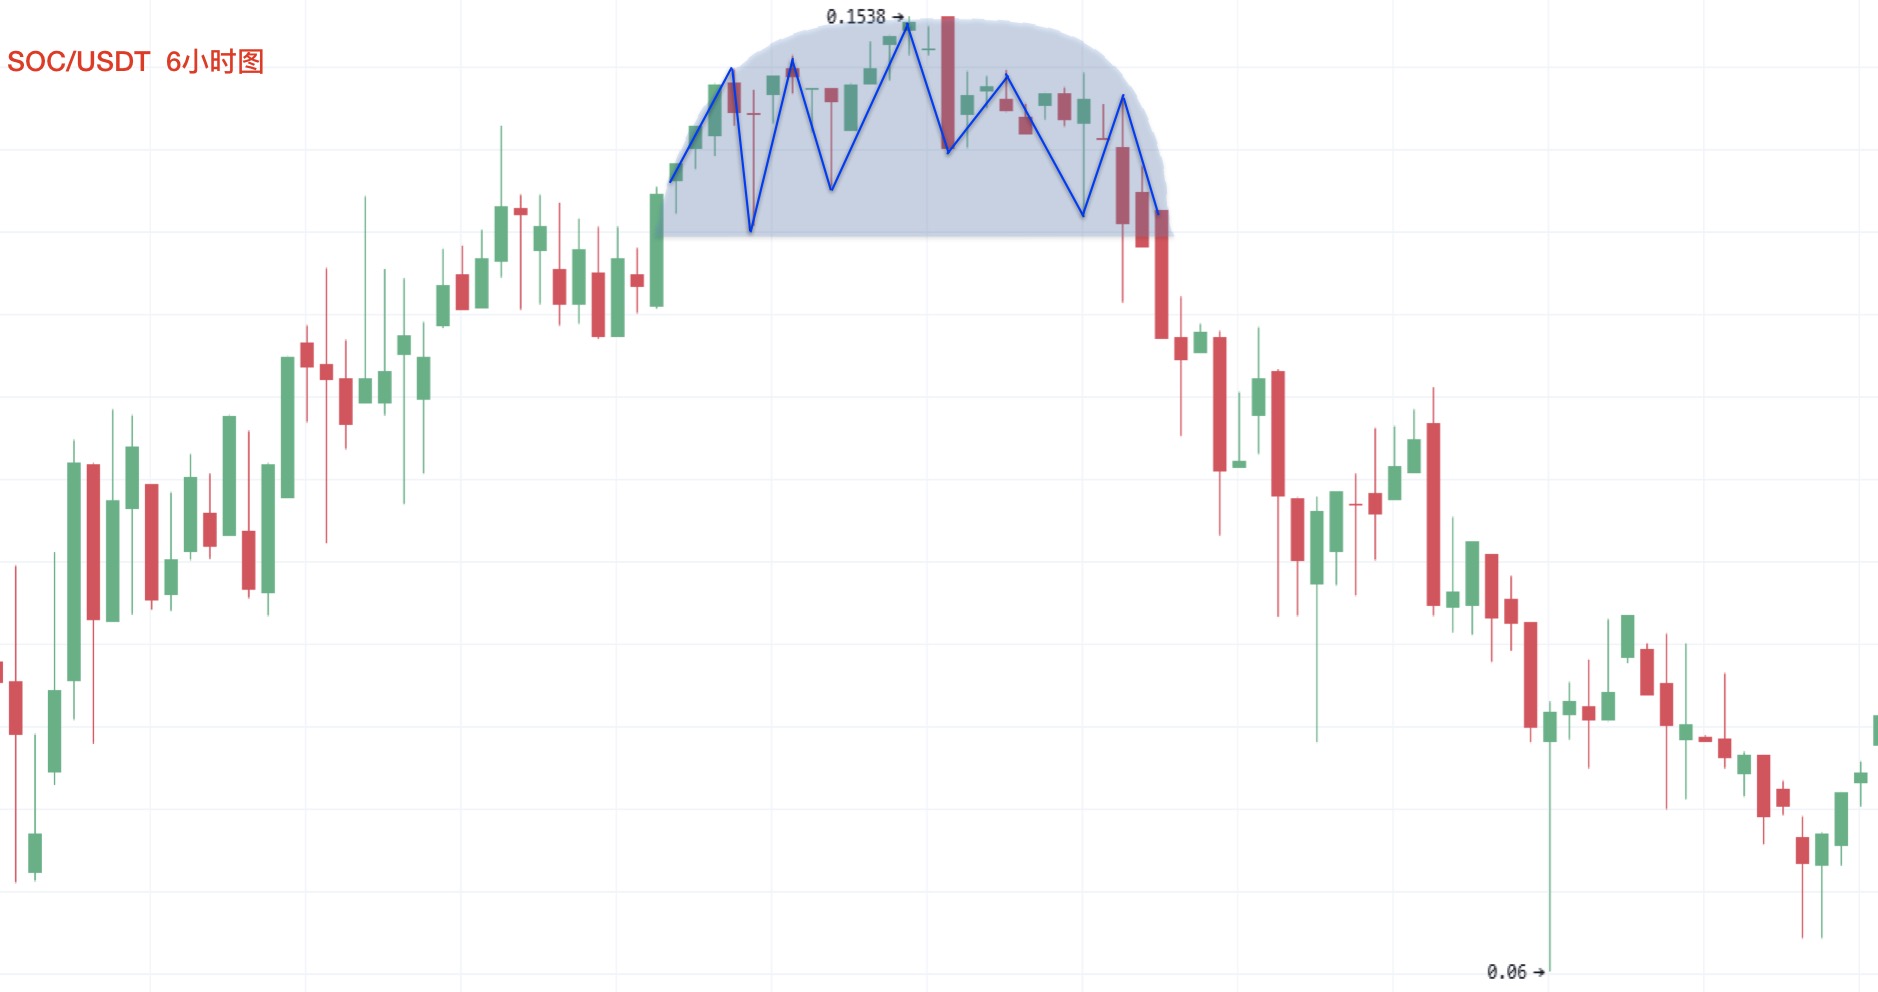
As shown in the chart, during an overall upward trend, the rising momentum clearly slows down, and connecting the highs forms roughly a semicircle. This pattern is called a rounding top.
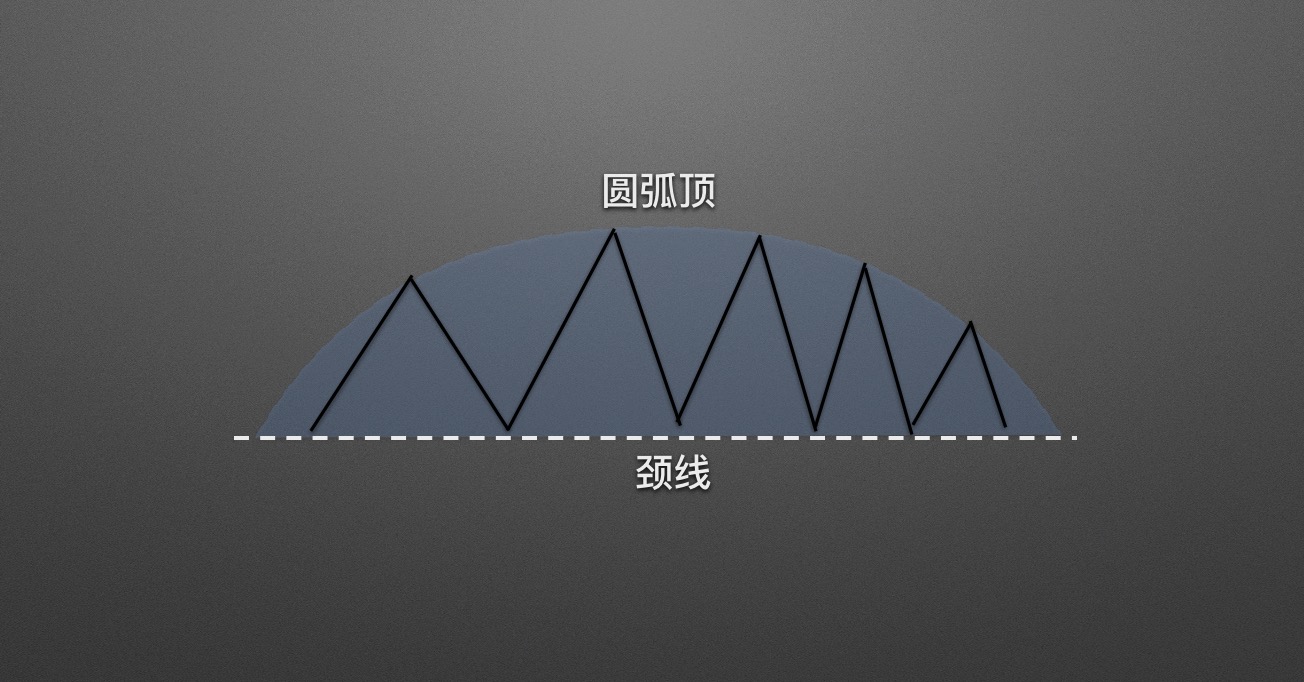
Let's simplify this pattern. Draw a horizontal line that passes through the most lows — this is called the neckline. The neckline appears in multiple patterns and is a very important reference line.
Not every upward-curving arc pattern is a rounding top. How do we confirm whether a rounding top is valid?
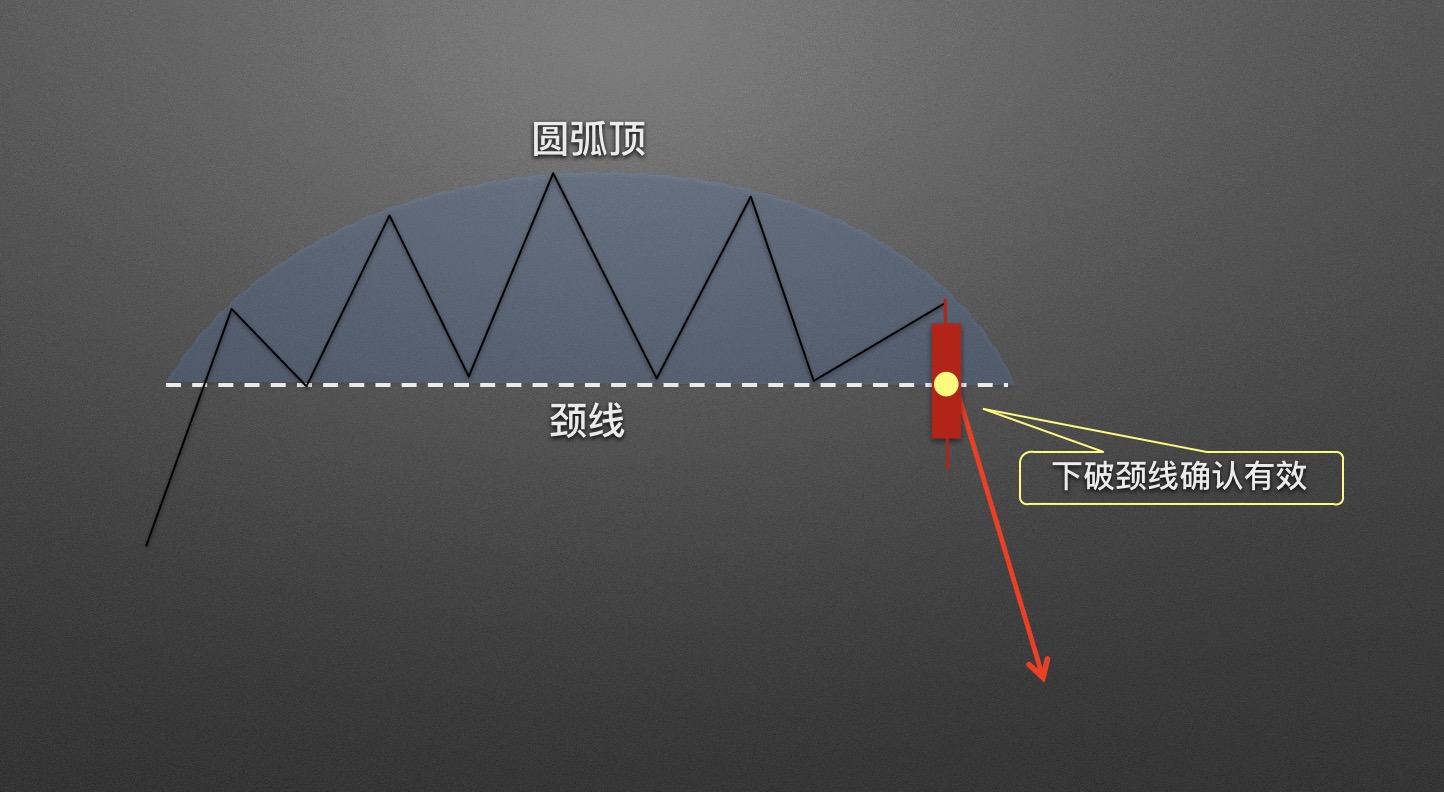
As shown: when a candlestick closes and its body crosses below the neckline, the rounding top pattern can be considered valid.
Depending on where the rounding top appears, we classify it into two categories.
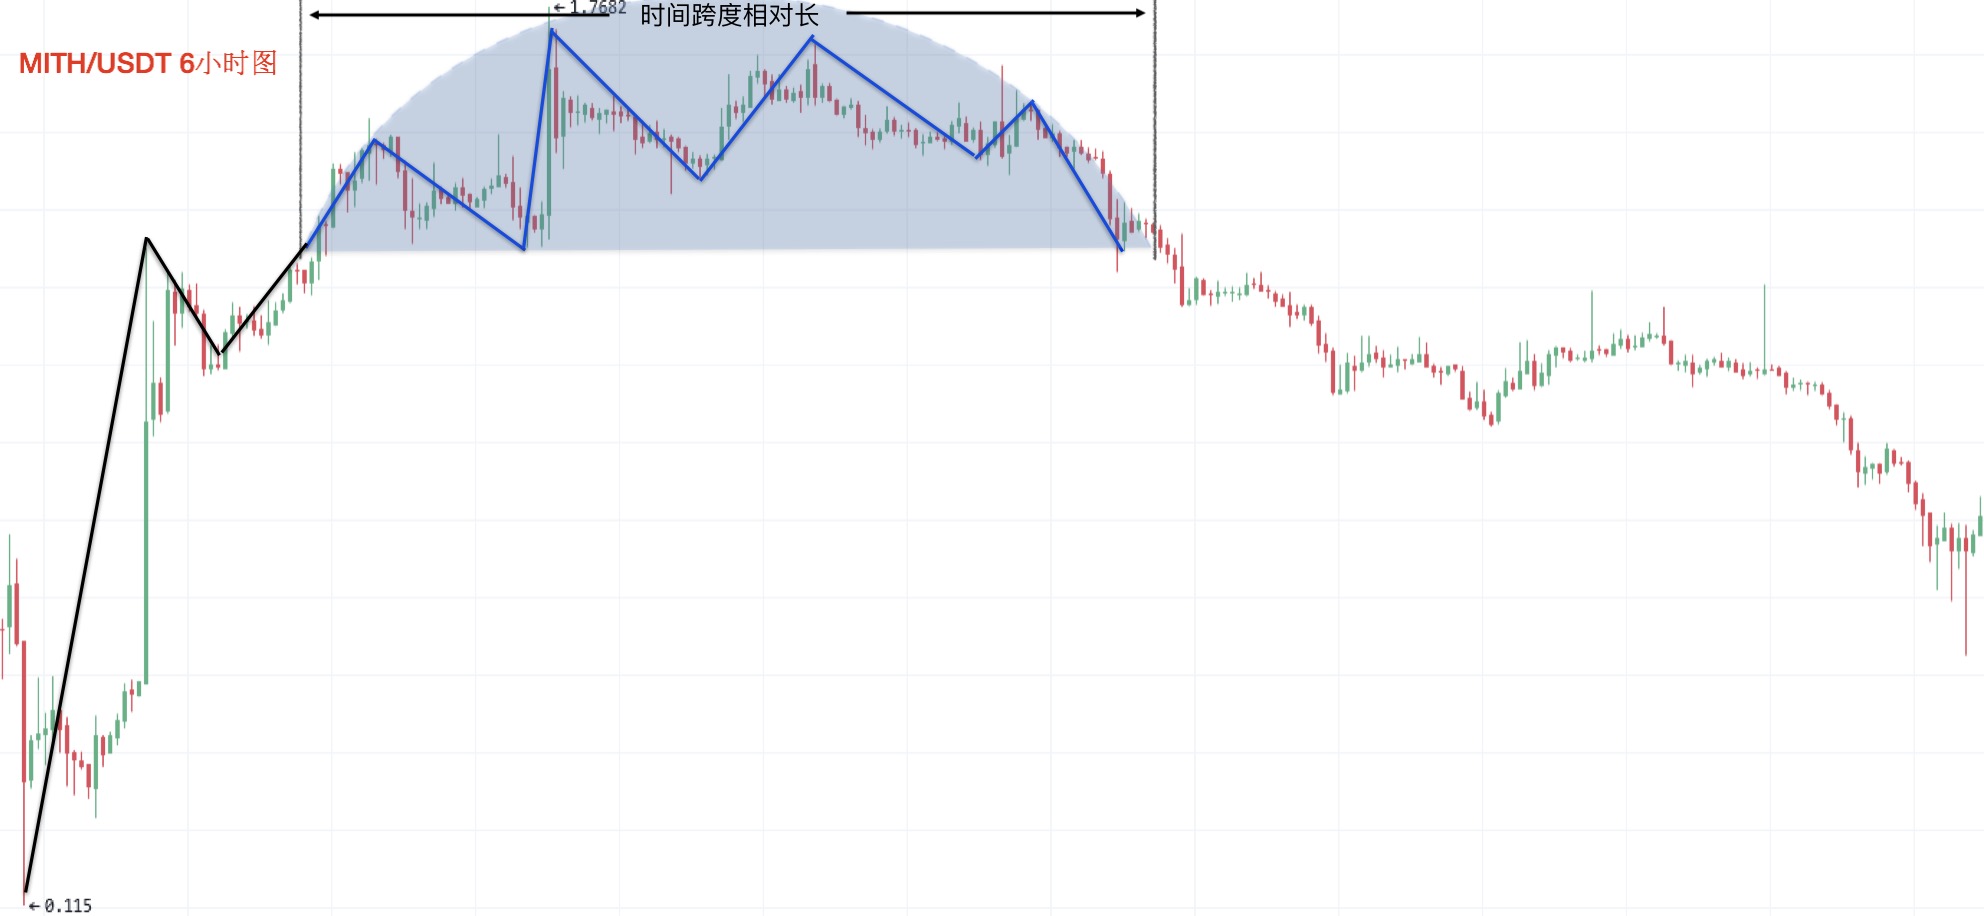
1) A rounding top in the early stages of an uptrend, where the pattern takes a relatively longer time to form.
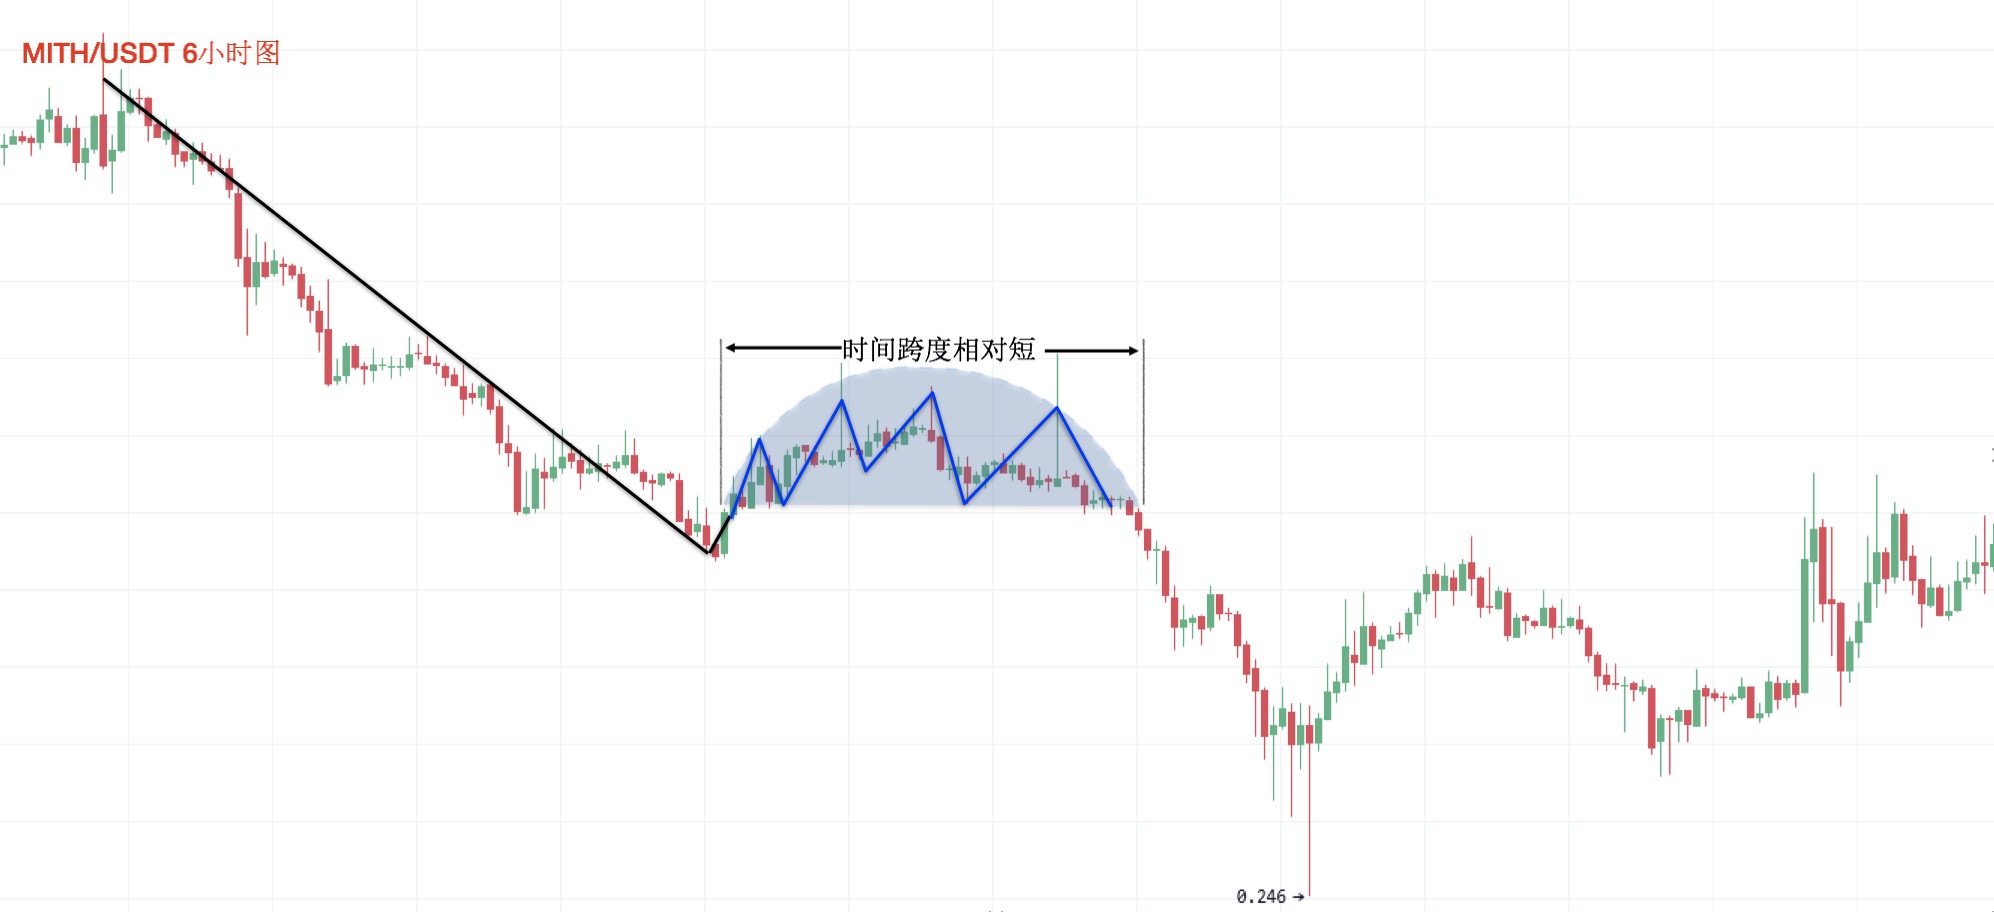
2) A rounding top during a downtrend, where the pattern lasts a noticeably shorter time.
Now that we have a basic understanding of the rounding top pattern, how do we apply it in live trading?
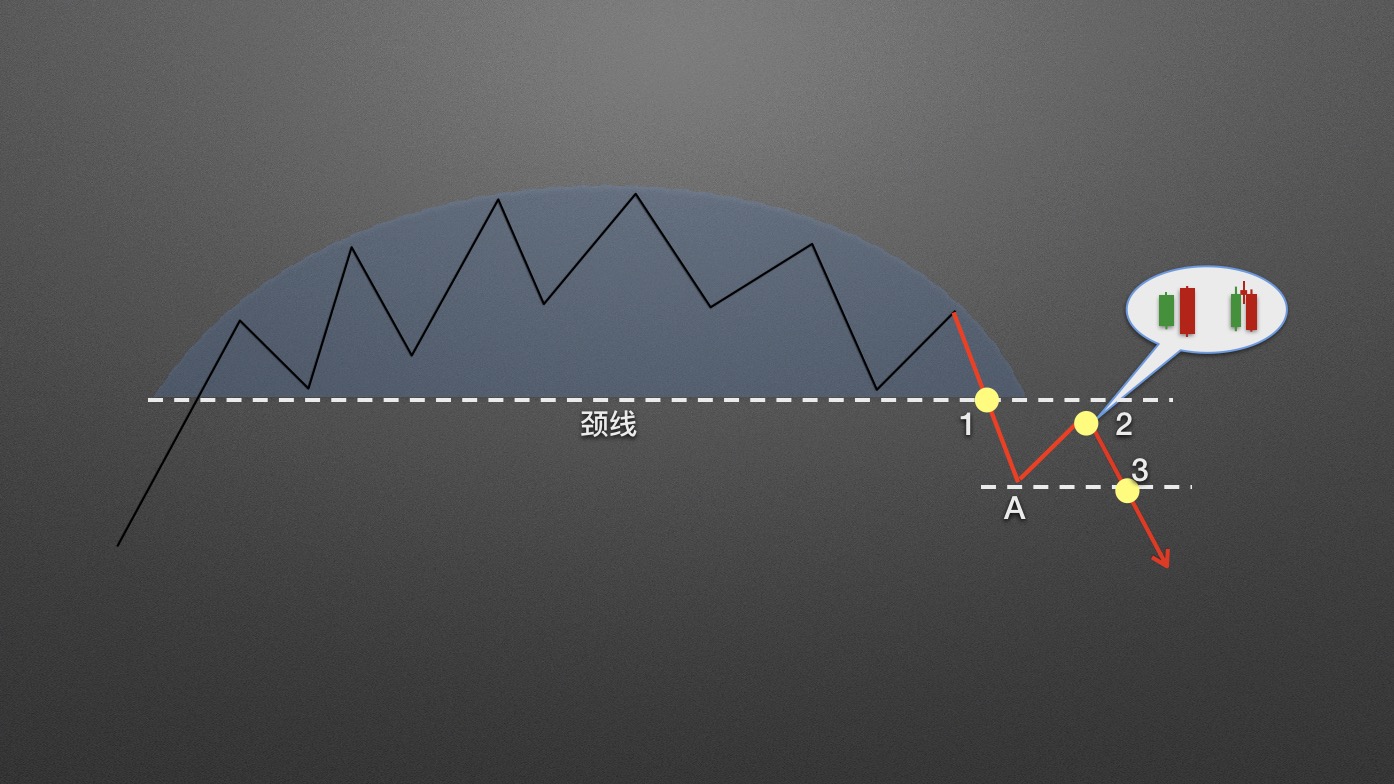
When the price breaks below the neckline, the first type of selling signal is generated. This type of signal is relatively aggressive and has a lower success rate.
When the price falls below the neckline and then pulls back, followed by a bearish engulfing pattern, evening star, or other bearish signals, the second type of selling signal is generated. This is a more conservative selling signal with a significantly higher success rate.
When the price continues downward and breaks below point A, the third type of selling signal is generated. In most cases, entering after the third selling signal appears is the safest approach.
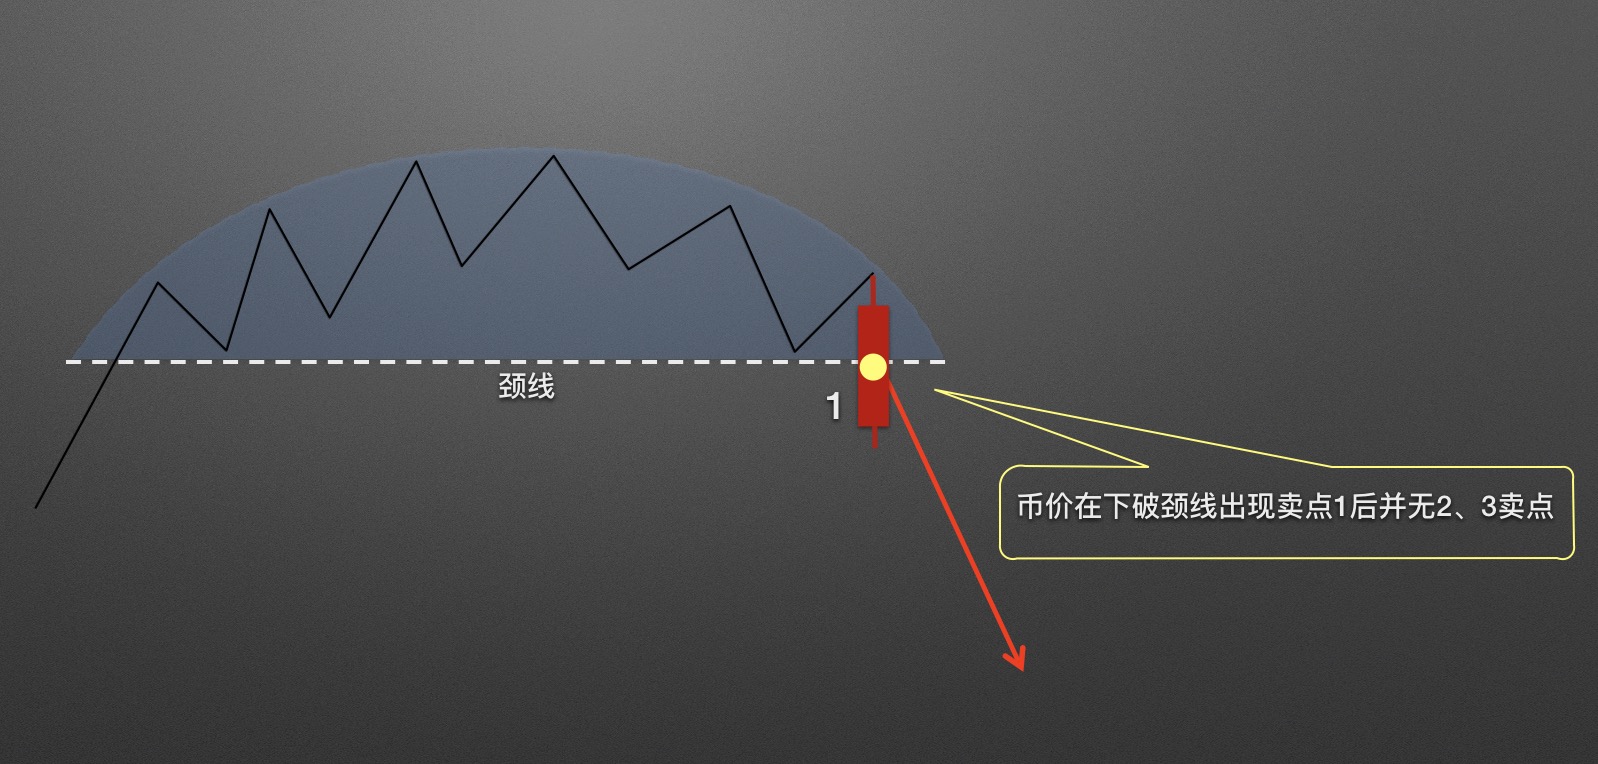
Not every rounding top forms all three selling signals. In extremely weak market conditions, it is very likely that only one selling signal appears. In this case, the price typically breaks below the neckline with a strong bearish candle, and then continues to decline.
The decline has been confirmed — how do we predict the depth of the drop?
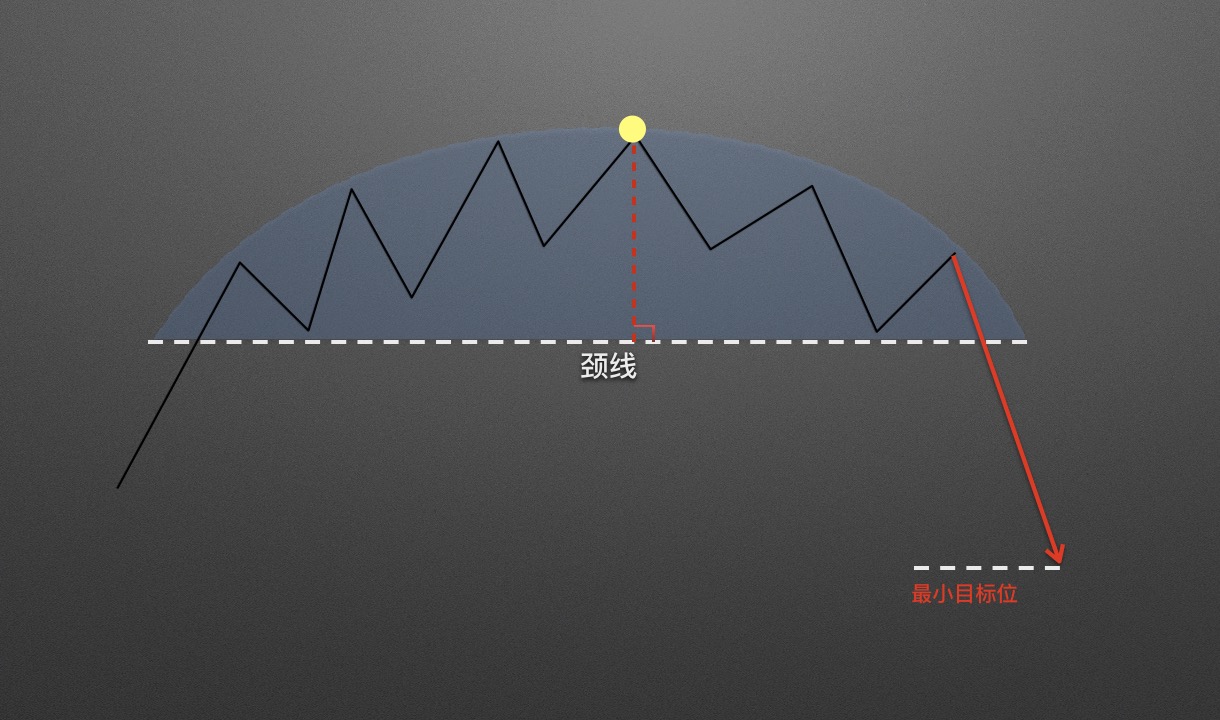
The method for estimating the minimum target of a rounding top is simple. From the high point of the arc, draw a vertical line down to the neckline. Shift this line segment below the neckline to get the minimum target level.
We can also roughly predict the extent of future price decline based on the formation period of the rounding top.
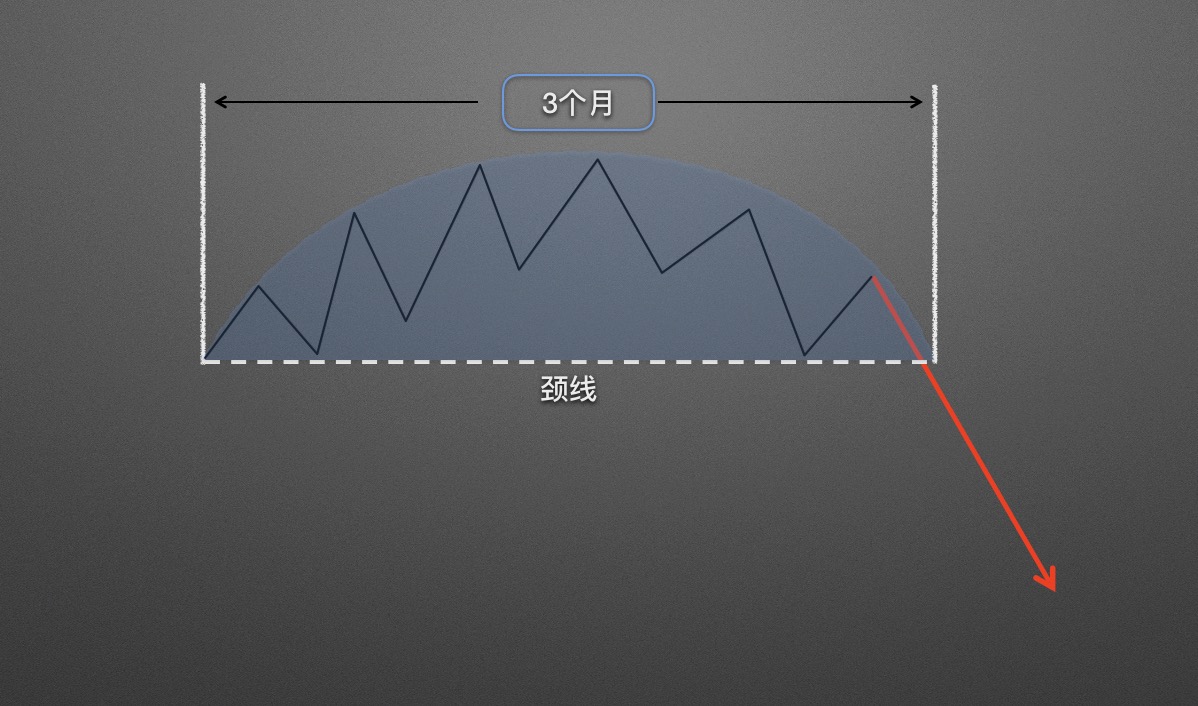
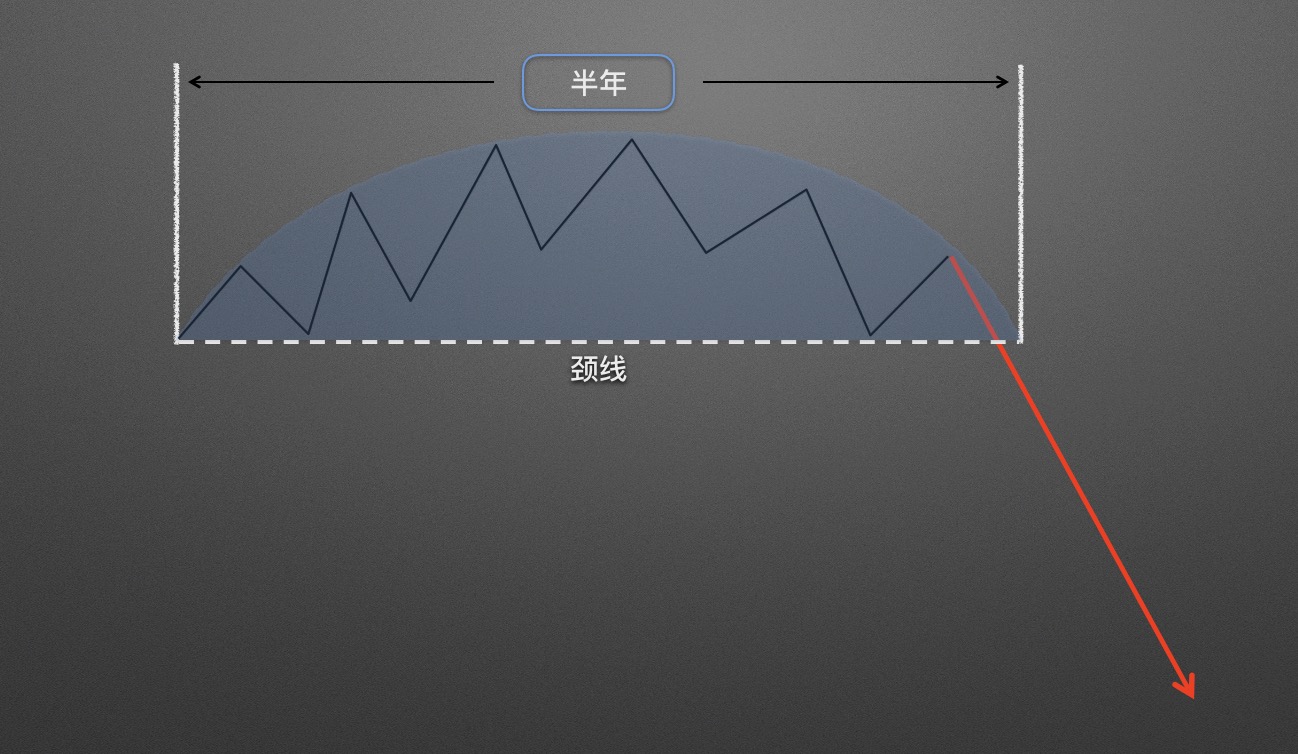
In most cases, the longer the rounding top takes to form, the greater the potential decline afterward.
Let's look at three real-world rounding bottom case studies below.
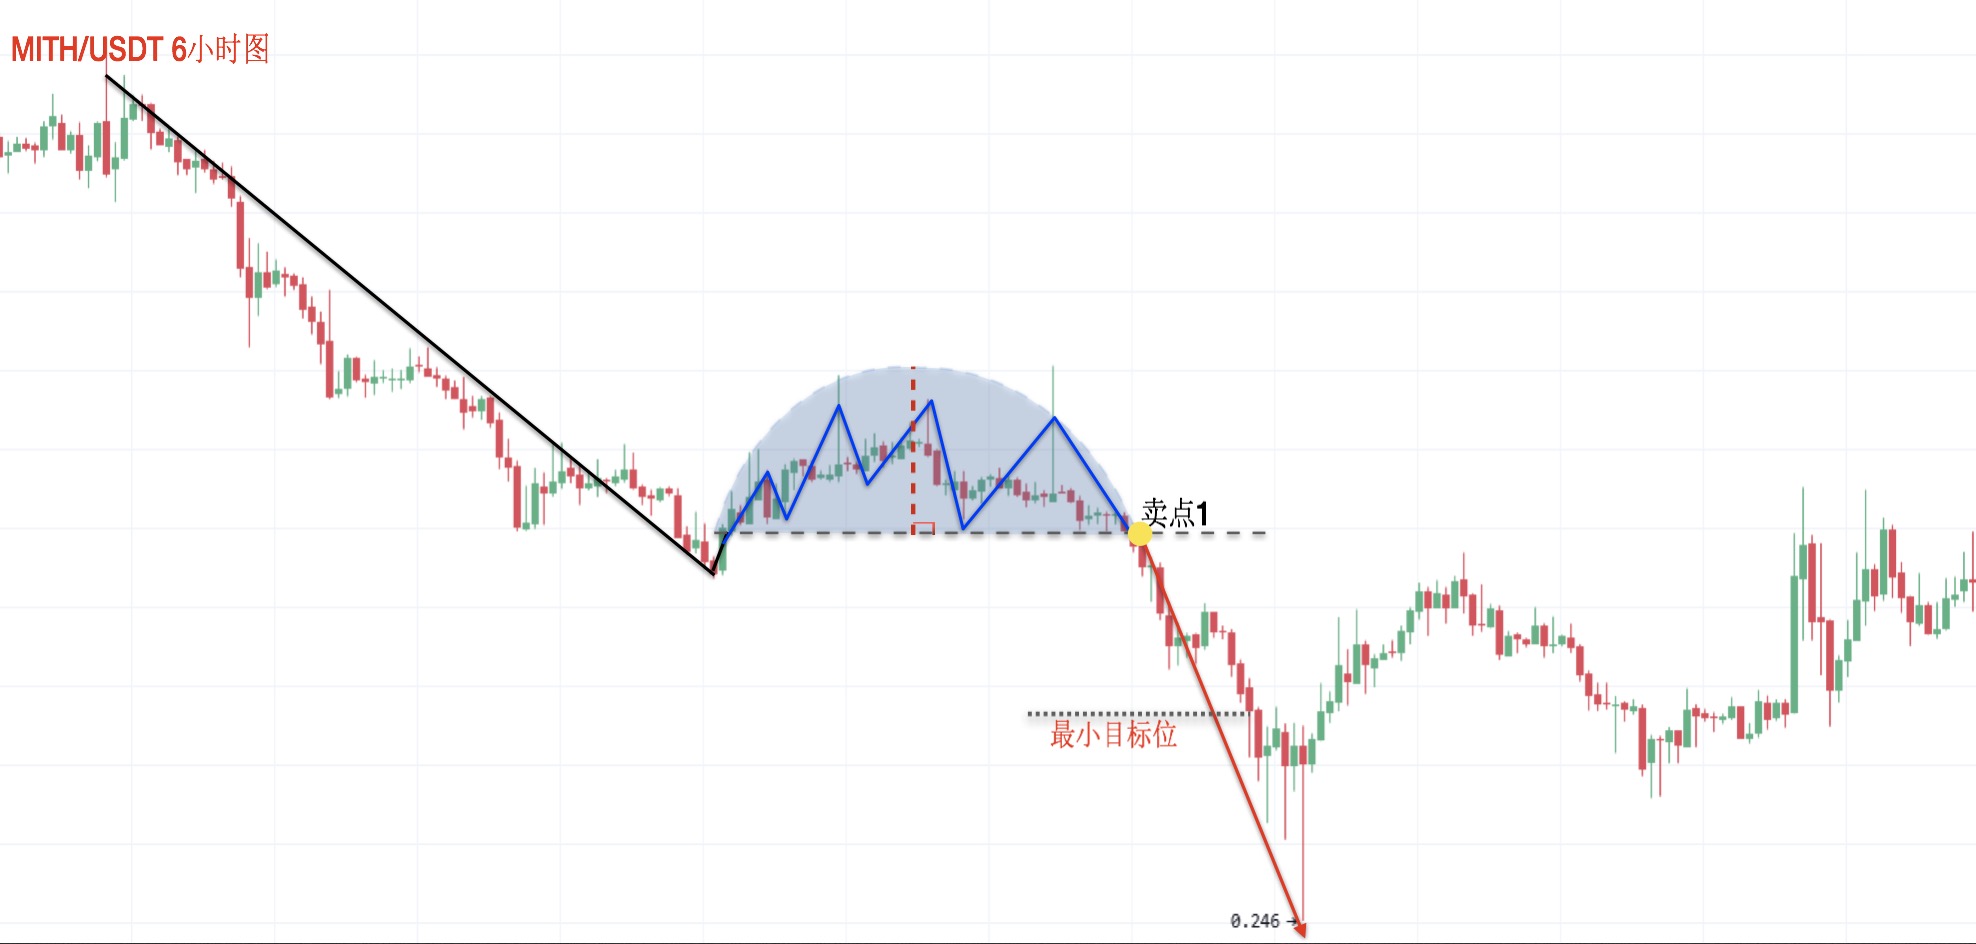
Case 1: Screenshot from OKX MITH/USDT 6-hour chart. After a downtrend, the price formed a rounding top with a relatively short time span. In this pattern, only one selling signal appeared, followed by a sharp decline where the price quickly fell below the minimum target level.
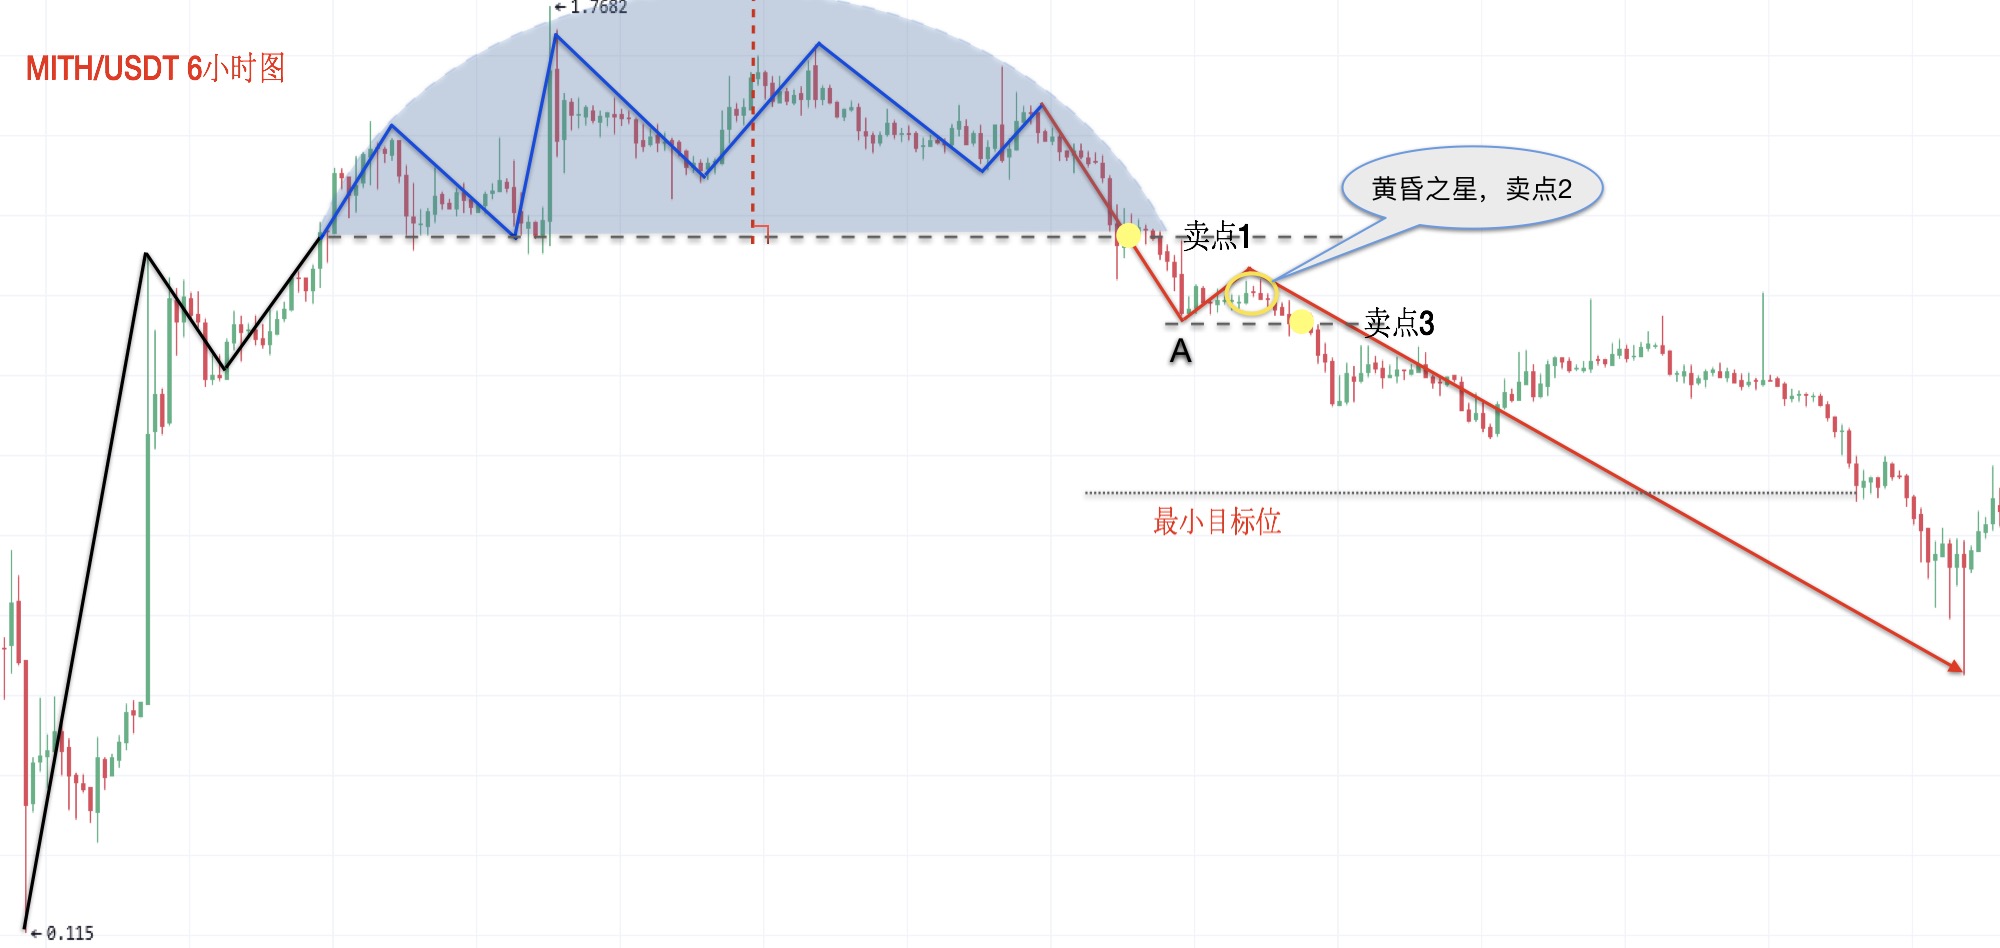
Case 2: Screenshot from OKX MITH/USDT 6-hour chart. After a sharp rally, the price formed a rounding top with three well-defined selling signals. The price then continued to decline, surpassing the minimum target level.
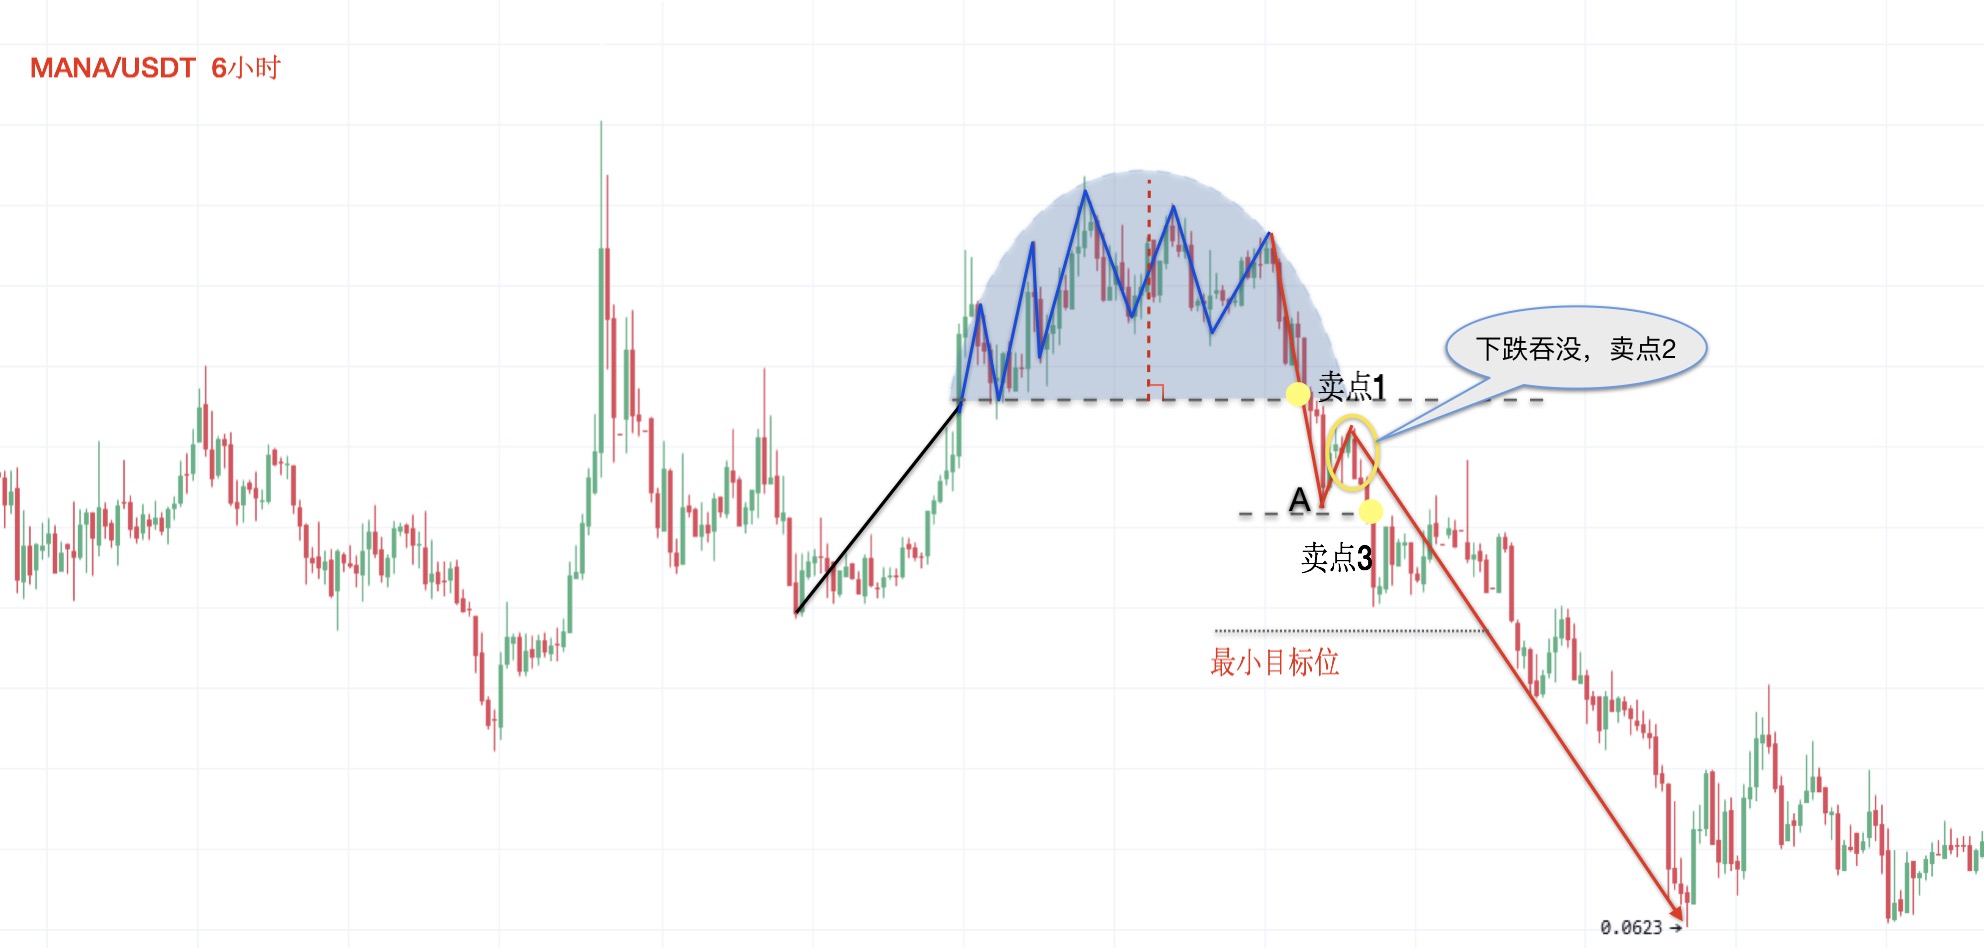
Case 3: Screenshot from OKXMANA/USDT 6-hour chart. After a modest rally, the price formed a rounding top, with all three selling signals appearing in sequence, and the final decline exceeded the minimum target level.
Just as a rounding bottom does not always succeed, rounding tops can also fail. What conditions indicate that a rounding top has failed?
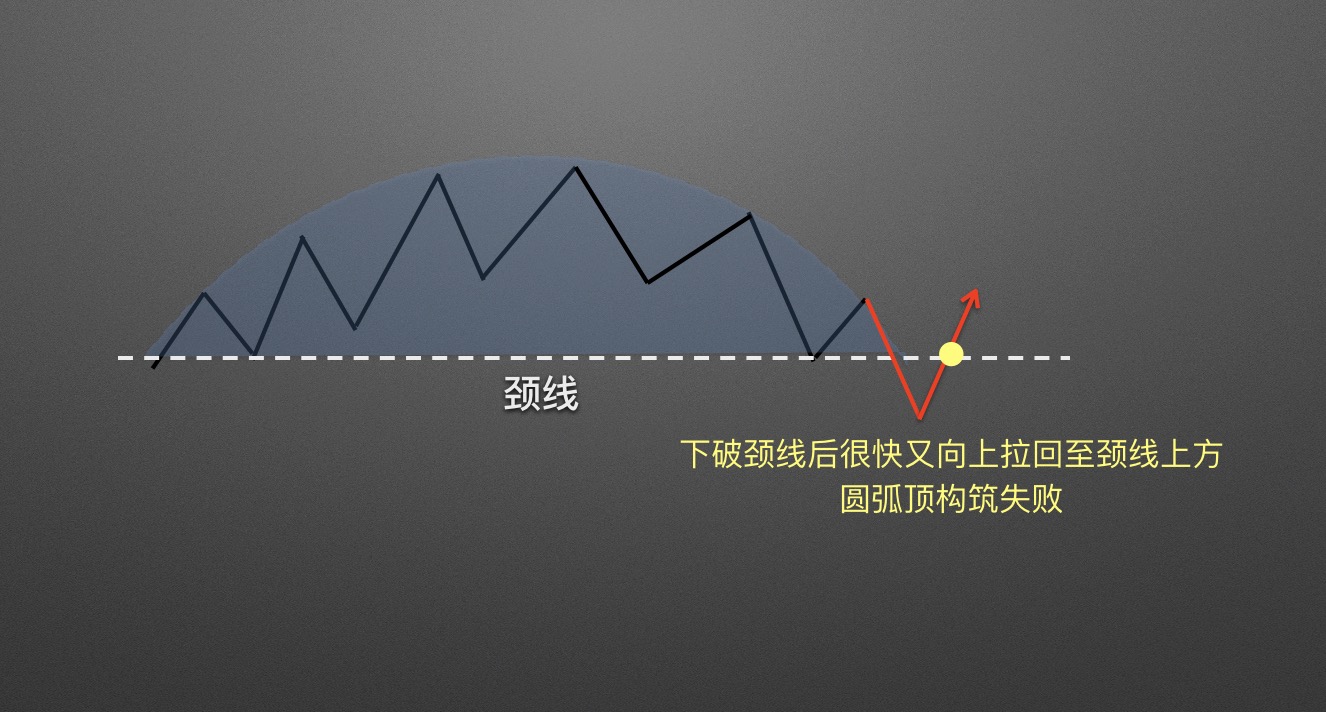
First scenario: shortly after breaking below the neckline, the price rises back above the neckline. The neckline breakout fails, and the rounding top construction is invalidated. In this case, any positions sold should be bought back.
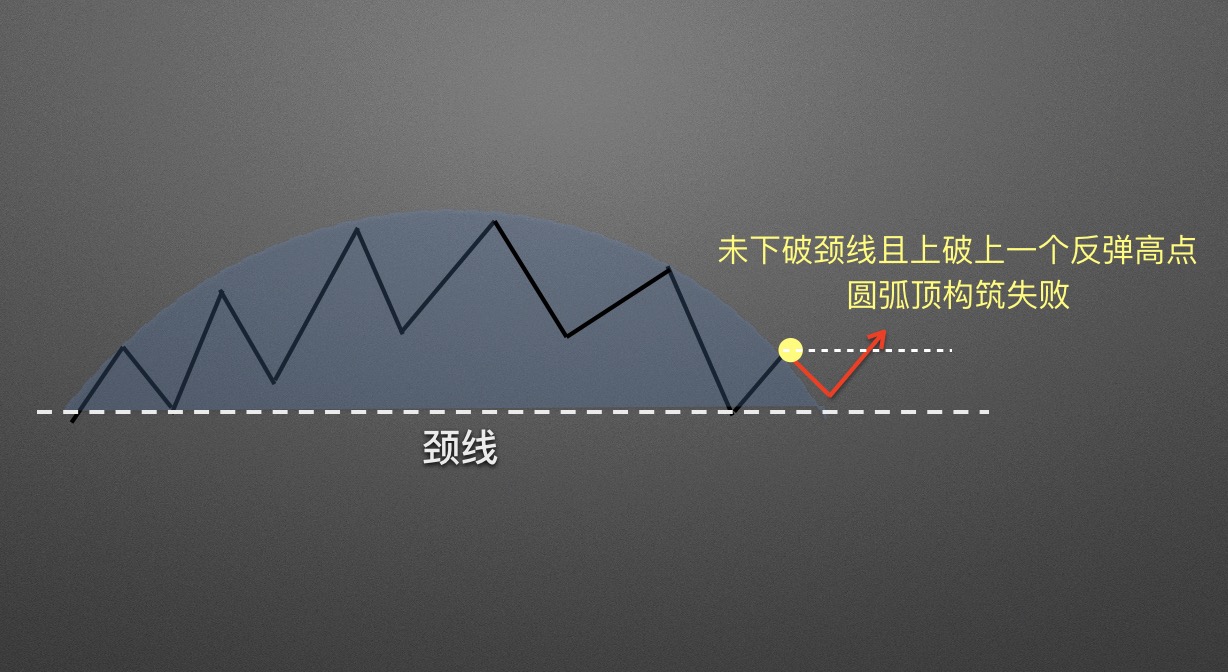
Second scenario: after the rounding top pattern forms, the price does not break below the neckline and instead rallies above the nearby swing high. In this case, the rounding top construction fails.
Rounding Top Failure Case Studies:
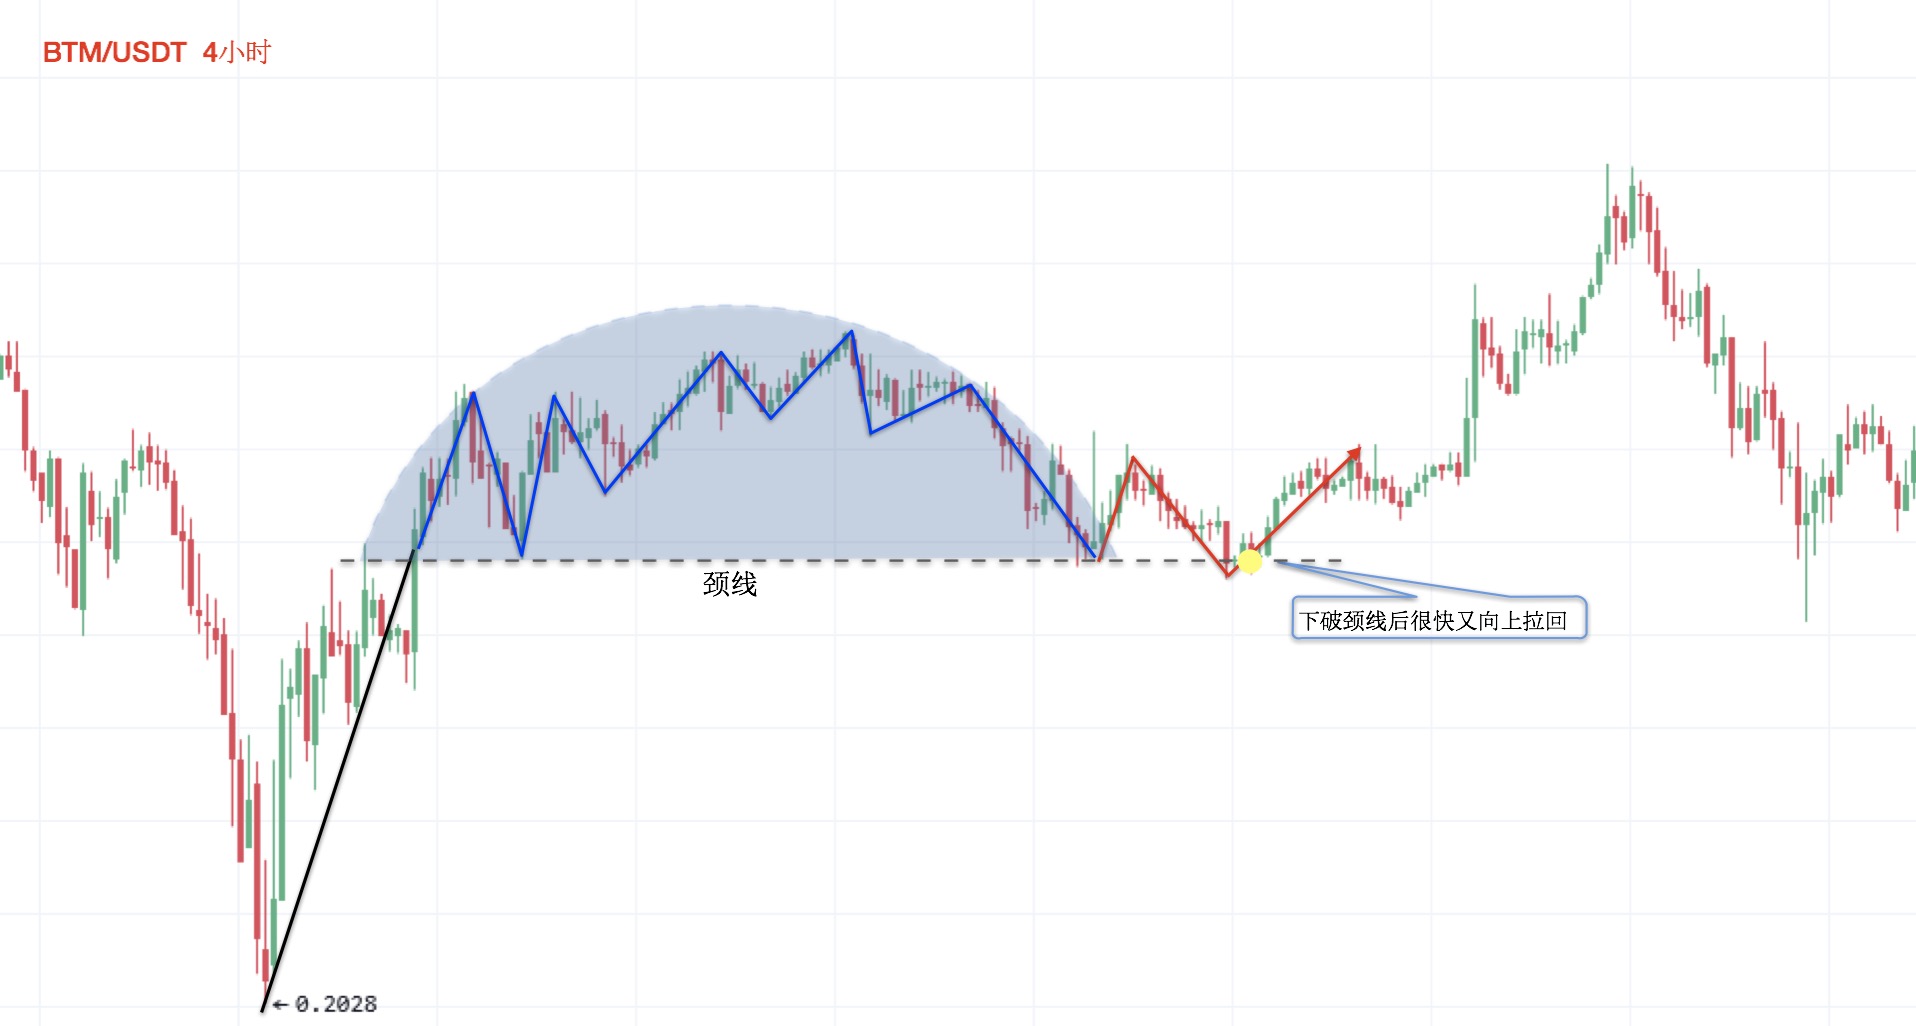
Chart 1: The price fails to break below the neckline, the rounding top pattern is invalidated, and the price forms an uptrend.
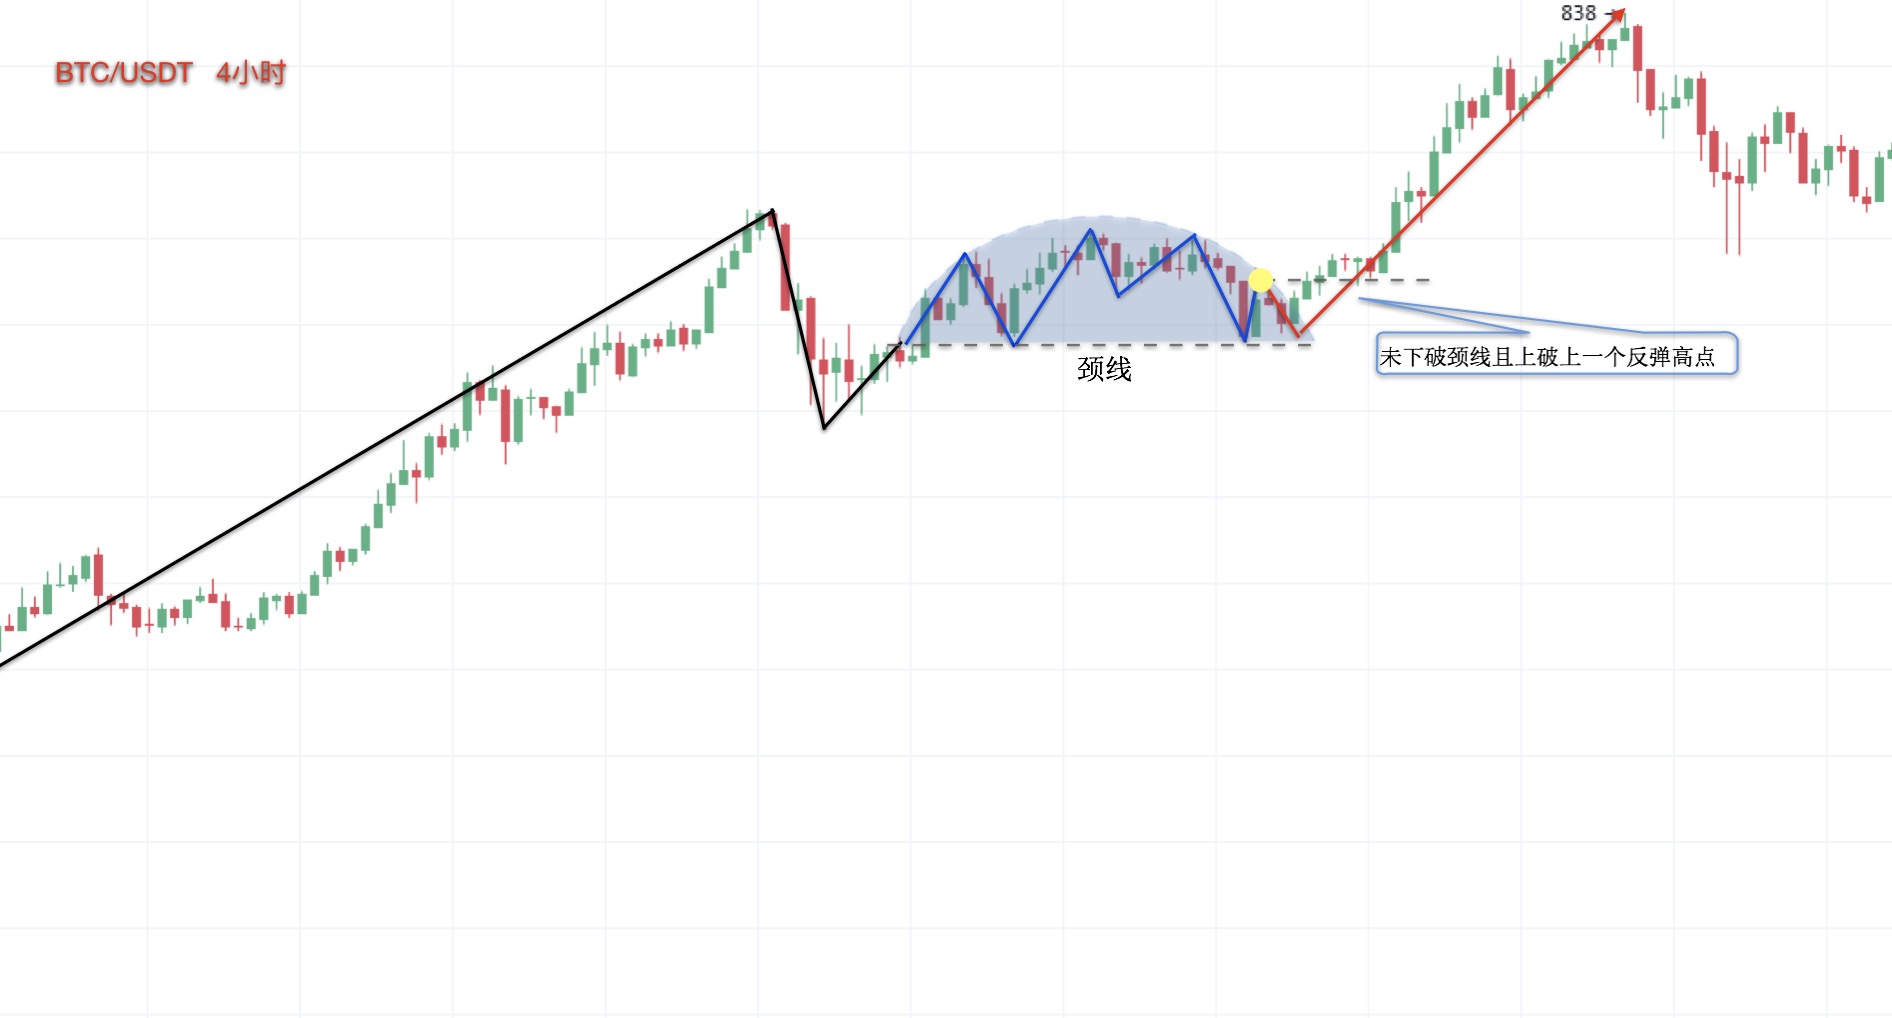
Chart 2: The price forms a rounded shape but fails to break below the neckline for a long time, and eventually rallies above the nearby swing high, invalidating the rounding top.
This concludes our discussion of top escape patterns. In the next lesson, we will cover "Smart Money Accumulation Patterns."
Disclaimer
This article may contain product-related content not applicable to your region. This article is intended to provide general information only and does not accept responsibility for any factual errors or omissions. This article represents the author's personal views only and does not constitute the views of OKX. This article is not intended to provide any advice, including but not limited to: (i) investment advice or investment recommendations; (ii) offers or solicitations to buy, sell, or hold digital assets; or (iii) financial, accounting, legal, or tax advice. Holdings in digital assets (including stablecoins) involve a high level of risk, may be subject to significant price fluctuations, and may even become worthless. You should carefully consider whether trading or holding digital assets is suitable for you based on your financial situation. For questions specific to your circumstances, please consult your legal/tax/investment professional. Any information contained in this article (including market data and statistics, if applicable) is provided for general reference only. While all reasonable precautions have been taken in the preparation of such data and charts, we assume no responsibility for any factual errors or omissions expressed herein. © 2025 OKX. This article may be reproduced or distributed in its entirety, or excerpts of 100 words or less may be used, provided that such use is non-commercial in nature. Any reproduction or distribution of the full article must prominently state: "This article is copyrighted © 2025 OKX, used with permission." Permitted excerpts must cite the article name and include attribution, for example: "Article name, [author name if applicable], © 2025 OKX." Some content may be generated or assisted by artificial intelligence (AI) tools. Derivative works and other uses of this article are not permitted.
Show More
Recommended Reading

Profit from Bitcoin Declines? How to Trade Contracts
As the cryptocurrency market represented by Bitcoin continues to expand, diverse derivative trading has gradually emerged as a hedging tool beyond spot trading, with contract trading being one of the most closely watched. What is contract trading? Contracts are the most common form of trading instrument in the cryptocurrency derivatives market. Digital asset contract trading refers to an agreement between a buyer and seller to trade a specific asset at a predetermined price at a future date.
January 16, 2026

Simpler Than Copying Strategies? Follow Top Traders with One Click on OKX — Let Them Help You Make Money
Whether in traditional finance or the cryptocurrency market, strategy trading is a very important and key component of the trading system. When facing complex trading environments and extreme market conditions, even with solid theoretical knowledge and extensive trading experience, it is easy to miss trading opportunities or make poor decisions influenced by emotions. Strategy trading is an effective tool to address these issues. With trading tools in place, how do you use
November 21, 2025

5. Strategic Trading Series — DCA Bot
Preface: We often wonder: during a bull market there are many digital assets that surge significantly. If we could consistently capture assets with large gains — for example, capturing one digital asset that doubles each month — after a year our assets would grow by 2 to the power of 12, which is 4,096 times. That is quite astonishing, though of course it is nearly impossible to achieve because it is very difficult to consistently catch assets that make big moves. This is a common challenge many users face: during a bull market, although
November 3, 2025

Which Countries/Regions Do Not Support Registration for OKX
OKX currently does not provide services to customers in the following regions: certain U.S. territories such as New York, Texas, Puerto Rico, American Samoa, Guam, the Commonwealth of the Northern Mariana Islands, the U.S. Virgin Islands (St. Croix, St. John, and St. Thomas), Cuba, Iran, North Korea, Crimea, Malaysia, Syria, Bangladesh, and Bolivia. For details, please refer to the OKX Terms of Service.
April 25, 2024

Quick Guide to OKX Products and Features
OKX (www. okx. com) is one of the world's leading digital asset service platforms, primarily serving global users withBitcoin, Ethereum and other digital asset spot and derivatives trading services, while also exploring the world of DeFi, dApps, NFTs, and GameFi together with users. On OKX, you can enjoy seamless spot and derivatives trading experiences, stay updated on tokens in trending sectors/concepts, and more.
April 25, 2024

Zero Basics of K-Line | 5 The Importance of Candlestick Pattern Applications
Price movements follow trends; understand the language of price; trading signals indicate entry and exit; no more trading on gut feeling. 1. Key Levels for Bullish Candlestick Patterns In the previous two chapters of this section, we covered bullish and bearish candlestick combinations. However, these combinations are not effective at every location. In this lesson, we will discuss the importance of where these combinations appear. Where do bullish combinations work best? First scenario: in a clear uptrend, approaching a
April 25, 2024


