Candlestick Charts from Scratch | 15 Smart Money Patterns 1 — Trading Range
Trends drive price action — learn to read the language of charts;
Signals guide your trades — stop trading on instinct.
1. What Is a Trading Range?
Today we're covering the trading range, a continuation pattern in candlestick analysis.
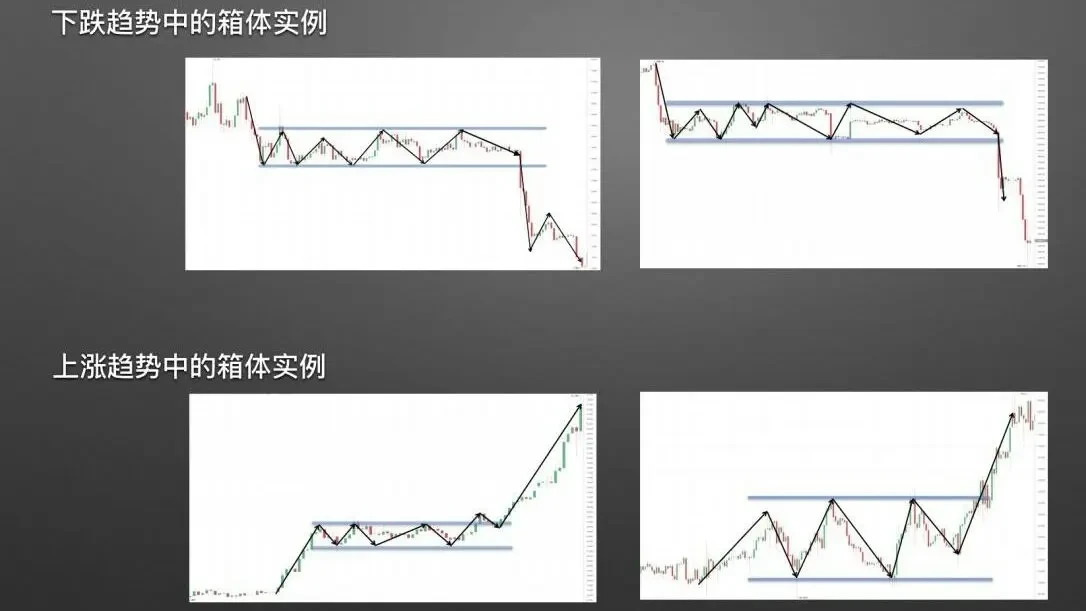
What does a trading range look like? Let's start with a real chart.
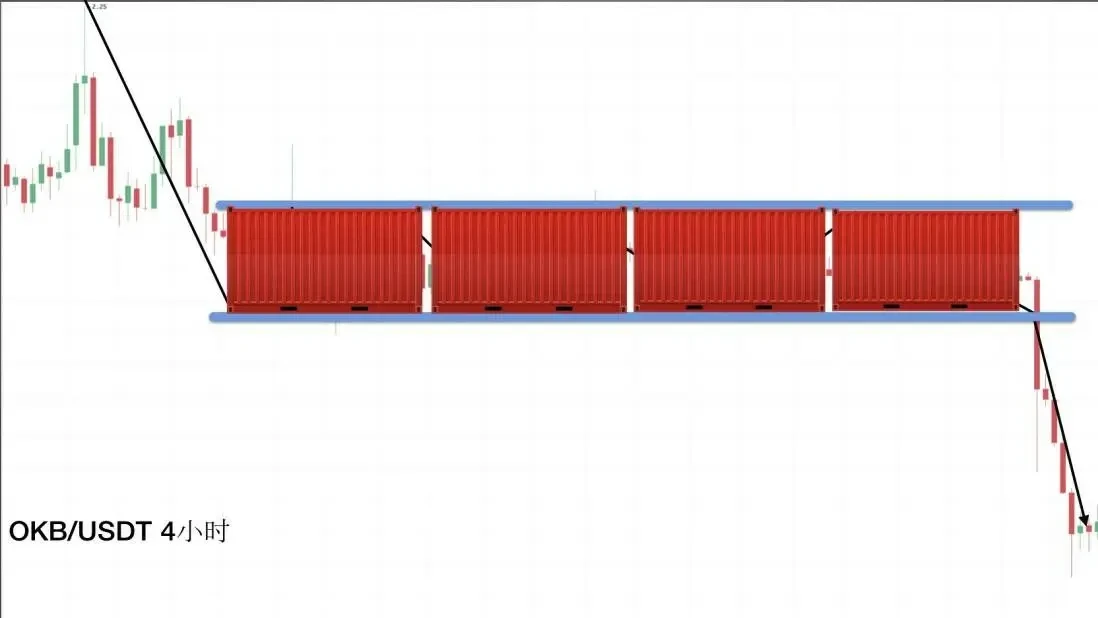
As shown, the blue shaded area represents the trading range structure. It's named for its box-like appearance.
Through technical analysis refinement, we can draw a simplified trading range diagram and break it down step by step.
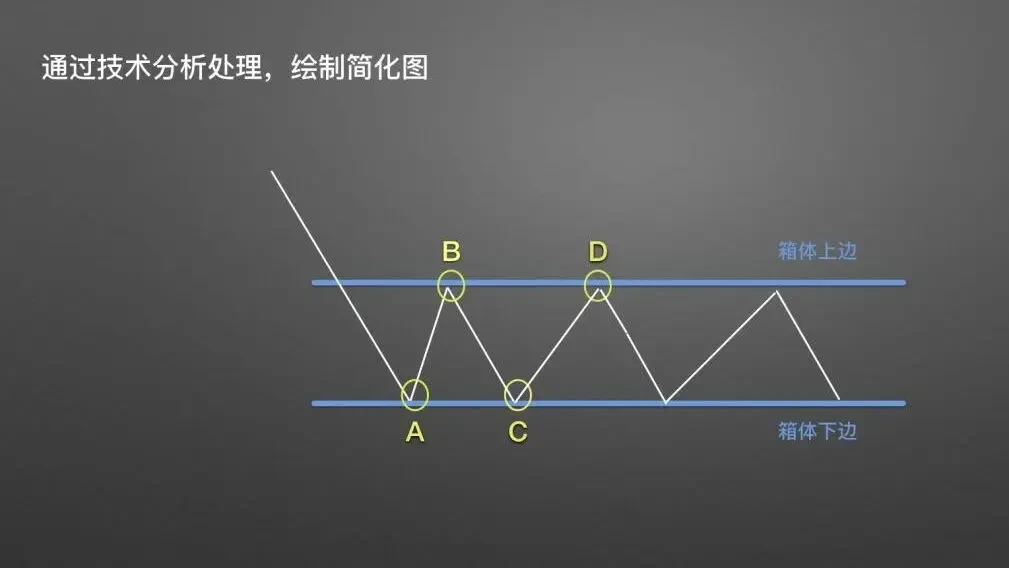
When price follows the pattern shown, we can identify four key points: A, B, C, and D. Connecting the two highs at B and D establishes the upper boundary of the trading range. Connecting the two lows at A and C establishes the lower boundary. The price is then likely to continue oscillating within the range.
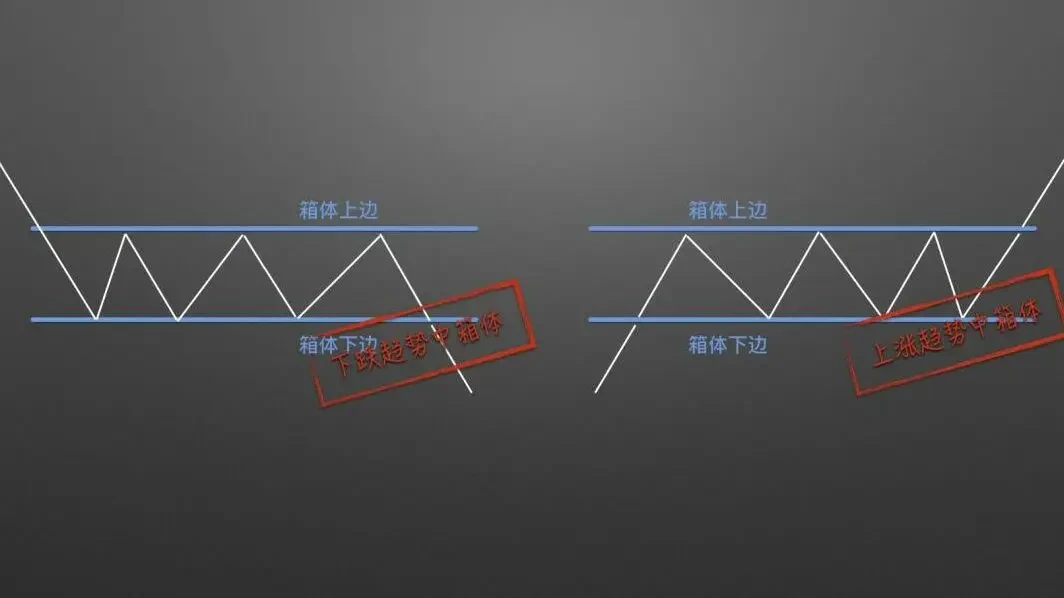
Depending on the trend direction, trading ranges are classified as those forming in a downtrend and those forming in an uptrend.
2. Trading Range Application Rules
When a trading range forms, how do you determine entry and exit timing?
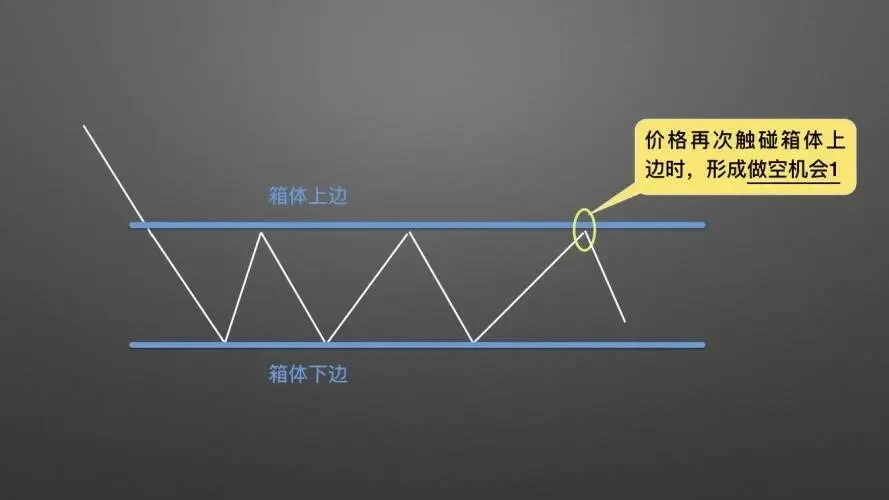
First, let's cover short-selling opportunities in a downtrend trading range.
The first shorting opportunity occurs after the trading range is confirmed and price approaches the upper boundary. The rationale here is that the upper boundary acts as resistance, and the overall trend is downward.
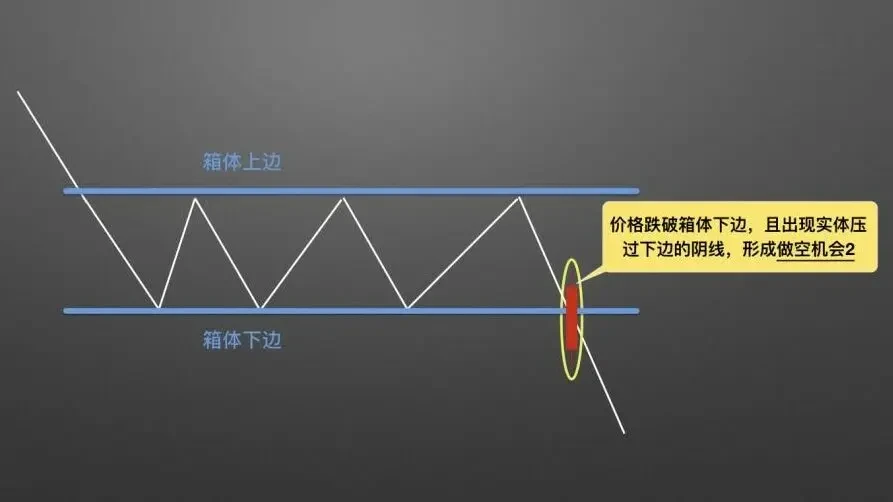
As shown, the second shorting opportunity occurs when price breaks below the lower boundary and a bearish candle body closes past it.
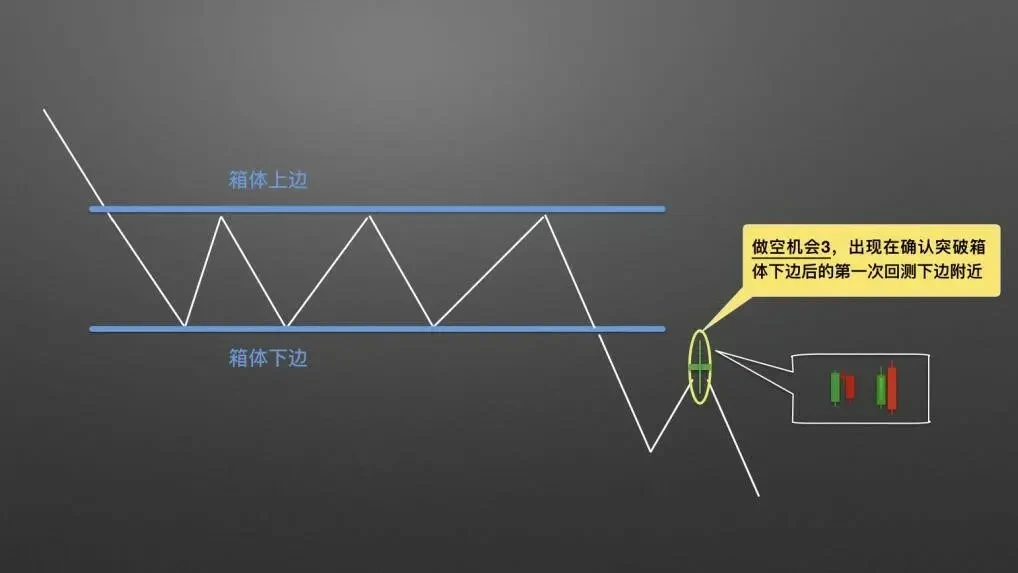
The third shorting opportunity occurs during the first retest of the lower boundary after the confirmed breakout below it. When bearish candlestick patterns covered in Lesson 4 appear — such as bearish engulfing or evening star formations — the short signal is even stronger.
Next, let's cover buying opportunities in an uptrend trading range.
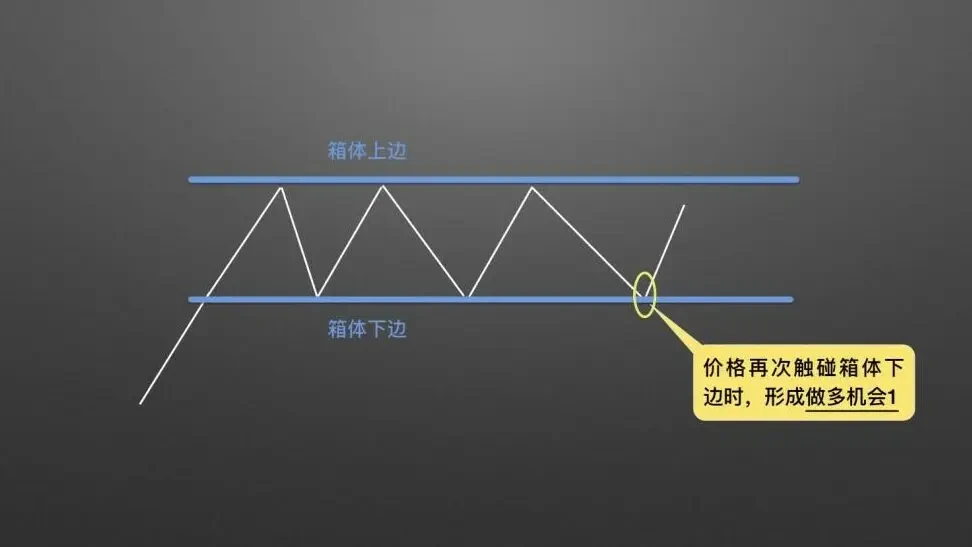
Buying opportunity 1 occurs after the trading range is confirmed and price drops near the lower boundary. Here, the lower boundary acts as support, and the overall trend is upward.
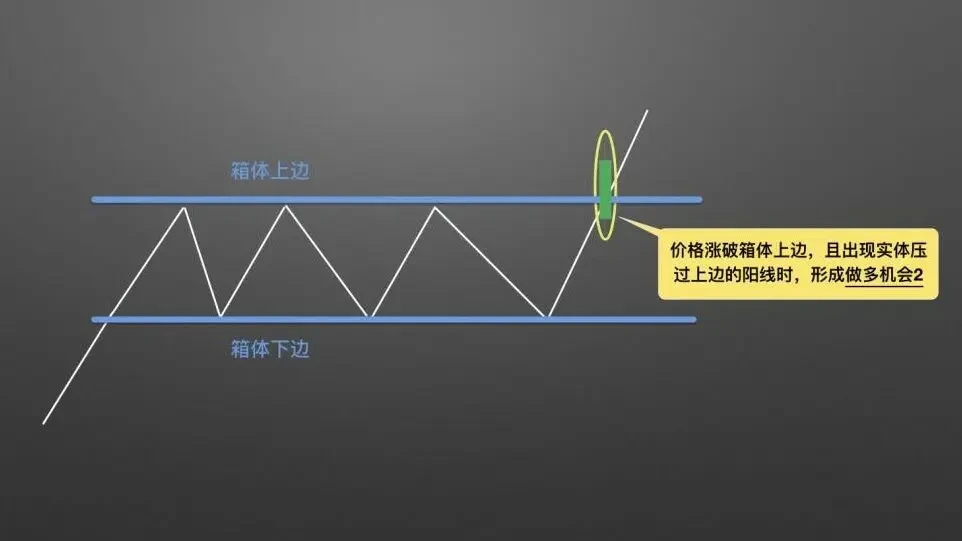
Buying opportunity 2 occurs when price breaks above the upper boundary and a bullish candle body closes past it.
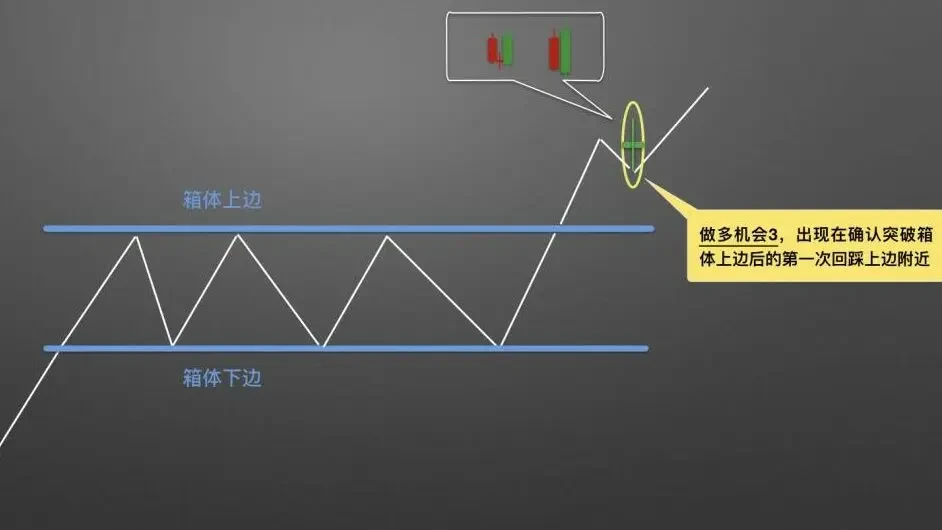
Buying opportunity 3 occurs during the first retest of the upper boundary after the confirmed breakout above it. When bullish candlestick patterns covered in Lesson 3 appear — such as bullish engulfing or morning star formations — the buy signal is even stronger.
What happens when risk materializes? How do you manage risk using the trading range pattern?
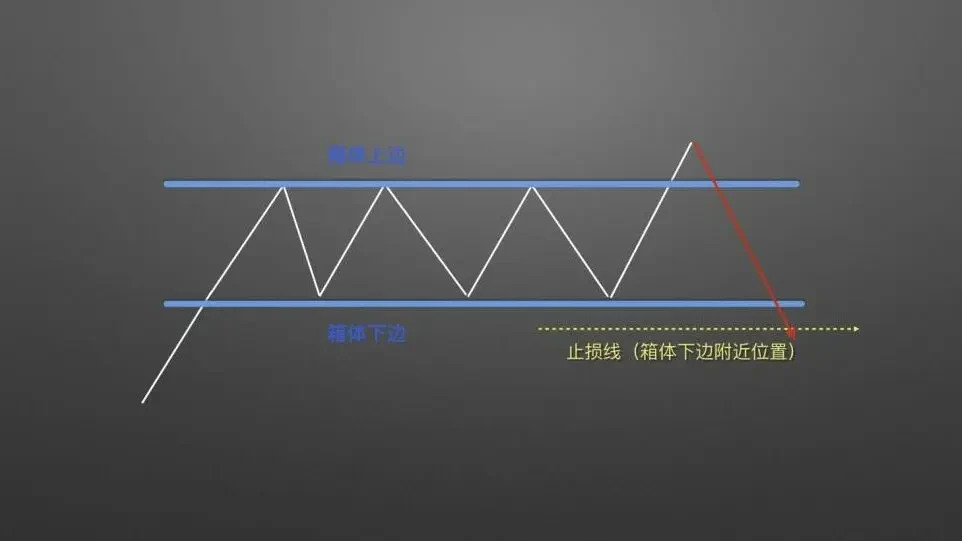
For a trading range in a downtrend, the stop-loss for shorts should be placed above the upper boundary, as shown. If price reverts back above the stop-loss line, exit immediately to avoid the risk of a sharp rally.
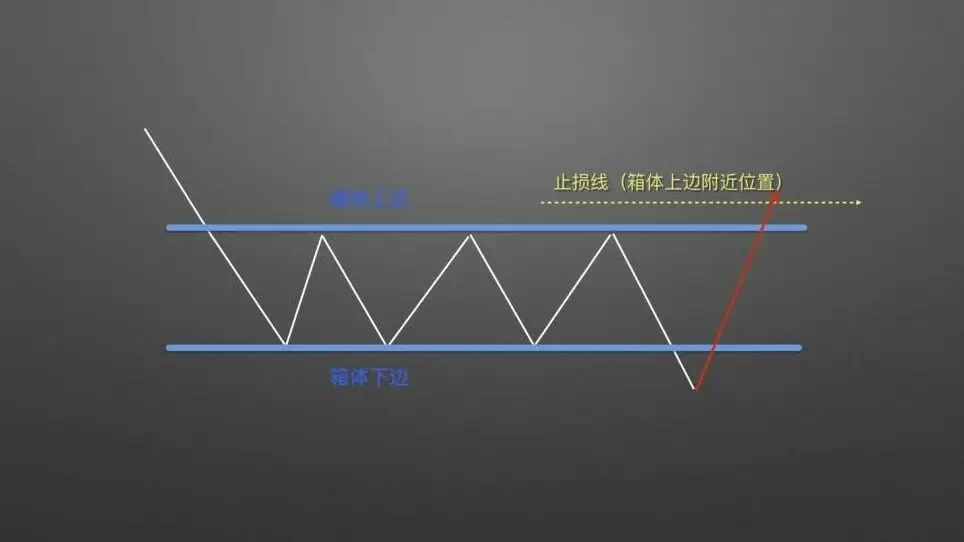
For a trading range in an uptrend, the stop-loss for longs should be placed below the lower boundary, as shown. If price falls back below the stop-loss line, exit immediately to avoid the risk of a sharp decline.
Let's look at how trading ranges are applied in real market conditions.
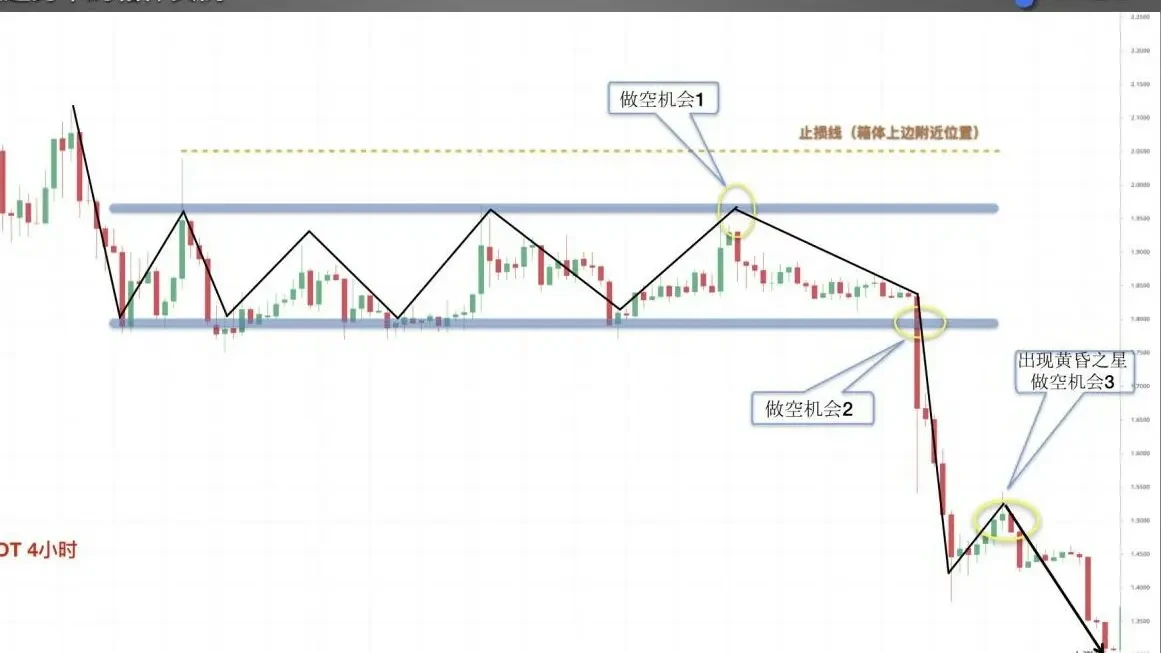
This shows a trading range in a downtrend. After the range was confirmed, three shorting opportunities appeared in sequence. The third opportunity did not retest the lower boundary as textbook cases would suggest. Short signal 3 was confirmed by the bearish candlestick pattern from Lesson 4 — an evening star formation. Following the trading range rules, the stop-loss was placed above the upper boundary near the wick high. The price ultimately declined relatively smoothly.
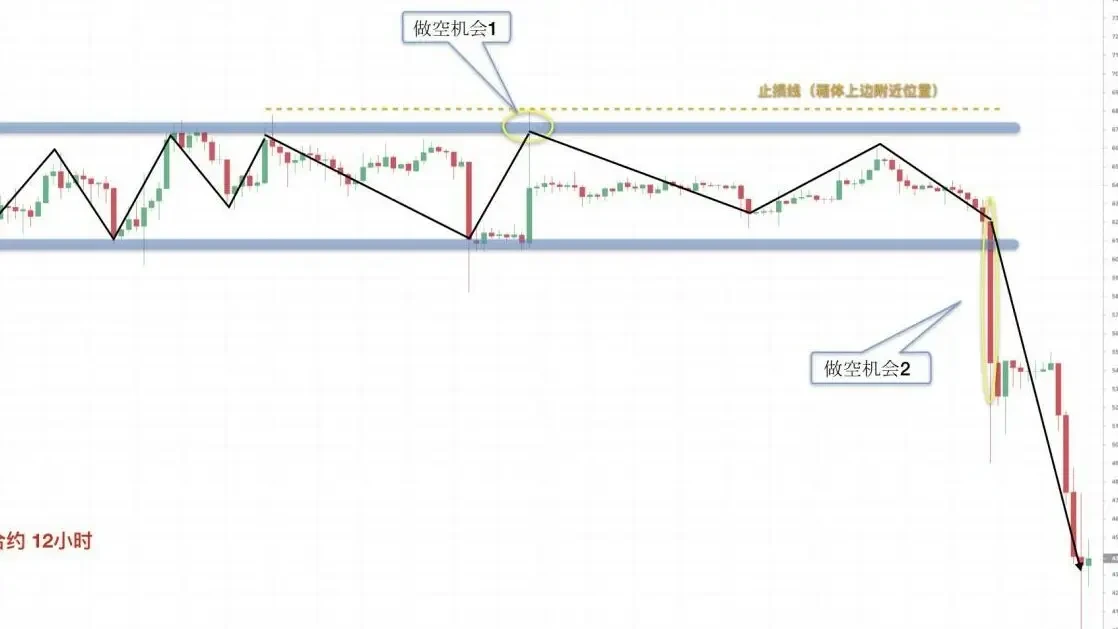
Case 2 is a screenshot from OKX Bitcoin quarterly futures 12-hour candlestick chart. After the trading range formed, the market conditions produced two clear bearish signals, as highlighted in yellow. Per the rules, the stop-loss was placed above the upper boundary. Although the price experienced a significant rally during this period, it did not trigger the stop-loss, and the price eventually declined.
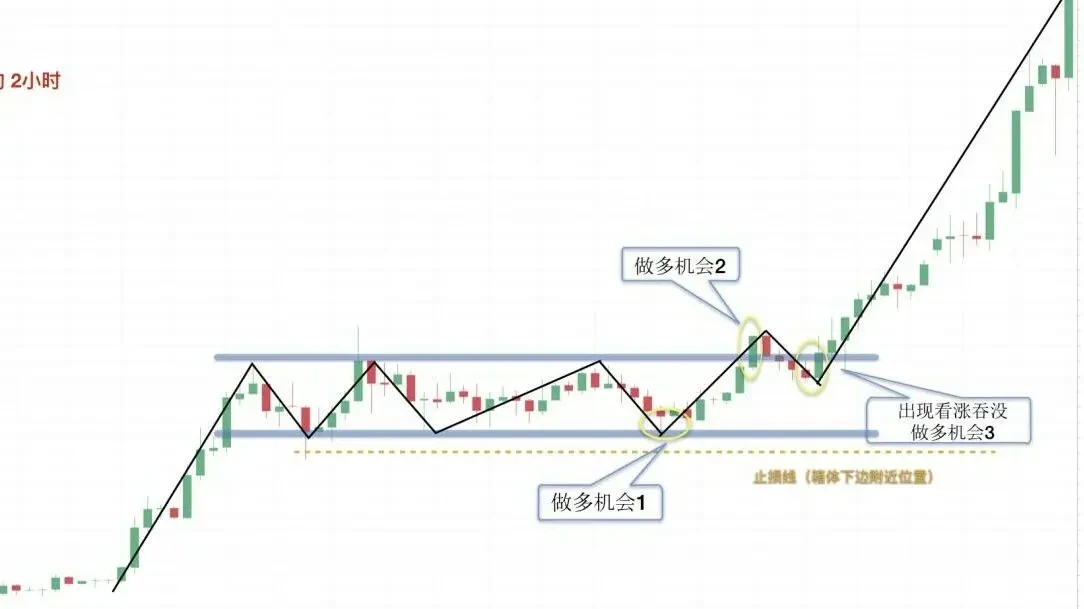
This shows a trading range in an uptrend. After the range was confirmed, three buying opportunities appeared in sequence. The third opportunity was somewhat unique — after price briefly broke below the upper boundary, a strong rally quickly formed, creating a bullish engulfing pattern that confirmed the buy signal. Following the trading range rules, the stop-loss was placed below the lower boundary. After the final buying opportunity was confirmed, the price rose very rapidly.
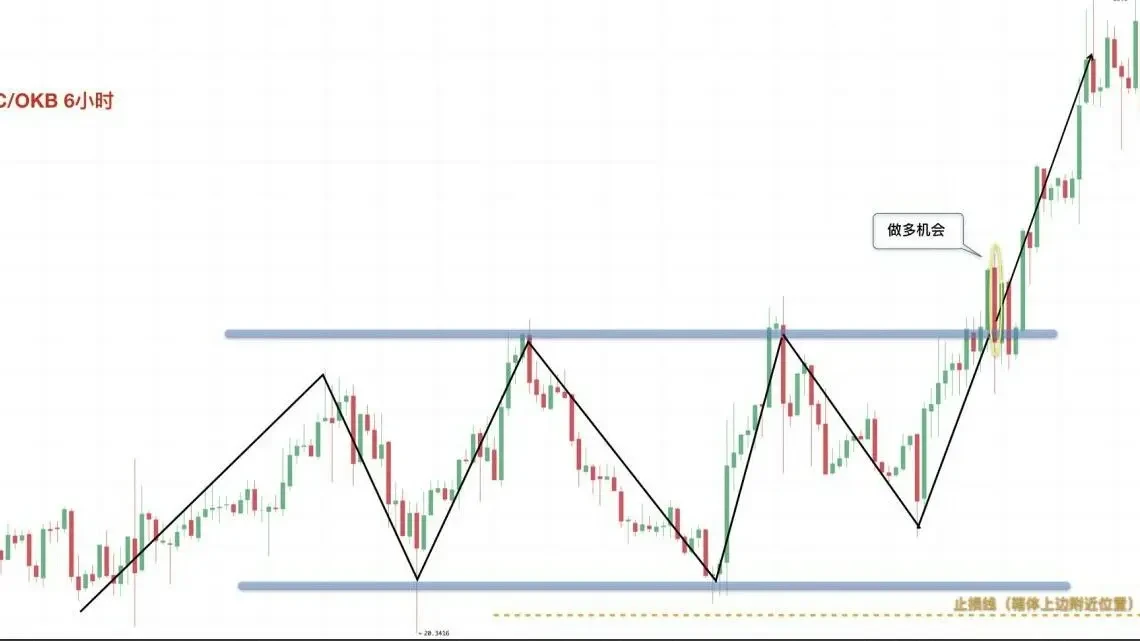
The final case is from OKX LTC/USDT 6-hour candlestick chart. After the trading range formed, the market conditions produced only one clear buy signal, as highlighted in yellow. The stop-loss was placed below the lower boundary.
For more tutorials, visit the OKX website and explore the Beginner's Academy.
Disclaimer
This article may contain product-related information not applicable to your region. This article is intended to provide general information only and makes no representation as to any factual errors or omissions. The views expressed herein are those of the author and do not necessarily reflect the opinions of OKX. This article is not intended to provide, and should not be construed as, any advice whatsoever, including but not limited to: (i) investment advice or investment recommendations; (ii) an offer or solicitation to buy, sell, or hold digital assets; or (iii) financial, accounting, legal, or tax advice. Holdings in digital assets (including stablecoins) involve a high degree of risk and may fluctuate dramatically, or even become worthless. You should carefully consider whether trading or holding digital assets is appropriate for you in light of your financial situation. For questions regarding your specific circumstances, please consult your legal/tax/investment professional. The information contained in this article (including market data and statistics, where applicable) is provided for general reference purposes only. While reasonable precautions have been taken in the preparation of such data and charts, we accept no responsibility for any factual errors or omissions expressed herein. © 2025 OKX. This article may be reproduced or distributed in its entirety, or quoted in excerpts of 100 words or less, provided that such use is non-commercial in nature. Any reproduction or distribution of the full article must also prominently state: "This article is copyrighted © 2025 OKX, used under permission." Permitted excerpts must cite the article title and include the source, for example: "Article Title, [Author Name (if applicable)], © 2025 OKX." Portions of this content may have been generated or assisted by artificial intelligence (AI) tools. Derivative works and other uses of this article are not permitted.
Show More
Recommended Reading

Profit from Bitcoin's Decline? How to Trade Futures Contracts
As the cryptocurrency market represented by Bitcoin continues to expand, derivatives trading has emerged in various forms beyond spot trading, serving as a risk-hedging tool. Among these, futures trading has garnered the most attention. What is futures trading? Futures are the most common form of trading contract in the cryptocurrency derivatives market. Digital assets futures trading refers to an agreement between a buyer and seller to trade a specific asset at a predetermined price at a future date.
January 16, 2026

Simpler Than Copy Trading? One-Click Copy the Top Traders on OKX and Let Them Trade for You
Whether in traditional finance or the cryptocurrency market, copy trading is a crucial and integral part of the trading ecosystem. When facing complex trading conditions and extreme market volatility, even traders with solid theoretical knowledge and extensive experience can easily miss trading opportunities or make poor decisions influenced by emotions. Copy trading is precisely the tool that can solve these problems. Now that you have your trading tools, how do you
November 21, 2025

5. Strategic Trading Series — Recurring Buy Plan
Preface: We often wonder: during a bull market, there are many digital assets that surge in value. If we could consistently capture assets with large gains, such as one that doubles every month, our holdings would multiply by 2 to the 12th power — that's 4,096 times — over a year. That's incredible, though practically impossible, because it's very difficult to consistently capture assets that make big moves. This is a common challenge many users face: in a bull market, although
November 3, 2025

Which Countries/Regions Do Not Support OKX Registration
OKX currently does not provide services to customers in the following regions: certain U.S. territories, including New York, Texas, Puerto Rico, American Samoa, Guam, the Commonwealth of the Northern Mariana Islands, the U.S. Virgin Islands (St. Croix, St. John, and St. Thomas), Cuba, Iran, North Korea, Crimea, Malaysia, Syria, Bangladesh, and Bolivia. For more details, please refer to the OKX Terms of Service.
April 25, 2024

Quick Guide to OKX Products and Features
OKX (www.okx.com) is one of the world's leading digital assets service platforms, primarily serving global users with Bitcoin, Ethereum, and other digital assets spot and derivatives trading services, while also exploring the worlds of DeFi, dApps, NFTs, and GameFi alongside its users. On OKX, you can enjoy seamless spot and futures trading experiences, stay updated on tokens in trending sectors/concepts in real time, and much more.
April 25, 2024

Candlestick Charts from Scratch | 5 The Importance of Candlestick Pattern Application
Trends drive price action — learn to read the language of charts; signals guide your trades — stop trading on instinct. 1. Key Levels for Bullish Candlestick Patterns In the previous two chapters of this section, we covered bullish and bearish candlestick combinations and their applications. However, these patterns are not effective in every location. In this chapter, we'll explain why the position where these patterns appear matters so much. Where do bullish patterns work best? First scenario: late in a clear uptrend,
April 25, 2024


