Zero Basics to Learn K-Line | 17 Smart Money Layout Patterns 3 — Wedge
Uptrends and downtrends exist; learn to read price language;
Buy and sell signals exist; stop trading based on intuition.Trading
I. Wedge Patterns
In this lesson, we'll learn a common smart money layout pattern — the wedge.
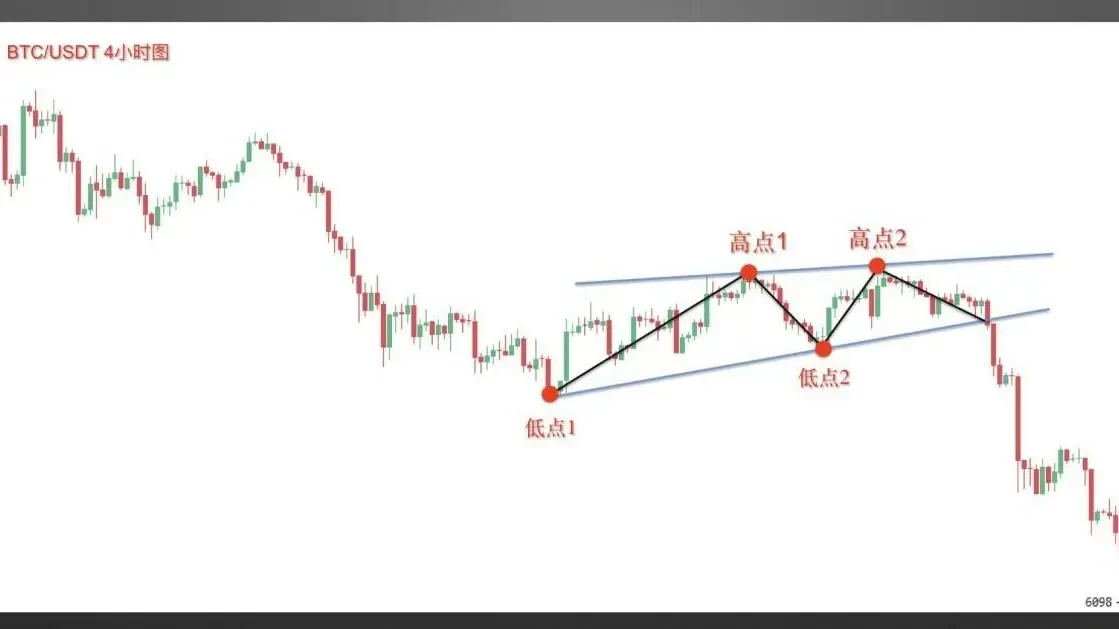
First, let's understand what a wedge is. In a price trend, connect two adjacent highs of the price, and at the same time connect the two corresponding pullback lows. This gives you two lines moving in the same direction and gradually converging to the right. The shape between these two lines is called a wedge.
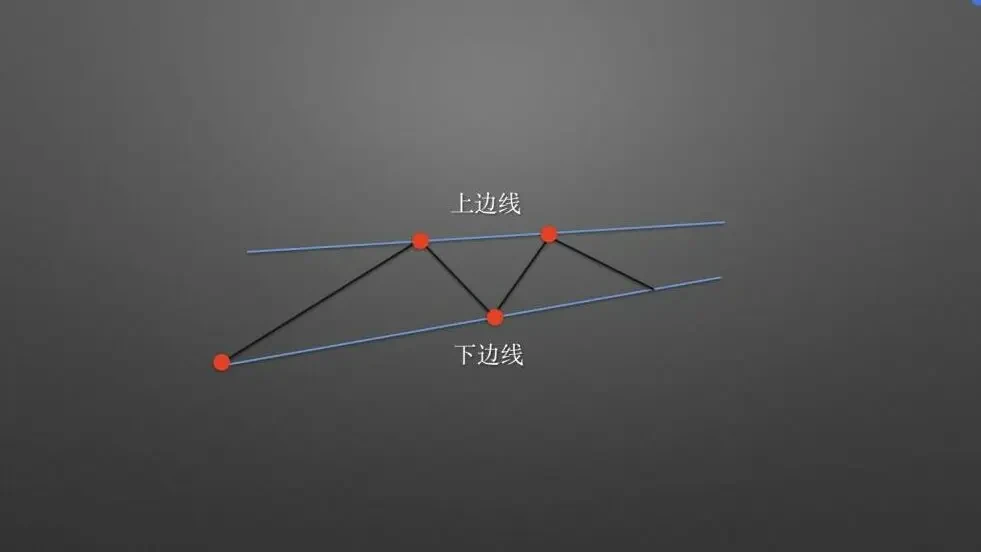
The line connecting the highs is the upper boundary, and the line connecting the lows is the lower boundary.
Based on the direction of the wedge's movement, they can be classified as follows:
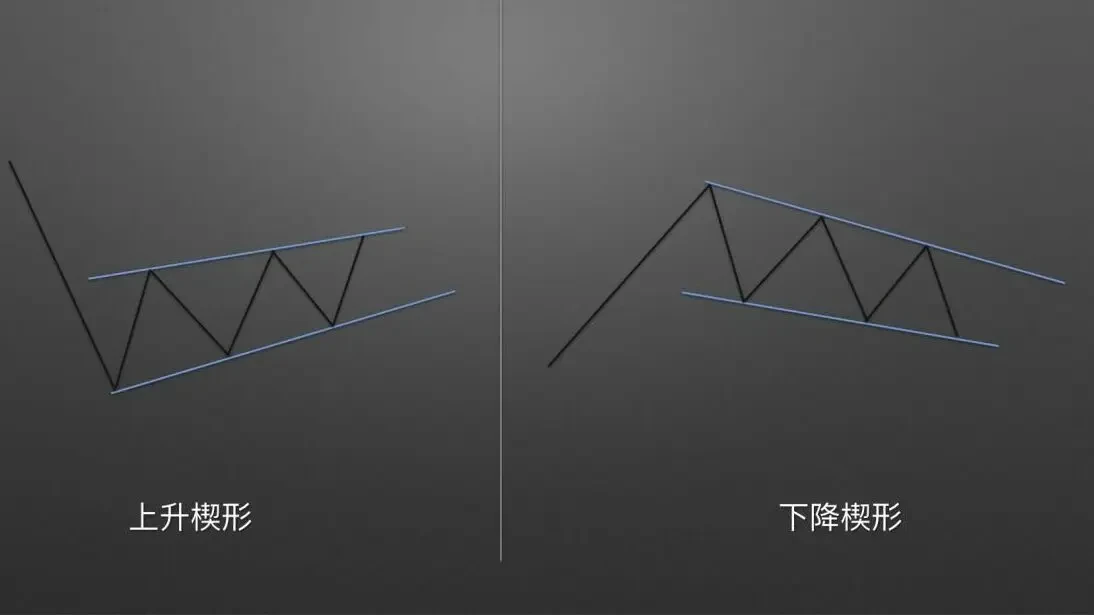
When both boundaries of the wedge are moving upward, it is called a rising wedge. Before a rising wedge forms, the price is typically in a downtrend. Conversely, when both boundaries are moving downward, it is called a falling wedge. Before a falling wedge forms, the price is typically in an uptrend.
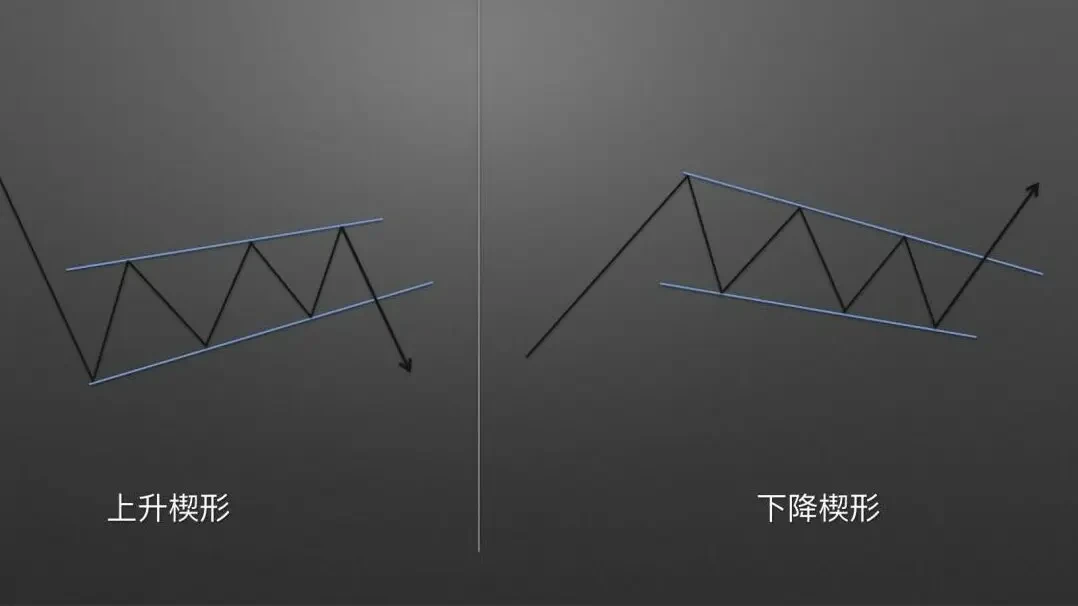
Post-completion direction of wedges: After a rising wedge completes, the price typically continues to move downward following the pre-wedge downtrend. After a falling wedge completes, the price typically continues to move upward following the pre-wedge uptrend.
Let's look at two real-world cases:
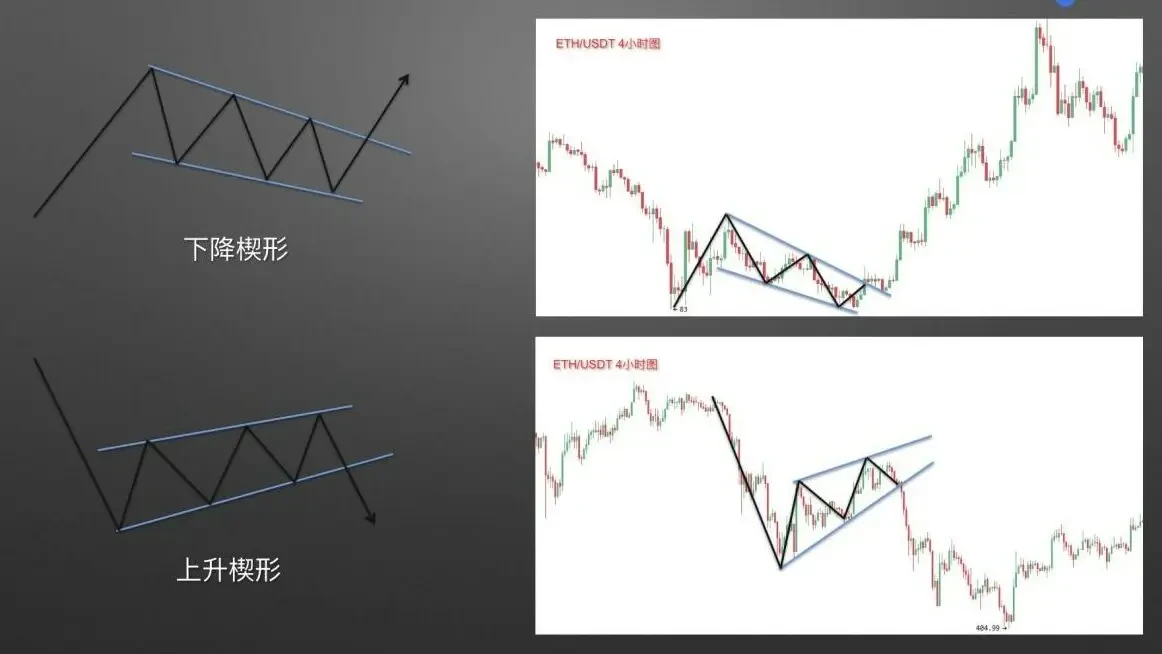
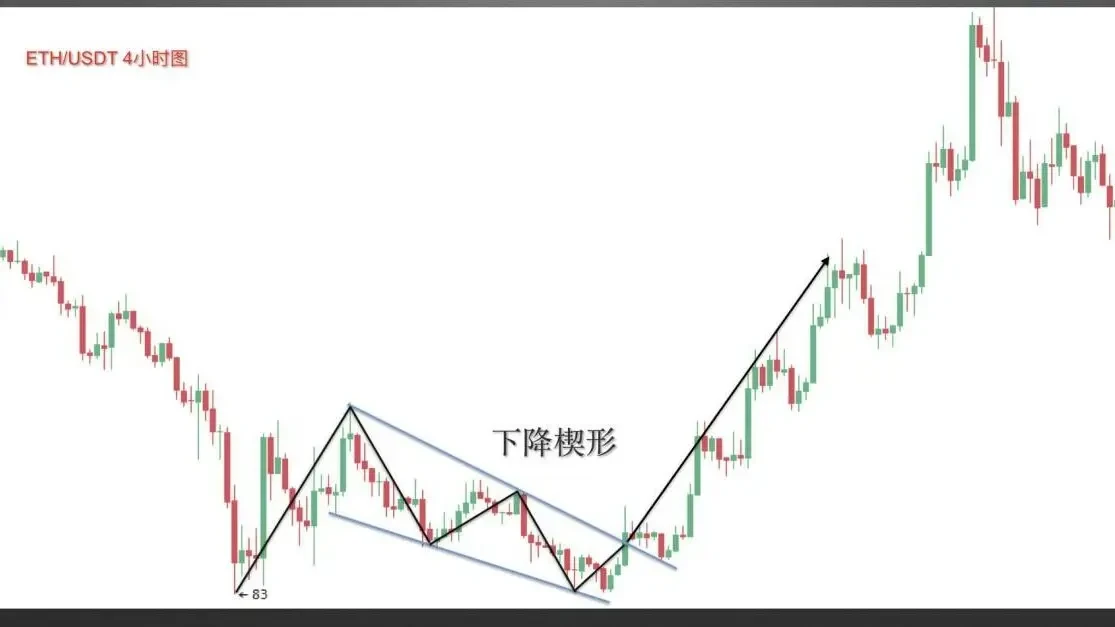
Falling wedge example, screenshot from OKX spot trading area ETH/USDT 4-hour chart. After an uptrend, the price pulled back and formed a falling wedge. Once the wedge completed, the price continued to rise.
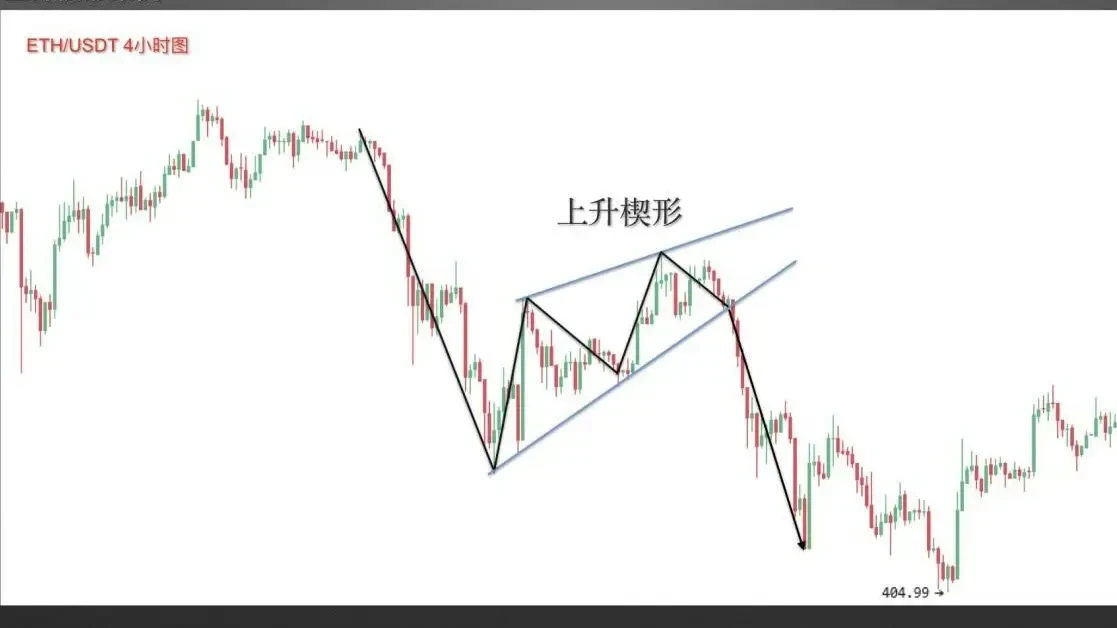
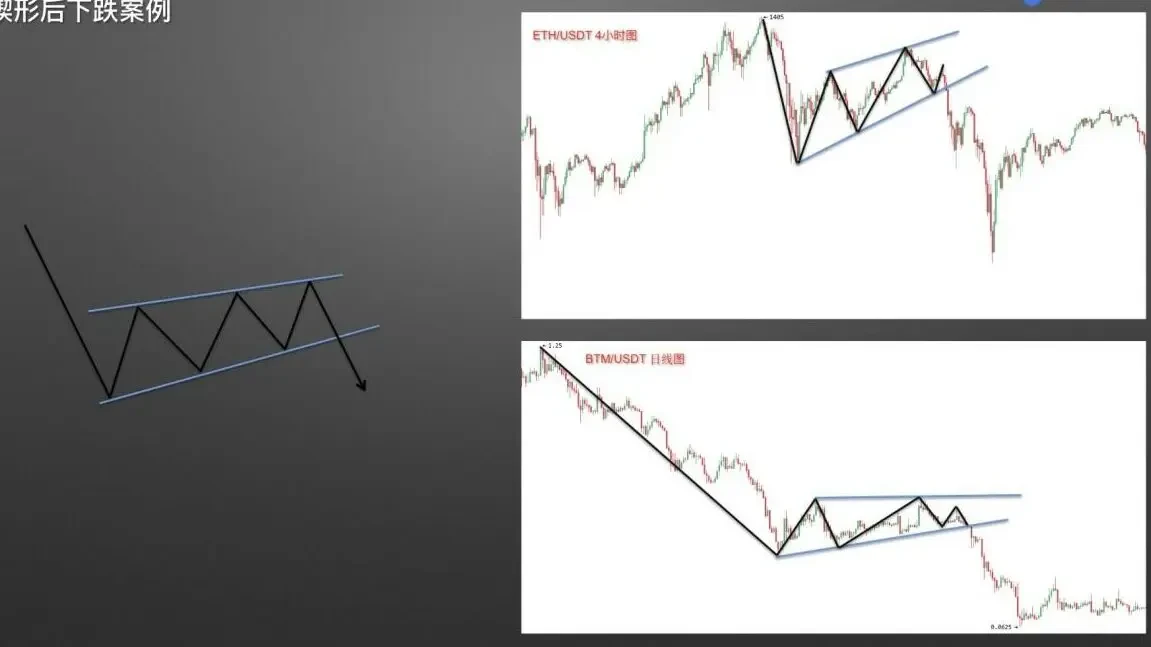
Rising wedge example, screenshot from OKX ETH/USDT 4-hour chart. After a significant downtrend, the price bounced and formed a rising wedge. After the wedge completed, the price continued to move downward following the prior downtrend.
II. Application Rules for Wedge Patterns
Now that we have a basic understanding of wedge characteristics, how do we identify buy points for falling wedges and sell points for rising wedges?
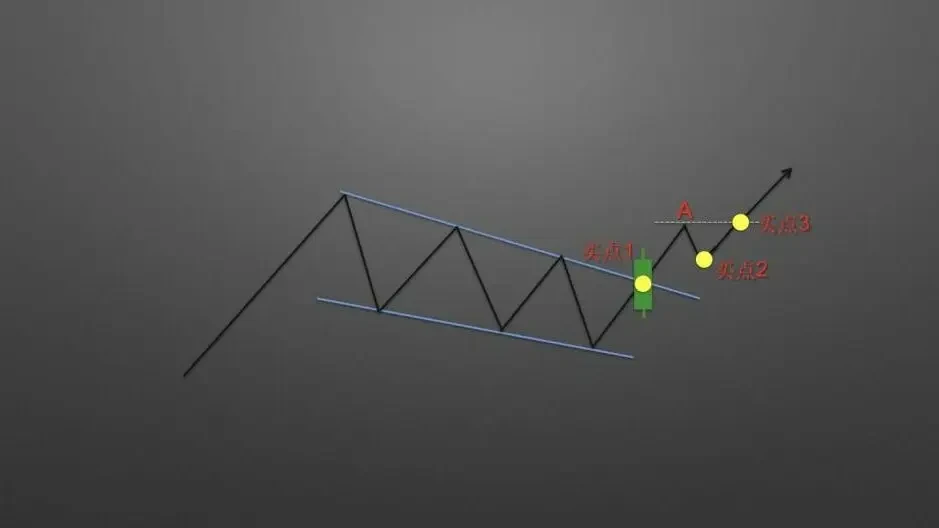
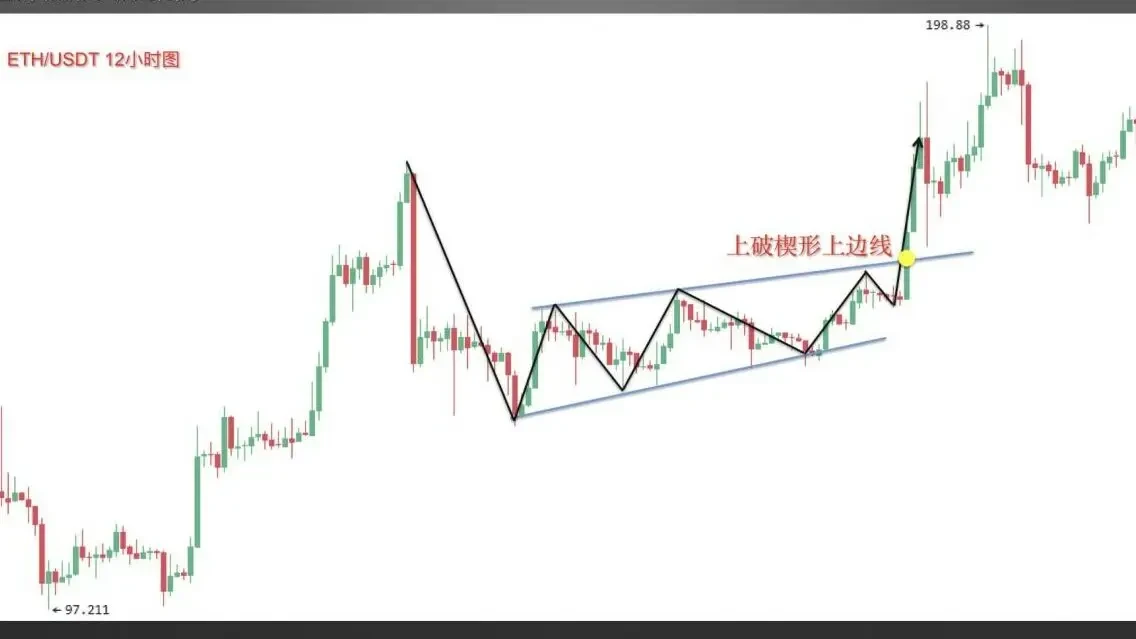
First, let's look at the three types of buy points for falling wedges: When the upper boundary of the wedge is decisively broken to the upside, the first type of buy point appears, labeled as Buy Point 1. After the price rallies and then pulls back, finding support and rebounding above the upper boundary of the wedge — this forms Buy Point 2. When the price continues higher and breaks above Point A, the third type of buy point forms, labeled as Buy Point 3.
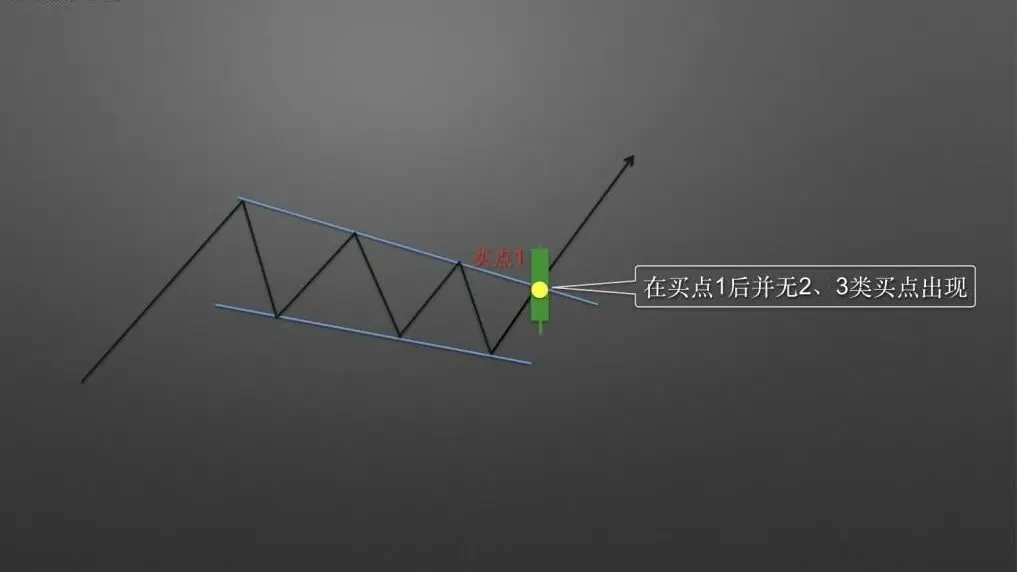
Not every wedge will produce all three types of buy points. In strong markets, often only the first type of buy point appears, with no second or third buy points.
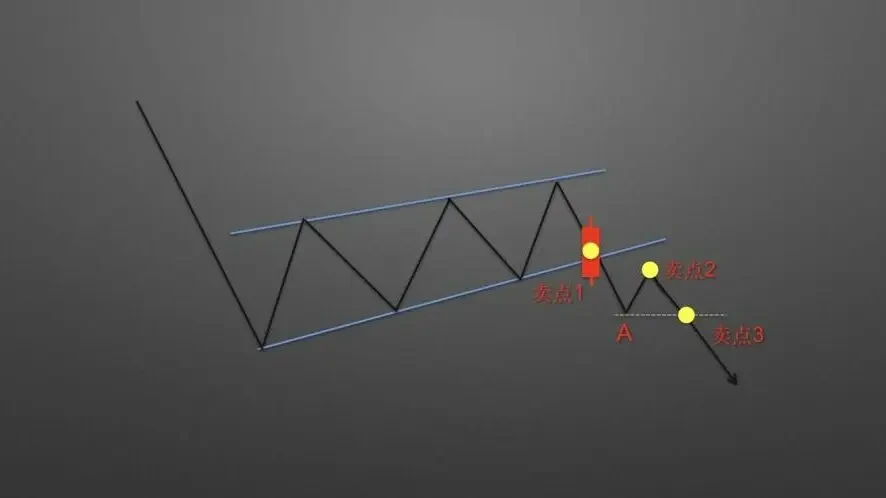
Next, let's look at the three types of sell points for rising wedges. When the lower boundary of the wedge is decisively broken to the downside, the first type of sell point appears, labeled as Sell Point 1. After the price declines and then bounces, failing to hold above the lower boundary of the wedge and pulling back — this forms Sell Point 2. When the price continues lower and breaks below Point A, the third type of sell point forms, labeled as Sell Point 3.
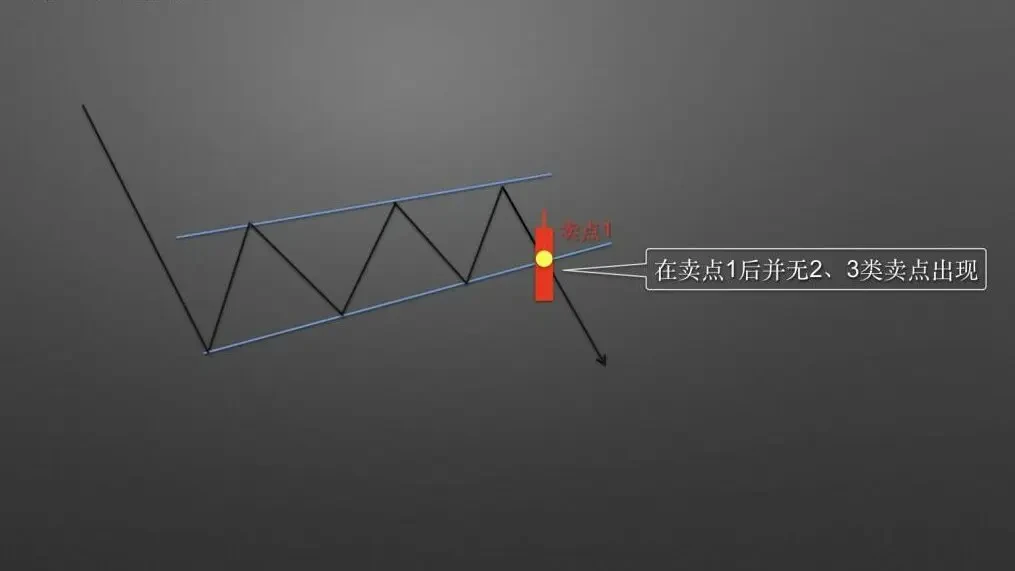
In extremely weak markets, typically only the first type of sell point appears, with no second or third sell points.
From the above, we now know how to find buy and sell points using wedges. So how do we determine the minimum price target for wedges?
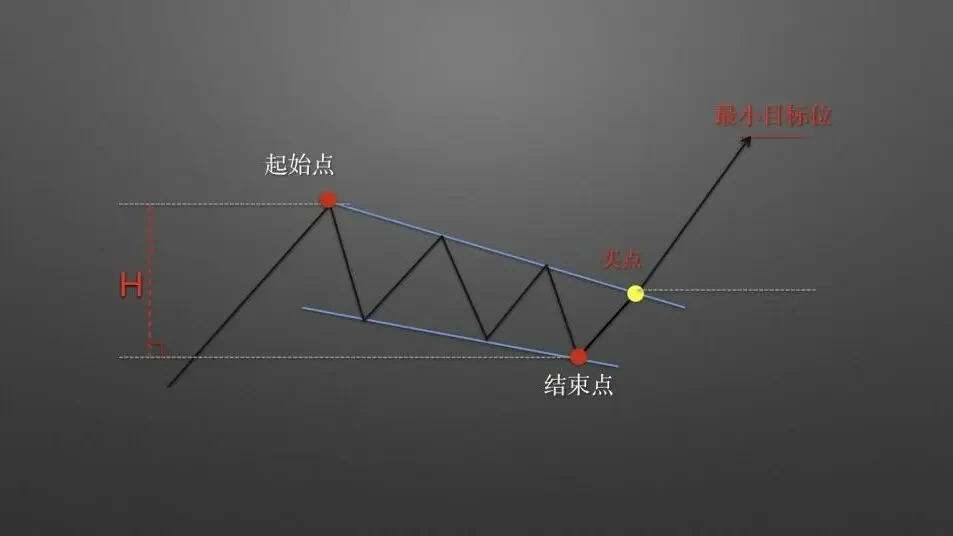
Method to establish the minimum upward target after a falling wedge: As shown, after the price breaks above the upper boundary of the falling wedge and a buy point appears, the height from the starting point to the ending point of the falling wedge serves as the minimum upward target after breaking the upper boundary.
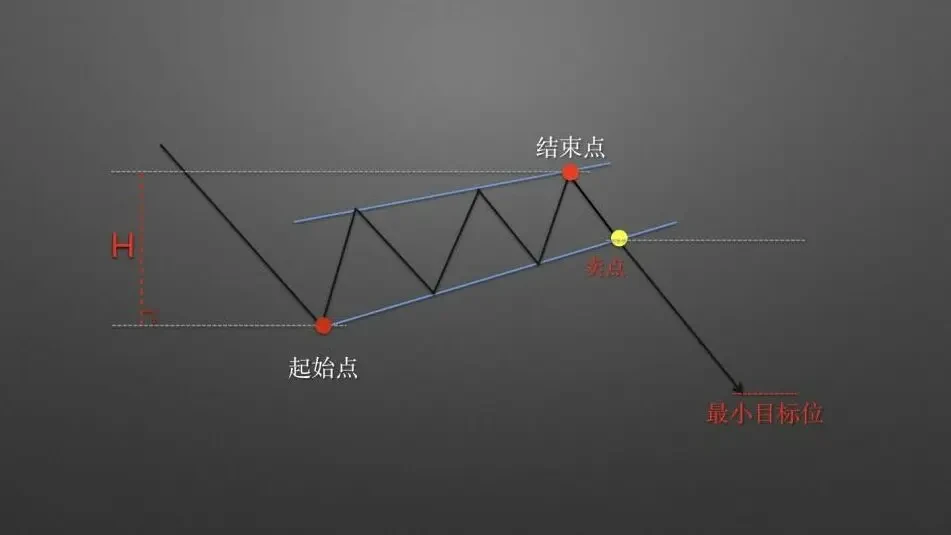
Now let's look at the method to establish the minimum downward target after a rising wedge: As shown, after the price breaks below the lower boundary of the rising wedge and a sell point appears, the height from the starting point to the ending point of the rising wedge serves as the minimum downward target after breaking the lower boundary.
Let's demonstrate this with real-world cases:
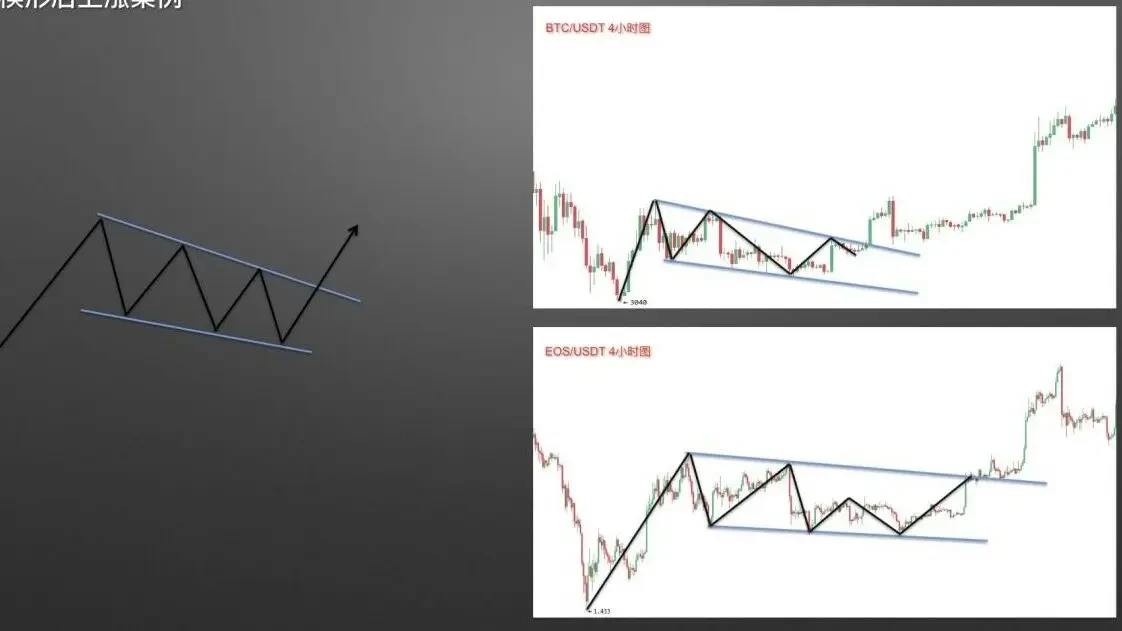
First, two cases of price rising after falling wedges:
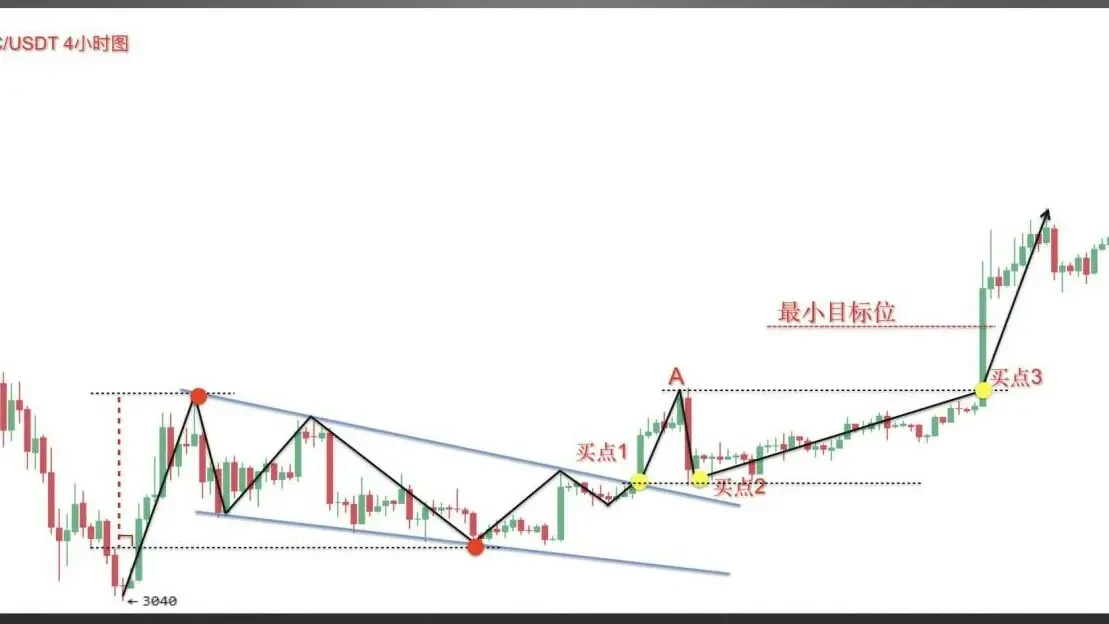
Case 1, screenshot from OKX spot trading area BTC/USDT 4-hour chart. After an uptrend, the price pulled back and formed a falling wedge. Once the wedge completed, the price successfully broke above the upper boundary, all three buy points appeared in sequence, and the price rose to the minimum target before moving even higher.
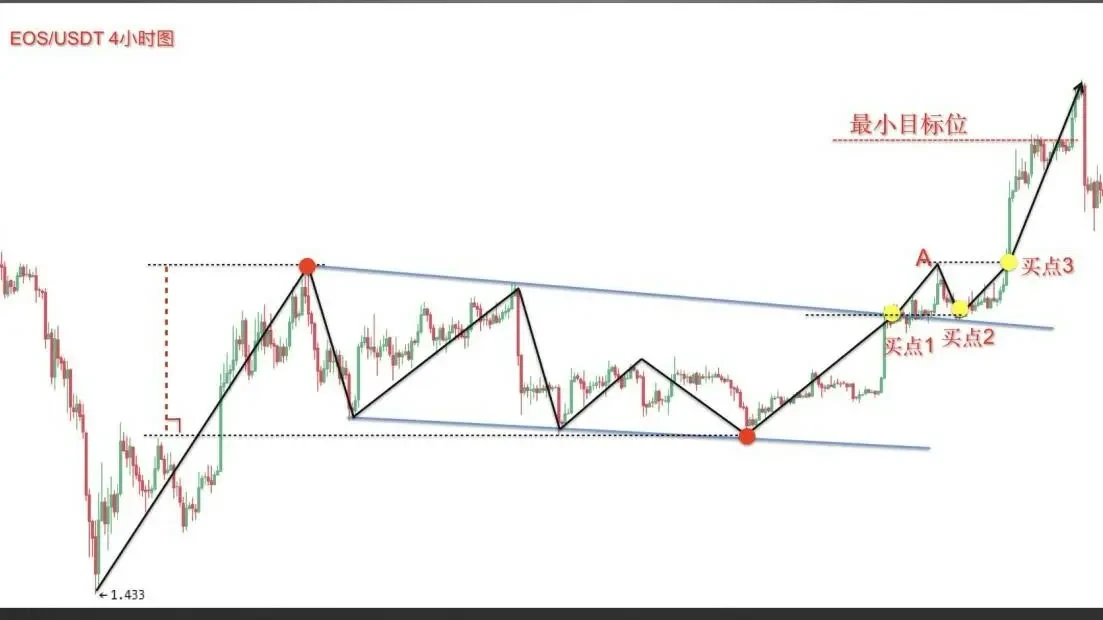
Case 2, screenshot from OKX EOS/USDT 4-hour chart. After a significant rally, the price entered a prolonged consolidation forming a falling wedge. Eventually, the price broke above the upper boundary and all three buy points appeared in sequence. The price then rose as expected to the minimum target.
Next, two cases of price declining after rising wedges:
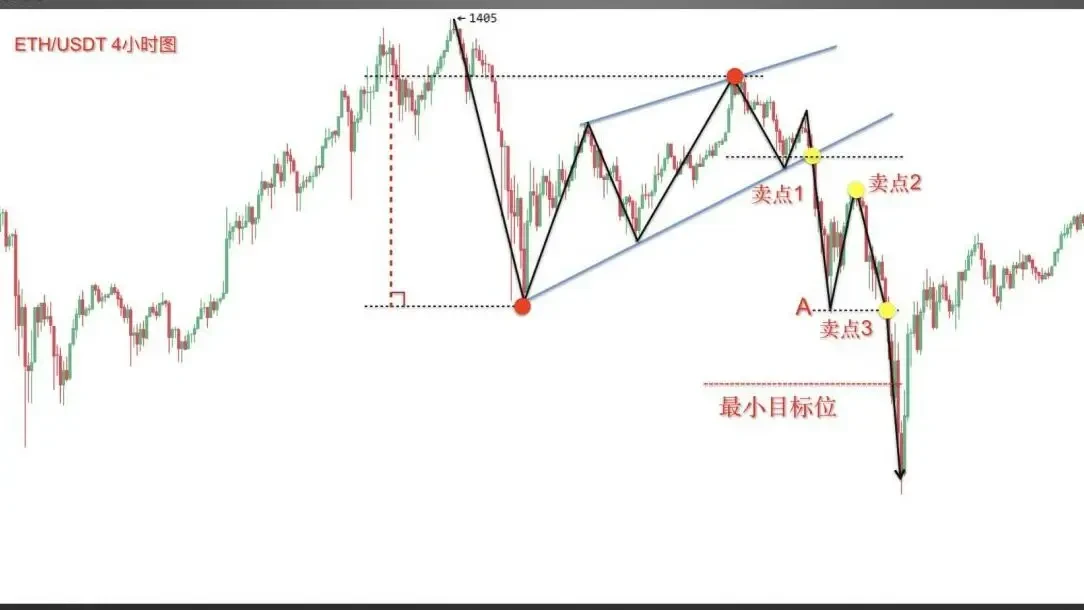
Case 1, screenshot from OKX spot trading area ETH/USDT 4-hour chart. The price declined sharply from its high, then bounced forming a rising wedge consolidation. After the consolidation ended, the price broke below the lower boundary with all three sell points appearing in sequence, and continued downward to the minimum target.
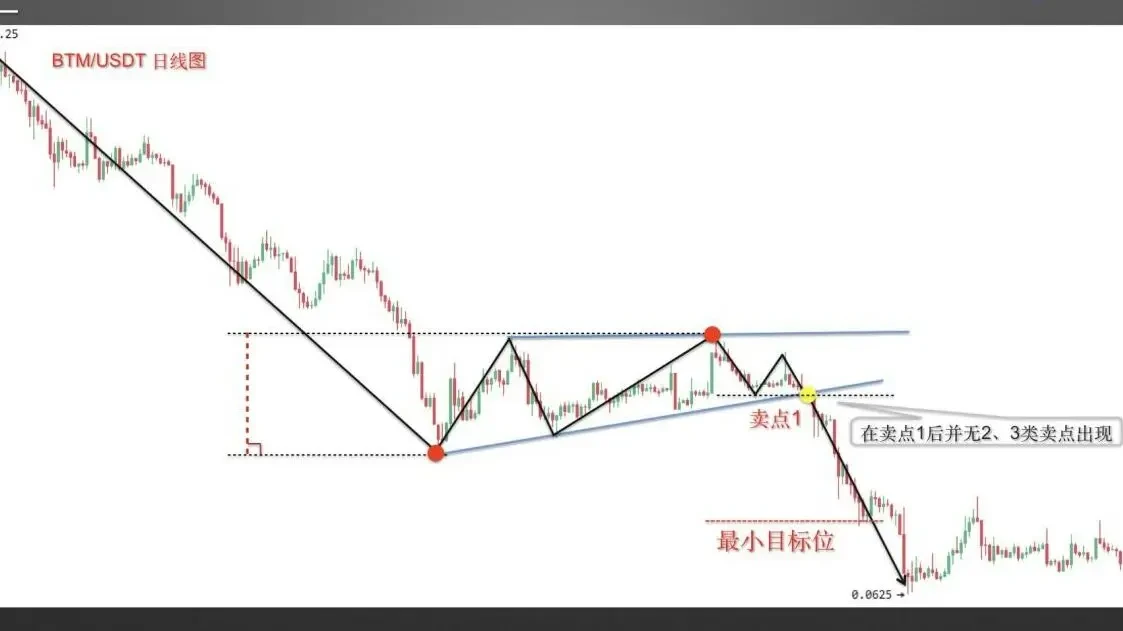
Case 2, screenshot from OKX BTM/USDT 4-day chart. After a prolonged and significant downtrend, the price rallied and eventually formed a rising wedge. After the wedge consolidation ended, the price broke below the lower boundary as expected. Since the market was extremely weak, only Sell Point 1 appeared after the wedge completed, with no second or third sell points. The price then declined to the minimum target.
Of course, not every wedge will successfully follow the expected pattern — they can also fail.
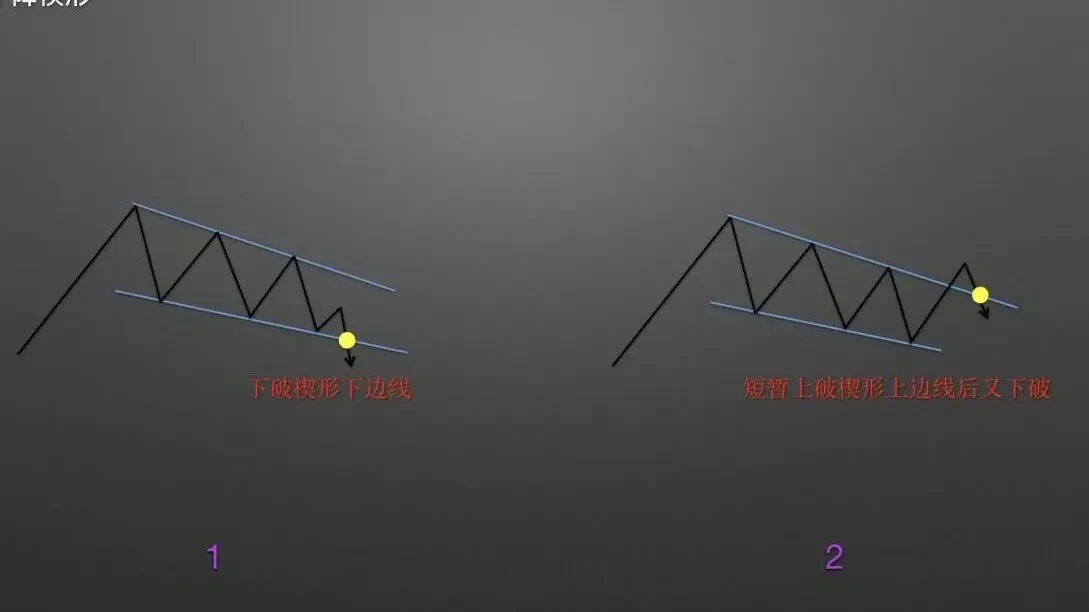
Characteristics of a failed falling wedge: Scenario 1: After the wedge completes, the price does not break above the upper boundary but instead breaks below the lower boundary. Scenario 2: The price briefly breaks above the upper boundary but then breaks below. Either of these two scenarios indicates the falling wedge has failed.
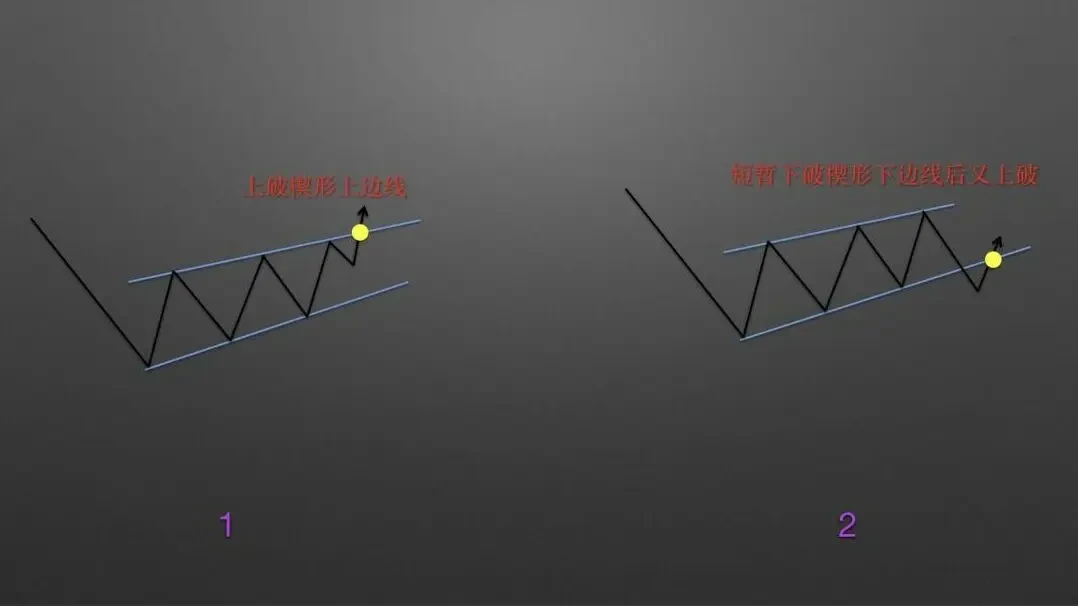
Characteristics of a failed rising wedge: Scenario 1: After the wedge completes, the price does not break below the lower boundary but instead breaks above the upper boundary, signaling failure of the rising wedge. Scenario 2: The price briefly breaks below the lower boundary but then breaks above. Either of these two scenarios indicates the rising wedge has failed.
Finally, let's look at two examples of failed wedge patterns:
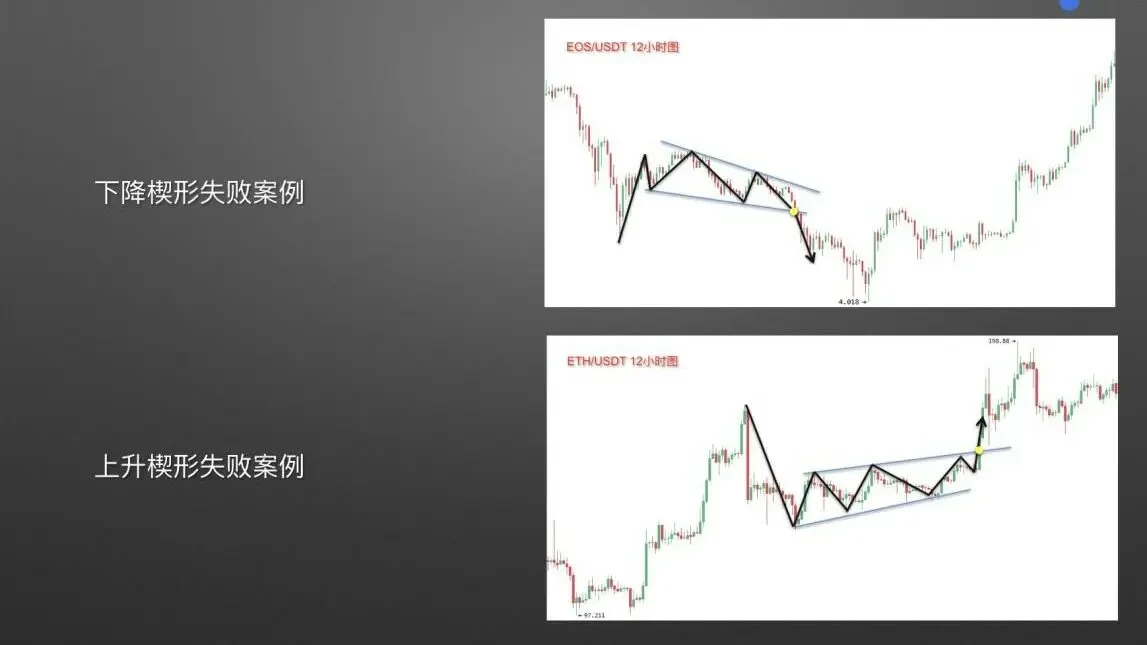
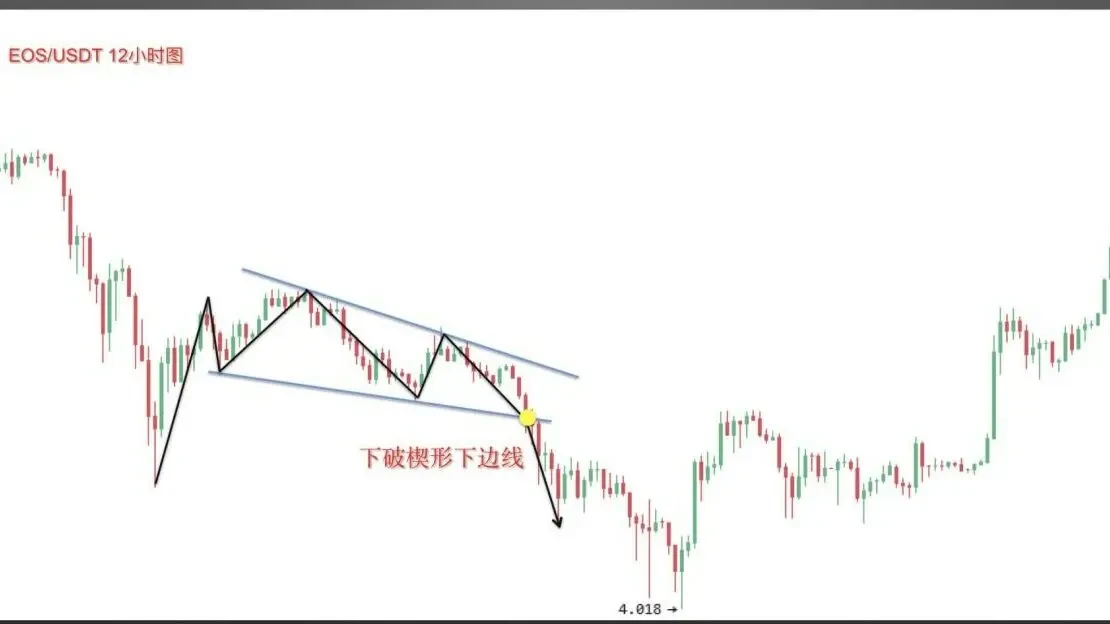
Failed falling wedge example: screenshot from OKX EOS/USDT 4-hour chart. After forming a falling wedge, instead of breaking above the upper boundary, the price broke below the lower boundary. This falling wedge failed.
Failed rising wedge example: screenshot from OKX ETH/USDT 12-hour chart. After forming a rising wedge, instead of breaking below the lower boundary, the price broke above the upper boundary. This rising wedge failed. If you have already entered a position based on the wedge pattern expectation, and the price action deviates from your expectation, exit with a stop loss immediately to avoid greater losses.
For more courses, welcome to visit the Novice Academy on the OKX website.
Disclaimer
This article may contain product-related content not applicable to your region. This article is intended solely to provide general information and makes no representations as to the accuracy or completeness of any information contained herein. This article represents the author's personal views only and does not reflect the views of OKX. This article is not intended to provide any advice, including but not limited to: (i) investment advice or investment recommendations; (ii) offers or solicitations to buy, sell, or hold digital assets; or (iii) financial, accounting, legal, or tax advice. Holdings in digital assets (including stablecoins) involve a high degree of risk and may fluctuate significantly, potentially even becoming worthless. You should carefully consider whether trading or holding digital assets is appropriate for you based on your financial situation. For questions specific to your circumstances, please consult your legal/tax/investment professional. Any information contained in this article (including market data and statistics, where applicable) is provided for general reference purposes only. While we have taken all reasonable precautions in preparing such data and charts, we make no representations as to any factual errors or omissions expressed herein. © 2025 OKX. This article may be reproduced or distributed in its entirety, and excerpts of 100 words or fewer may be used, provided such use is non-commercial in nature. Any reproduction or distribution of the full article must also include a prominent attribution: "This article is copyrighted © 2025 OKX, used with permission." Authorized excerpts must cite the article title and include attribution, for example: "Article title, [author name (if applicable)], © 2025 OKX". Some content may have been generated or assisted by artificial intelligence (AI) tools. Derivative works and other uses of this article are not permitted.
Show More
Recommended Reading

Profit from Bitcoin Declines? How to Trade Futures Contracts
As the cryptocurrency market represented by Bitcoin continues to expand, various derivative trading products have emerged alongside spot trading, serving as risk hedging tools. Among them, futures trading has attracted the most attention. What is futures trading? Futures are the most common form of trading contracts in the cryptocurrency derivatives market. Digital asset futures trading refers to buyers and sellers agreeing to trade a specific asset at a predetermined price at a future date.
January 16, 2026

Easier Than Copying Strategies? Follow Top Traders with One Click on OKX and Let Them Make Money for You
Whether in traditional finance or the cryptocurrency market, strategy trading is a crucial component of the trading system. When facing complex trading environments and extreme market conditions, even those with solid theoretical knowledge and extensive trading experience can easily miss trading opportunities or make poor decisions driven by emotions. Strategy trading is precisely an effective tool to address these issues. Now that you have your trading tools ready, how do you
November 21, 2025

Part 5: Strategic Trading Series — Cost-Averaging Tool
Preface: We often wonder: during a bull market, there are many digital assets that surge. If you could continuously capture coins with significant gains — for example, capturing one that doubles every month — after a year your assets would multiply by 2 to the 12th power, which is 4,096 times. That's astonishing, but also nearly impossible to achieve, because it's very difficult to consistently capture surging assets. This is a common problem many users face: during a bull market, although
November 3, 2025

Which Countries/Regions Do Not Support OKX Registration
OKX currently does not offer services to customers in the following regions: certain U.S. territories such as New York, Texas, Puerto Rico, American Samoa, Guam, Northern Mariana Islands, U.S. Virgin Islands (St. Croix, St. John, and St. Thomas), Cuba, Iran, North Korea, Crimea, Malaysia, Syria, Bangladesh, and Bolivia. For details, please refer to the OKX Terms of Service.
April 25, 2024

Quick Guide to OKX Products and Features
OKX (www.okx.com) is one of the world's leading digital asset service platforms, primarily offering global users spot and derivatives trading services for Bitcoin, Ethereum, and other digital assets, while also exploring the worlds of DeFi, dApps, NFTs, and GameFi alongside its users. On OKX, you can enjoy seamless spot and futures trading experiences, stay updated on tokens in trending sectors/concepts first, and more.
April 25, 2024

Zero Basics to Learn K-Line | 5 The Importance of Candlestick Pattern Application
Uptrends and downtrends exist; learn to read price language; buy and sell signals exist; stop trading based on intuition. Part I: Bullish Candlestick Combinations at Key Levels In the previous two chapters of this section, we covered the application of bullish and bearish candlestick combinations. However, these combinations are not effective in every location. In this lesson, we'll explain the importance of where these combinations appear. Where do bullish combinations work best? Scenario 1: In a clear uptrend, approaching a
April 25, 2024


