
Zero to Hero in Candlestick Charts | Part 18: Pennant Patterns — The Smart Money Blueprint (4)
Trends drive price action; learn the language of charts;
Signals guide entries and exits; stop trading on gut feeling.Trading
1. Pennant Patterns
Today we break down a smart money layout pattern — the pennant.
Let's first look at what a pennant looks like and learn how to draw it.
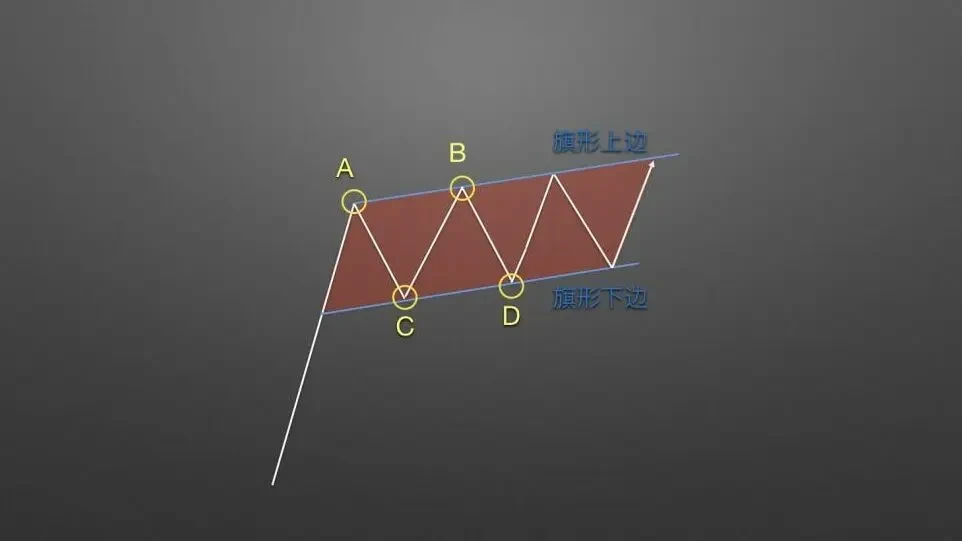
Once the price develops the pattern shown, you can identify points A, B, C, and D in sequence. Draw a line through points A and B to form the upper boundary of the pennant. Draw a line through points C and D to form the lower boundary. As long as subsequent price action remains within these boundaries, the pennant pattern is confirmed as valid.
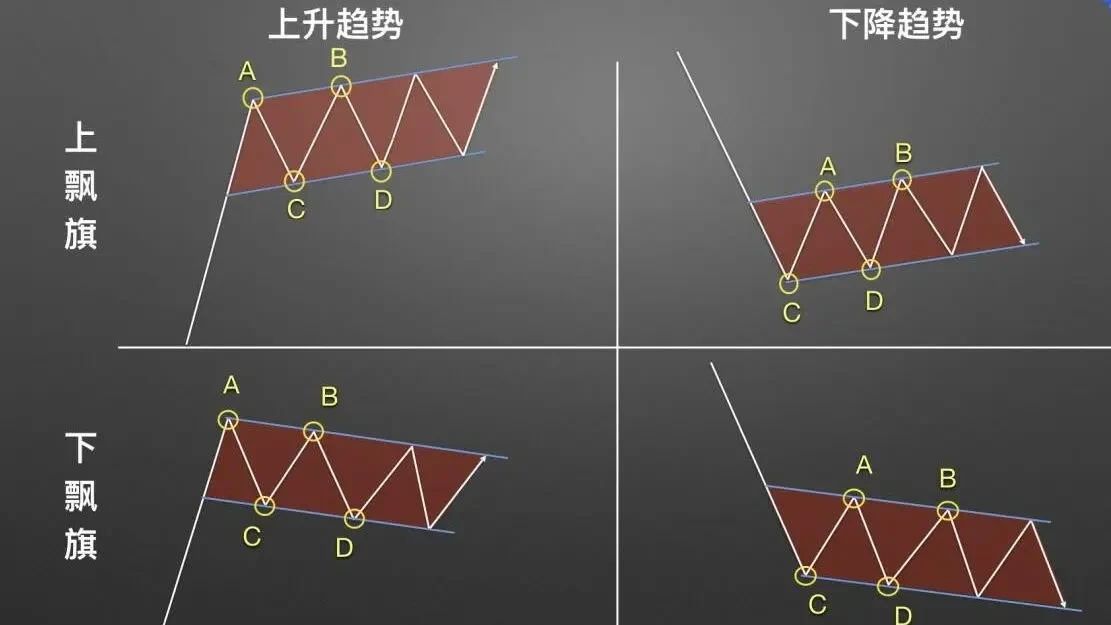
Based on the direction of the pennant slope relative to the prior trend, pennants are classified as upward-sloping or downward-sloping. Based on the trend in which they form, they are classified as bullish trend pennants or bearish trend pennants.
2. Application Rules for Pennant Patterns
Once you've confirmed the pennant type, how do you identify buy and sell timing within the pennant?
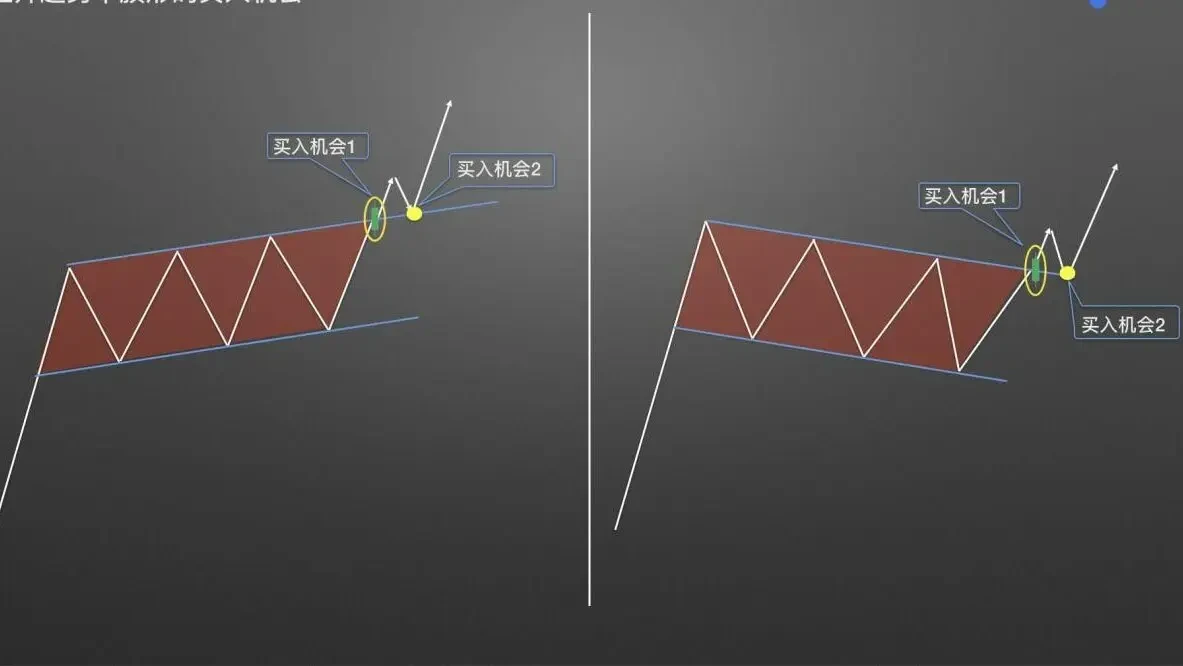
Let's start with long opportunities in an uptrend. As shown, when a green bullishK线 appears near the upper boundary of the pennant, and the candle body closes beyond the upper boundary, it forms a valid resistance breakout — Long Opportunity 1. After price breaks above the upper boundary, the first pullback to test the upper boundary creates Long Opportunity 2.
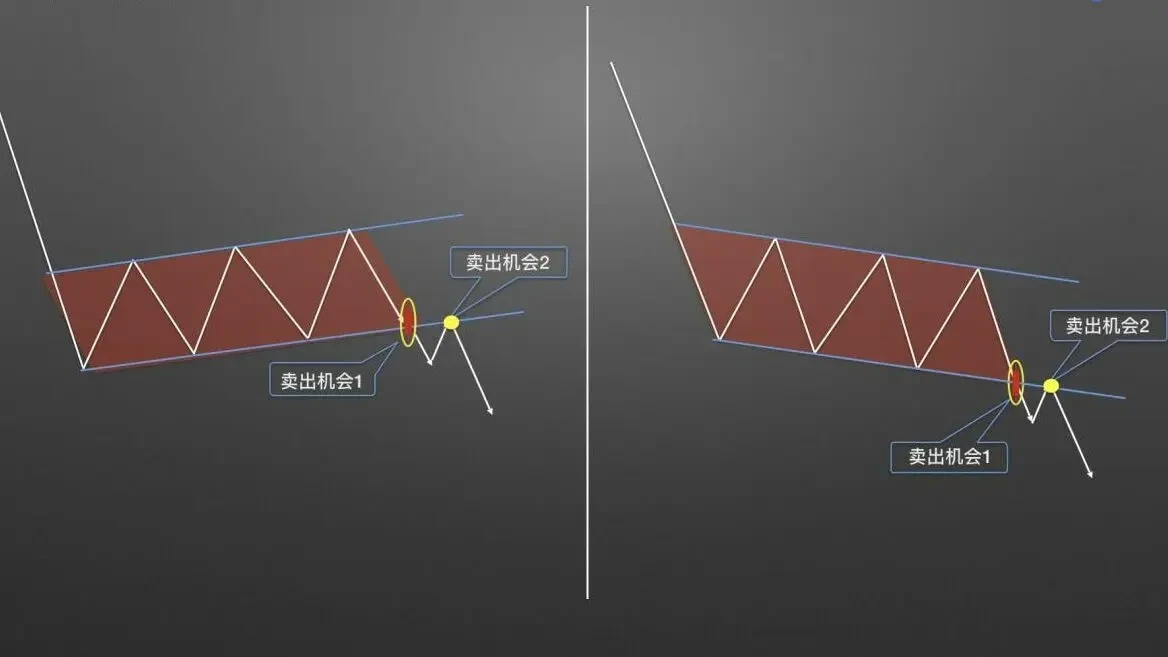
Now let's look at short opportunities in a downtrend. As shown, when a red bearishK线 appears near the lower boundary of the pennant, and the candle body closes below the lower boundary, it forms a valid support breakdown — Short Opportunity 1. After price breaks below the lower boundary, the first retest of the lower boundary creates Short Opportunity 2.
Investing not only requires seizing profit opportunities, but also having the ability to manage risk. Below, we explain the technique for setting stop-loss levels with pennant patterns.

After taking a long position based on the pennant pattern, the stop-loss is recommended to be placed near the horizontal price level of point A, as shown. Point A is the most recent price level where price coincided with the lower boundary of the pennant, occurring before the buy signal.

After taking a short position based on the pennant pattern, the stop-loss is recommended to be placed near the horizontal price level of point A on either side, as shown. Point A is the most recent price level where price coincided with the upper boundary of the pennant, occurring before the sell signal.
Now that you understand the theory, let's look at four real-world case studies.
One example for each pattern type.

Case 1: Downward-sloping pennant in an uptrend. Screenshot from OKX Bitcoin Quarterly Futures 4-hour chart. During an uptrend, a downward-sloping pennant formed. Price eventually broke above the upper boundary of the pennant, creating Buy Opportunity 1, with the stop-loss placed at the most recent horizontal price level that coincided with the lower boundary before the breakout.

Case 2: Upward-sloping pennant in an uptrend. Screenshot from OKX Bitcoin Quarterly Futures 1-hour chart. During an uptrend, an upward-sloping pennant formed. After a prolonged period of consolidation, price finally broke through resistance with a strong bullish candle, breaking the deadlock and resuming the uptrend. Stop-loss price is as shown.
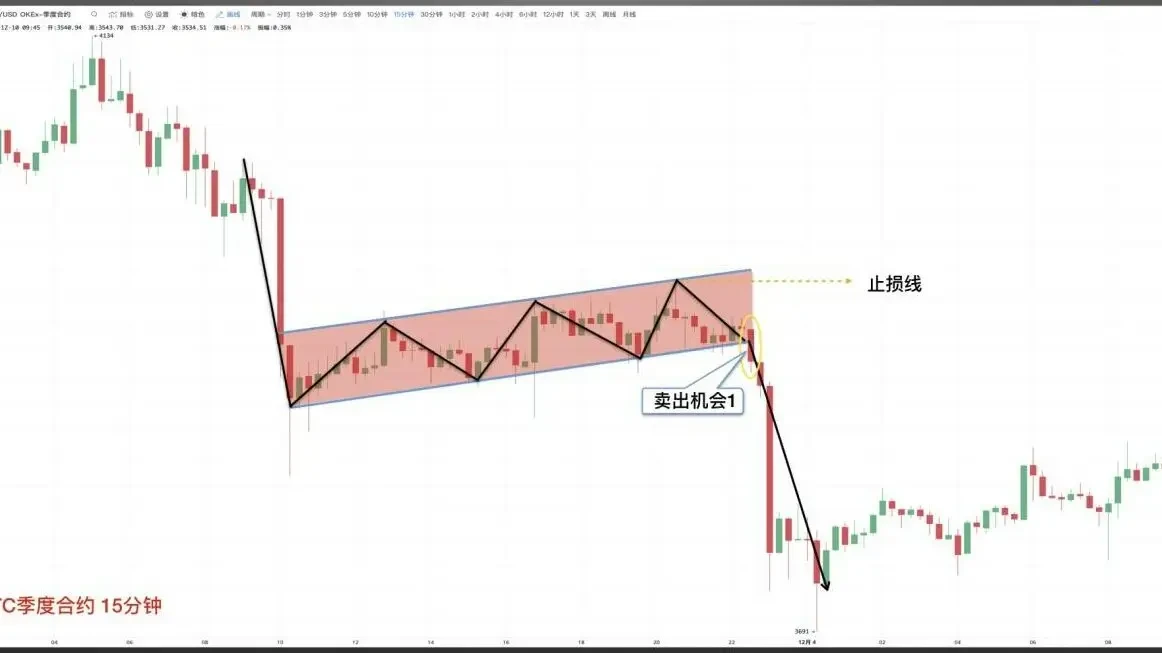
Case 3: Upward-sloping pennant in a downtrend. Screenshot from OKX Bitcoin Quarterly Futures 15-minute chart. During a downtrend, an upward-sloping pennant formed. After a brief period of consolidation, price broke below the lower boundary support, resuming the downtrend.
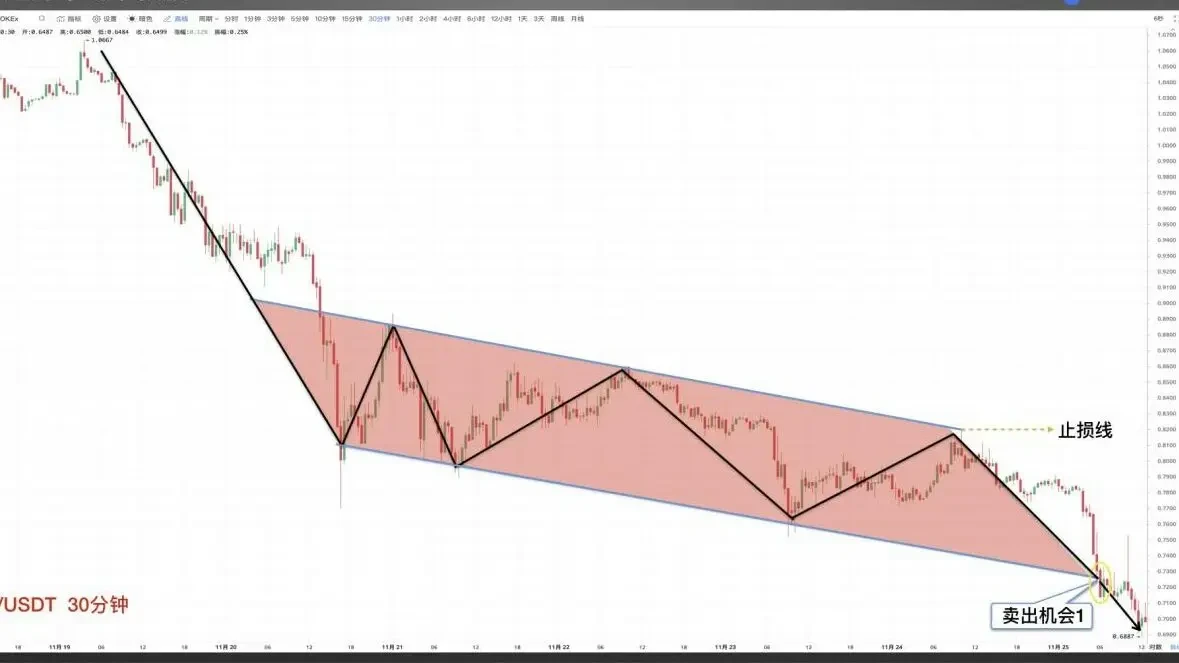
Case 4: Downward-sloping pennant in a downtrend. Screenshot from OKX spot Trading area OKB/USDT 30-minute chart. After a downtrend, price formed a downward-sloping pennant consolidation. Price eventually broke below the lower boundary of the pennant, continuing the original downtrend.
For more tutorials, visit OKX and head to the Beginners Academy.
Disclaimer
This article may contain product-related content not applicable to your region. This article is intended solely to provide general information and makes no representation as to any factual errors or omissions. This article represents the author's personal views only and does not represent the views of OKX. This article is not intended to provide any advice, including but not limited to: (i) investment advice or investment recommendations; (ii) offers or solicitations to buy, sell, or hold digital assets; or (iii) financial, accounting, legal, or tax advice. Holdings in digital assets (including stablecoins) involve a high degree of risk and may fluctuate significantly, or even become worthless. You should carefully consider whether trading or holding digital assets is appropriate for you based on your financial situation. For questions specific to your circumstances, please consult your legal/tax/investment professional. The information contained in this article (including market data and statistics, if applicable) is for general reference purposes only. While we have taken all reasonable precautions in preparing such data and charts, we accept no responsibility for any factual errors or omissions expressed herein. © 2025 OKX. This article may be reproduced or distributed in its entirety, or excerpted in passages of 100 words or less, provided that such use is non-commercial in nature. Any reproduction or distribution of the full article must also prominently state: "This article is copyrighted © 2025 OKX, used under permission." Permitted excerpts must cite the article title and include attribution, for example "Article Title, [Author Name (if applicable)], © 2025 OKX." Some content may have been generated or assisted by artificial intelligence (AI) tools. Derivative works and other uses of this article are not permitted.
Show More
Recommended Reading

Can You Profit from Bitcoin Declines? How to Trade Futures Contracts
As the cryptocurrency market, led by Bitcoin, continues to expand in scale, derivative trading has gradually emerged in various forms beyond spot trading, serving as a risk-hedging tool. Among these, futures trading has attracted the most attention. What is futures trading? Futures are the most common form of trading contract in the cryptocurrency derivatives market. Digital asset futures trading refers to an agreement between buyers and sellers to trade a specific asset at a predetermined price at a future date.
January 16, 2026

Simpler Than Copying Strategies? One-Click Copy the Top Traders on OKX — Let Them Earn for You
Whether in traditional finance or the cryptocurrency market, strategy trading is a critical and essential method within the trading system. When facing complex trading environments and extreme market conditions, even traders with solid theoretical knowledge and extensive experience can easily miss trading opportunities or make poor decisions driven by emotions. Strategy trading is precisely an effective tool to address these challenges. Now that you have the trading tools, how do you put them to use?
November 21, 2025

Part 5: Strategic Trading Series — DCA Bot
Preface: We often wonder: during a bull market, there are many digital assets that surge dramatically. If you could consistently capture assets with large gains — for example, catching one that doubles every month — your holdings would grow to 2 to the 12th power, or 4,096 times, after a year. That's an astonishing figure, though of course it's nearly impossible to achieve, because it's extremely difficult to consistently catch assets that skyrocket. This is a common challenge many users face: during a bull market, although there are plenty of opportunities,
November 3, 2025

Which Countries/Regions Do Not Support OKX Registration
OKX currently does not provide services to customers from the following regions: certain US territories such as New York, Texas, Puerto Rico, American Samoa, Guam, the Northern Mariana Islands, the US Virgin Islands (St. Croix, St. John, and St. Thomas), Cuba, Iran, North Korea, Crimea, Malaysia, Syria, Bangladesh, and Bolivia. For details, please refer to the OKX Terms of Service.
April 25, 2024

Quick Guide to OKX Products and Features
OKX (www. okx. com) is one of the world's leading digital asset service platforms, primarily serving global users with spot and derivatives trading services for Bitcoin, Ethereum, and other digital assets, while also exploring the world of DeFi, dApps, NFTs, and GameFi alongside its users. On OKX, you can enjoy seamless spot and futures trading experiences, stay updated on tokens from trending sectors and concepts, and much more.
April 25, 2024

Zero to Hero in Candlestick Charts | Part 5: The Importance of Candlestick Combo Patterns
Trends drive price action; learn the language of charts; signals guide entries and exits; stop trading on gut feeling. 1. Bullish Candlestick Combos at Key Levels In the first two installments of this chapter, we covered bullish and bearish candlestick combos. However, these combos aren't effective in every situation. In this section, we'll explain why the placement of these combos matters. Where do bullish combos work best? Scenario 1: During a clearly defined uptrend, near the previous
April 25, 2024


