
Learn K-Line from Zero | 19 Common Analysis Indicators 1 - Moving Average (MA)
Rises and falls follow trends; understand the language of prices;
Buy and sell with signals; say goodbye to intuitive Trading.
Welcome to the Indicators chapter of the "Learn Crypto Market Analysis from Zero" series. The course is regularly updated in the OKX Beginner Academy.
I. What is a Moving Average (MA)
This section covers one of the most common technical indicators: the Moving Average,简称均线 or MA for short.
First, let's look at how a moving average is formed.
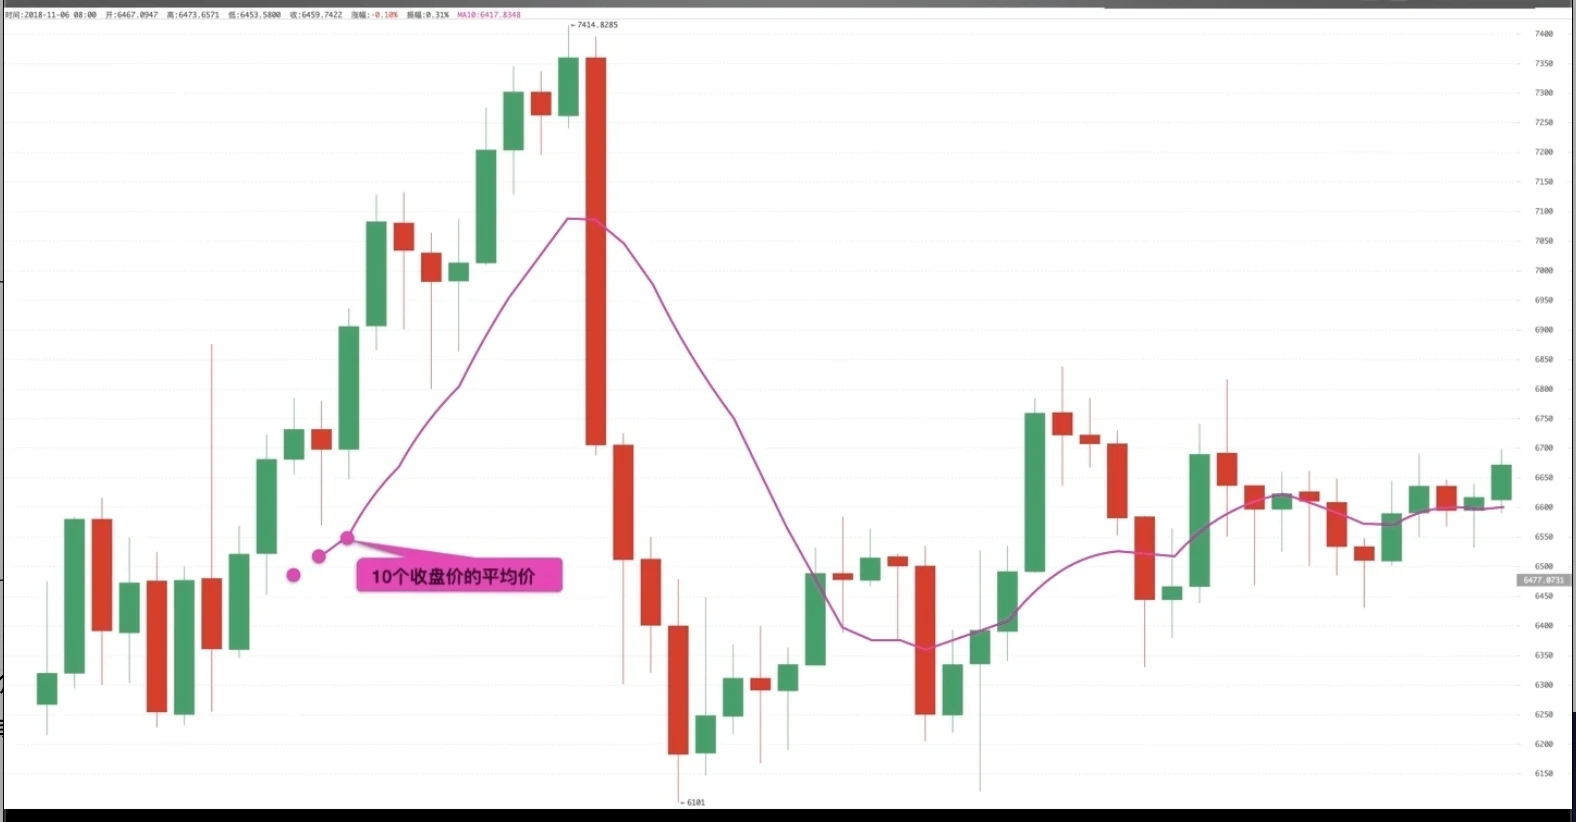
The moving average is a curve formed by adding up prices over a period (usually closing prices), calculating the average, and then connecting the points corresponding to each average. Thus, the formation process of a 10-day average line for a coin is as follows: add the closing prices of ten consecutive K-lines, divide by 10, and from the 10th K-line onwards you get many points - the average prices. Finally, connecting these points forms the 10-period Moving Average - MA10.
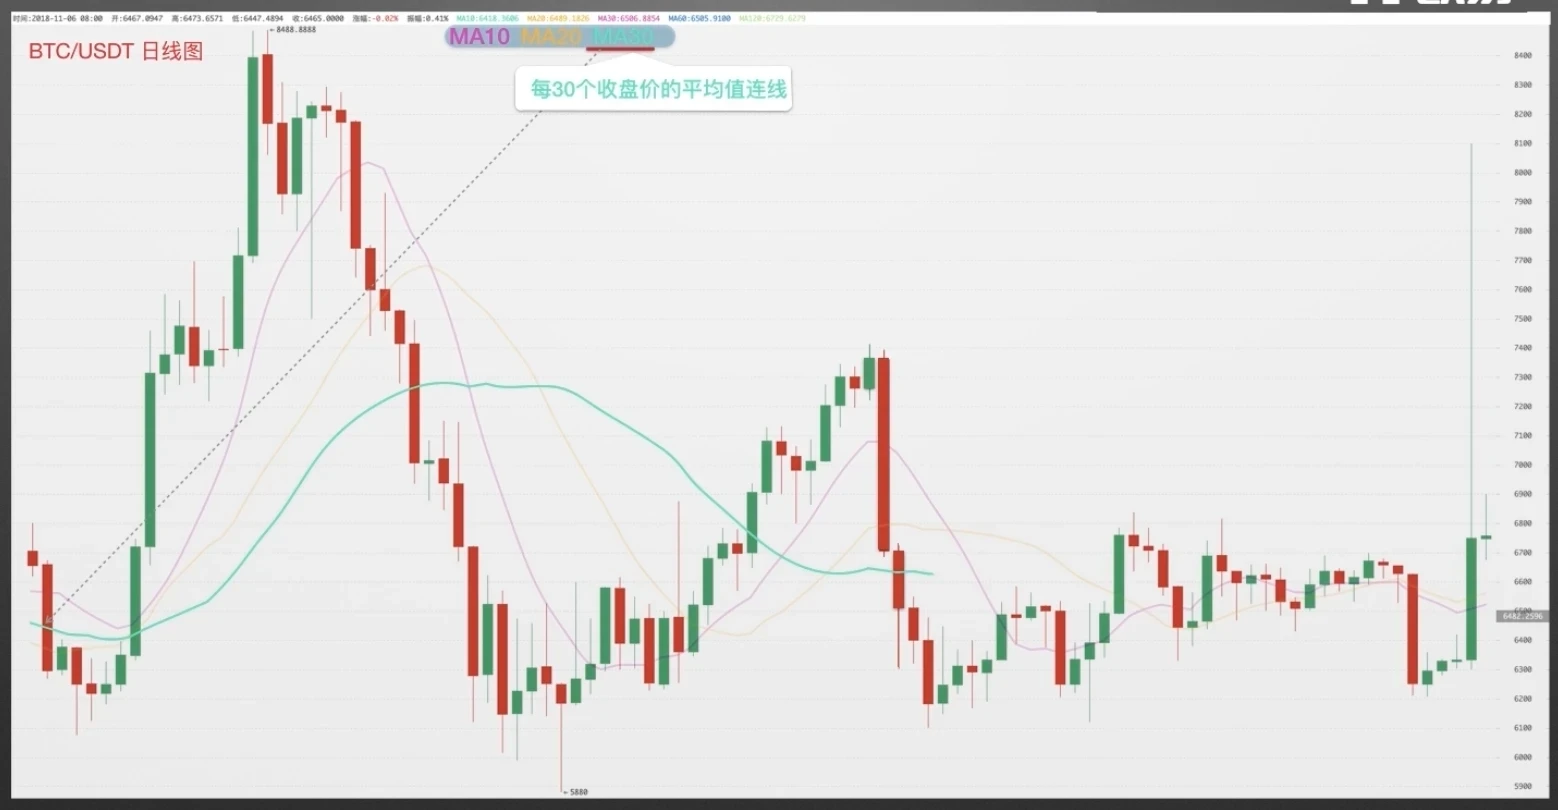
Understanding the formation process of MA10 means you understand how all other period MAs are formed, such as MA20, MA30, etc. Taking the daily chart as an example, MA10 represents the line of average values of every 10 closings. MA20 represents the line of average values of every 20 closings. MA30 represents the line of average values of every 30 closings.
When watching various experts analyze market trends, you must have heard many impressive terms, such as golden cross, death cross, deviation, and the like. What do these names mean? Let's understand them through diagrams.
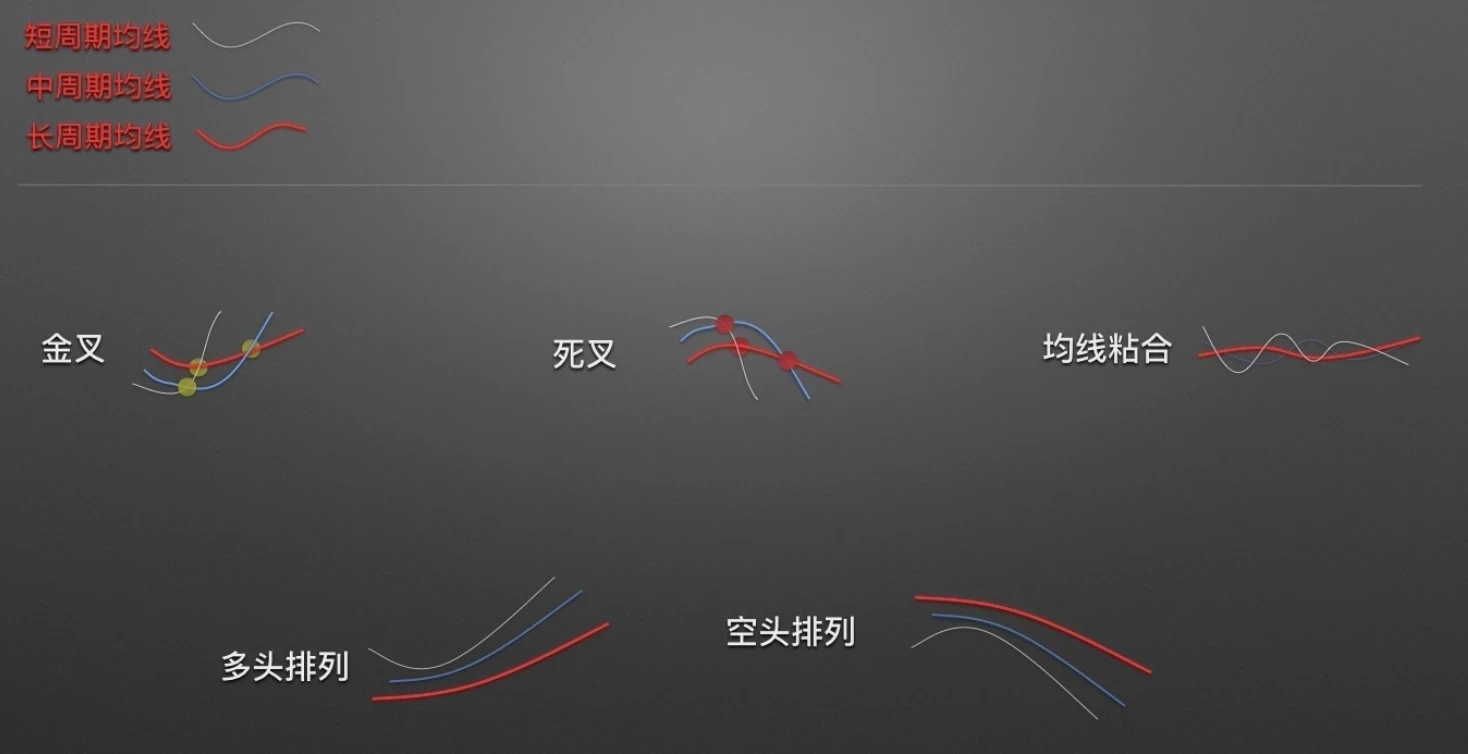
When a relatively short-period MA crosses from below through a relatively long-period MA, the intersection formed is called a golden cross. Prerequisite: both intersecting MAs must be in a flat or upward state. When a relatively short-period MA crosses from above through a longer-period MA, the intersection formed is called a death cross. Prerequisite: both intersecting MAs must be in a flat or downward state.
When two or more MAs repeatedly intertwine without obvious directional movement, this phenomenon is called MA convergence.
When short-, medium-, and long-period MAs are arranged sequentially from top to bottom, all moving upward simultaneously, this phenomenon is called a bullish arrangement.
When long-, medium-, and short-period MAs are arranged sequentially from top to bottom, all moving downward simultaneously, this phenomenon is called a bearish arrangement.
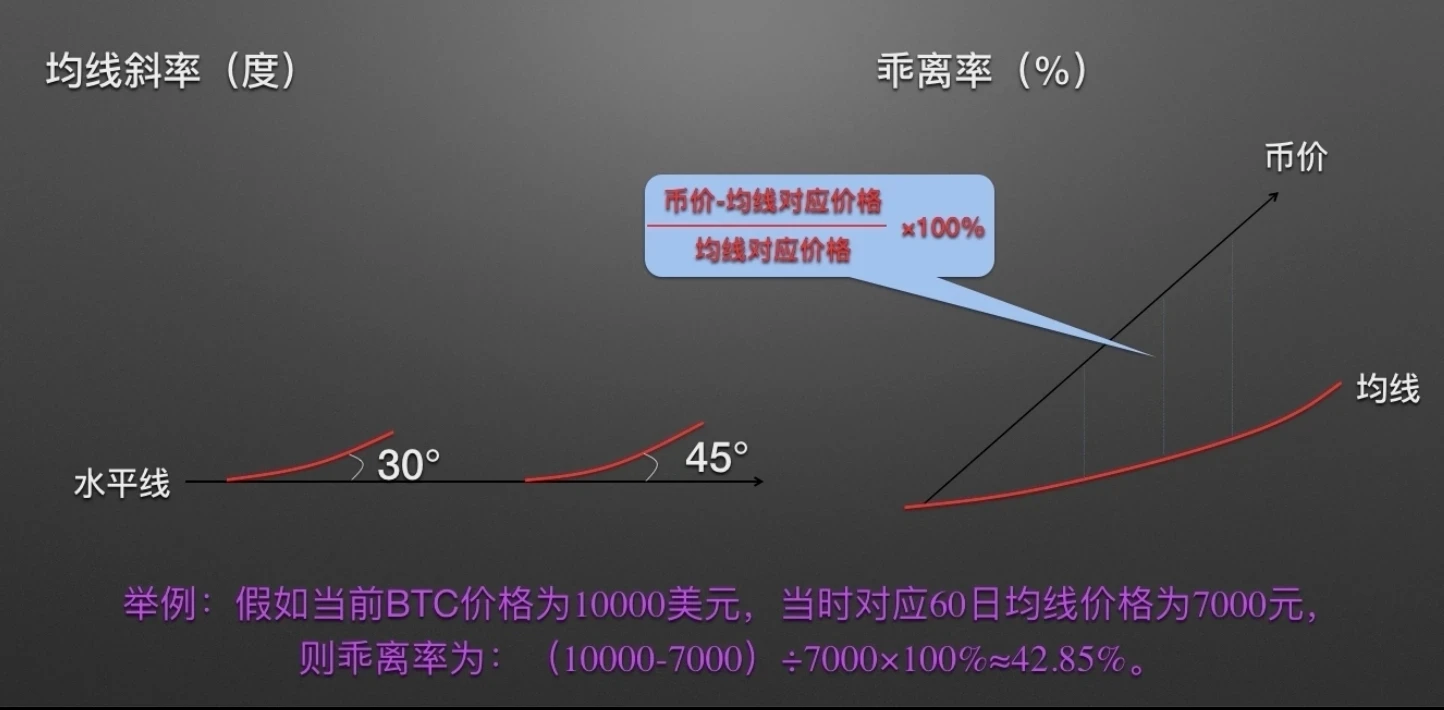
The degree of the angle formed between a given MA and a horizontal line is called the slope of that MA. Usually, when in the 30 to 45 degree range, trend continuation is better. The difference between the coin price and the corresponding MA price, divided by the MA price, multiplied by 100%, gives the deviation rate for that MA's corresponding period.
Example: If the current BTC price is $10,000 and the corresponding 60-day MA price is 7,000, then (10,000-7,000) ÷ 7,000 × 100% ≈ 42.85%.
What do these terms look like in actual market movements?
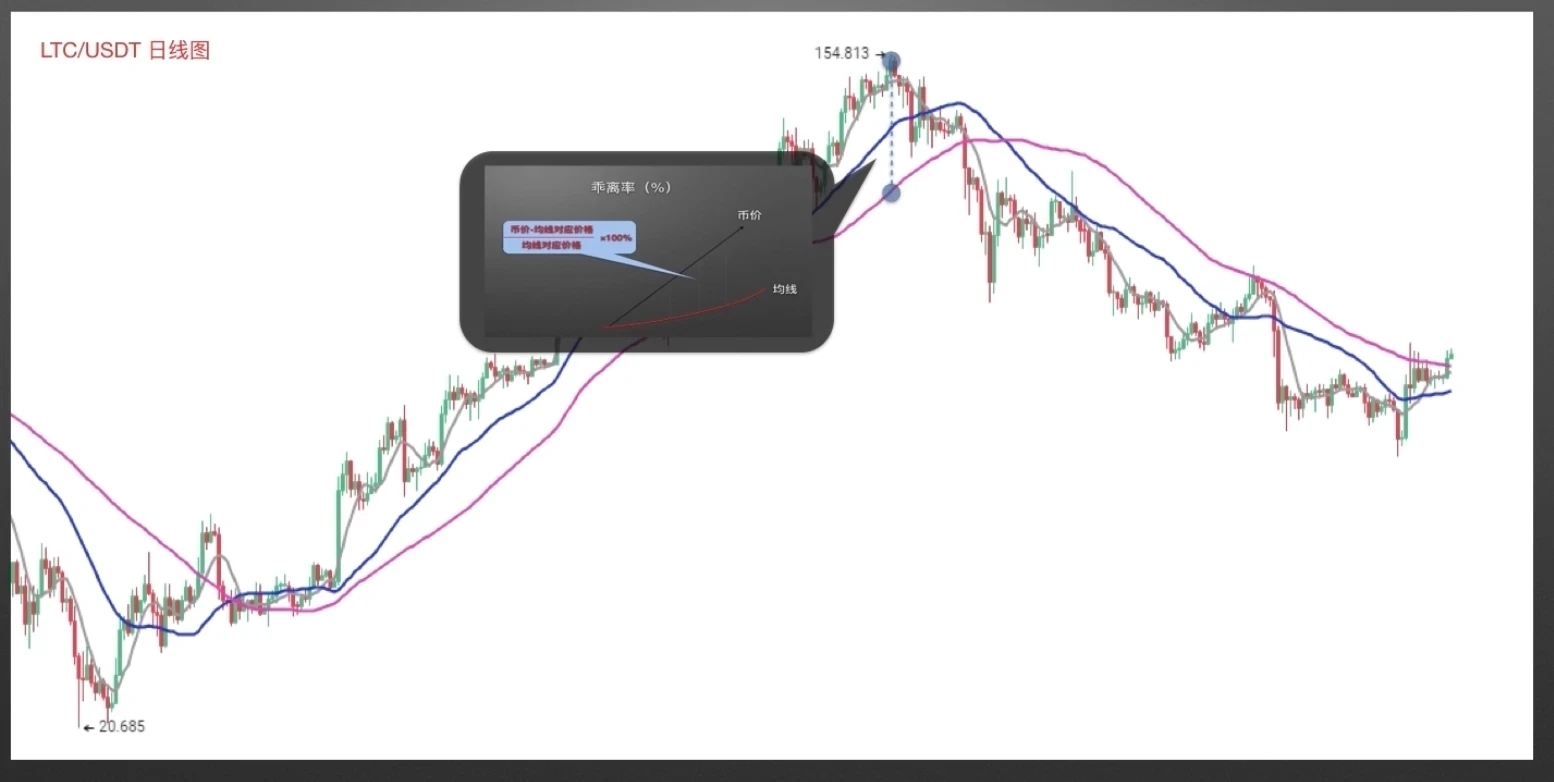
Screenshot from OKX LTC/USDT daily chart. After golden crosses appeared at lows and during the rise, the price showed significant increases. Shortly after peaking, death crosses appeared continuously, followed by significant price declines. Before a market trend erupts, MAs usually show convergence. Bullish arrangements usually occur mid-uptrend; bearish arrangements usually occur mid-downtrend. When the slope is around 45 degrees, the probability of the price continuing the trend is higher. The greater the deviation rate between the price and the corresponding MA, the higher the probability of a reversal.
II. How to Use Moving Averages
1) Granville's MA Rules
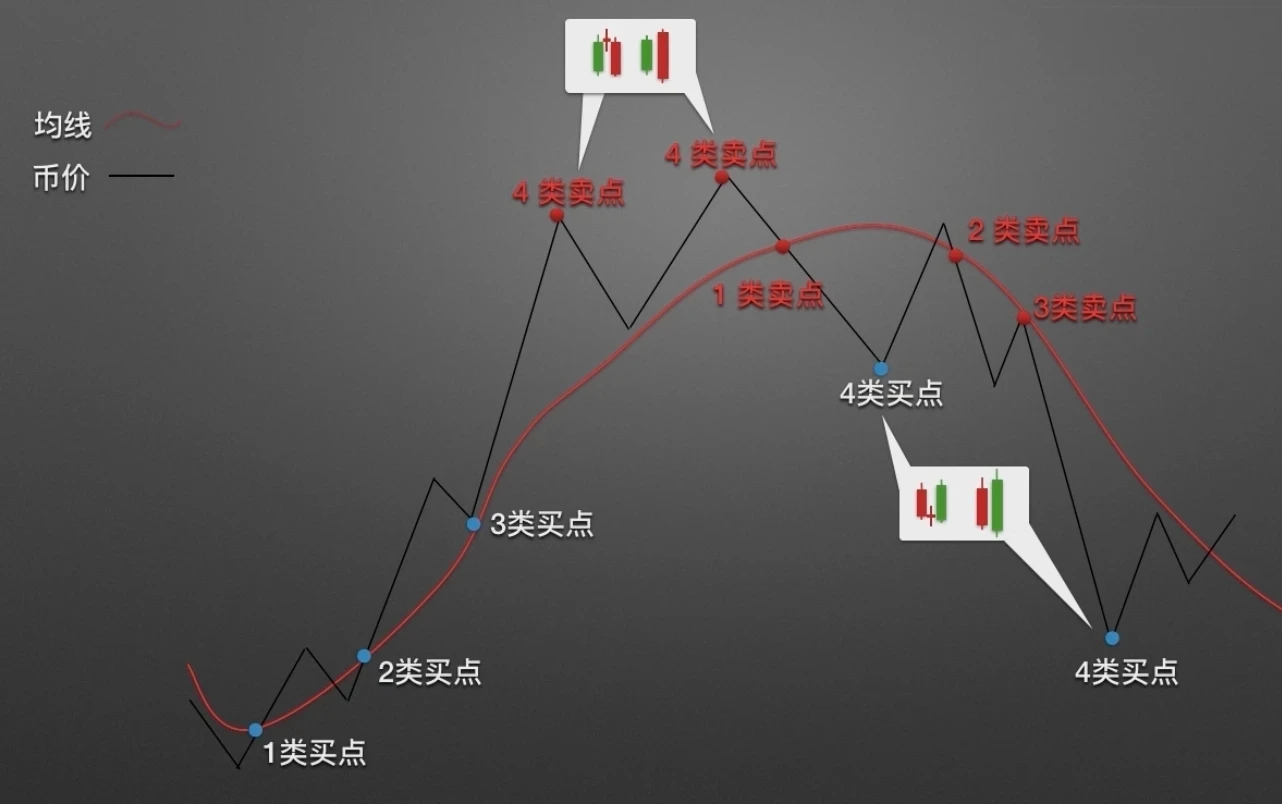
Granville's MA Rules are one of the more frequently used methods. This rule provides eight types of buy and sell signals in total, so it's also commonly called Granville's Eight Rules. When price crosses the MA from below for the first time, the 1st type buy signal forms. When price breaks below the MA during a rise, then breaks above the MA again, the 2nd type buy signal forms. When price falls from above the MA toward the MA, touches the MA, and stops falling and rises, the 3rd type buy signal forms. When price moves downward away from the MA and appears with bullish engulfing, morning star, or other bullish K-line combinations, the 4th type buy signal forms.
The above are the 4 types of buy signals, plus corresponding 4 types of sell signals. When price breaks below the MA from above for the first time after a significant rise, the 1st type sell signal forms. When price breaks above the MA during a decline, then breaks below the MA again, the 2nd type sell signal forms. When price rallies from below the MA toward the MA, touches the MA, stops rising and falls, the 3rd type sell signal forms. When price moves upward away from the MA and appears with bearish engulfing, evening star, or other bearish K-line combinations, the 4th type sell signal forms.
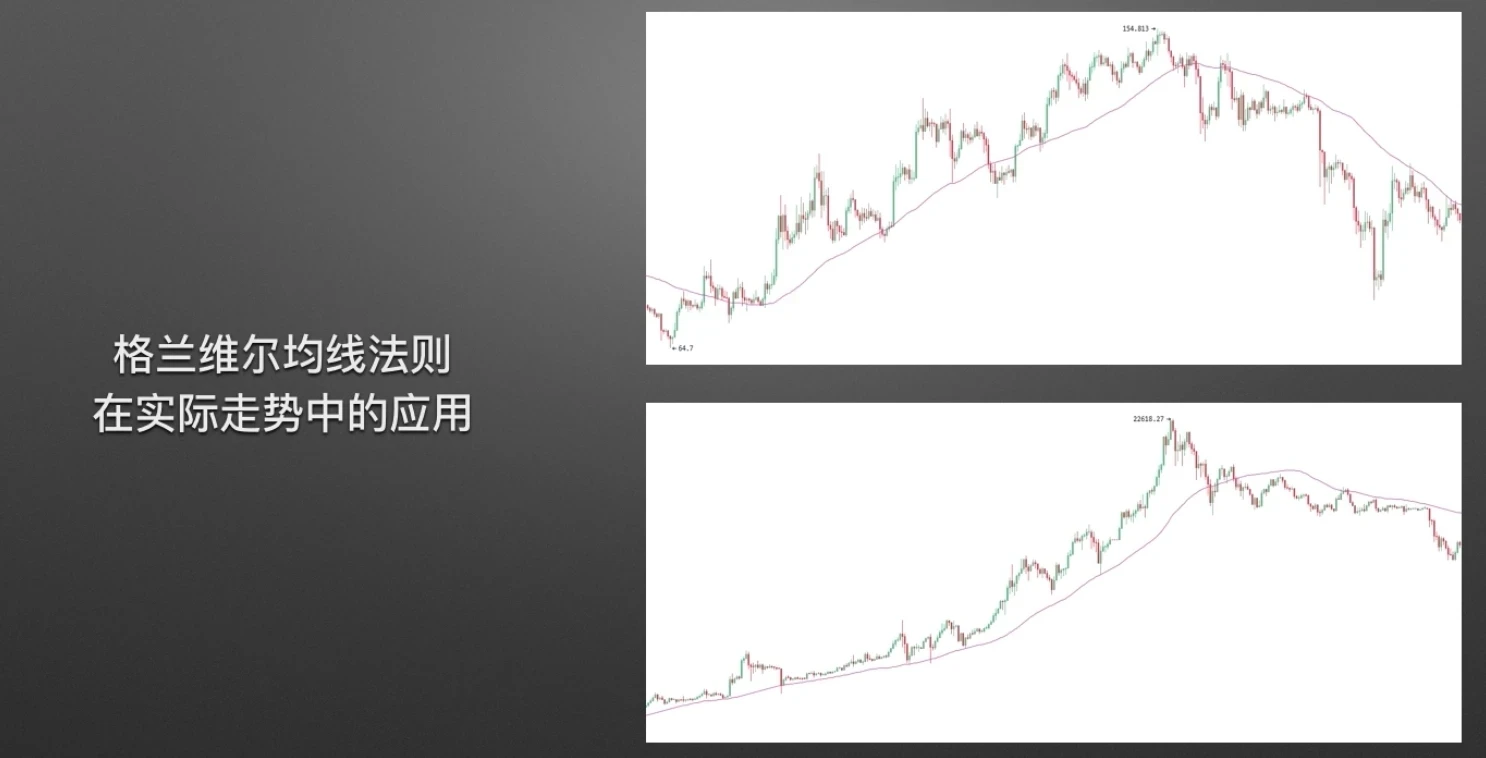
Application of Granville's MA Rules in actual market movements.
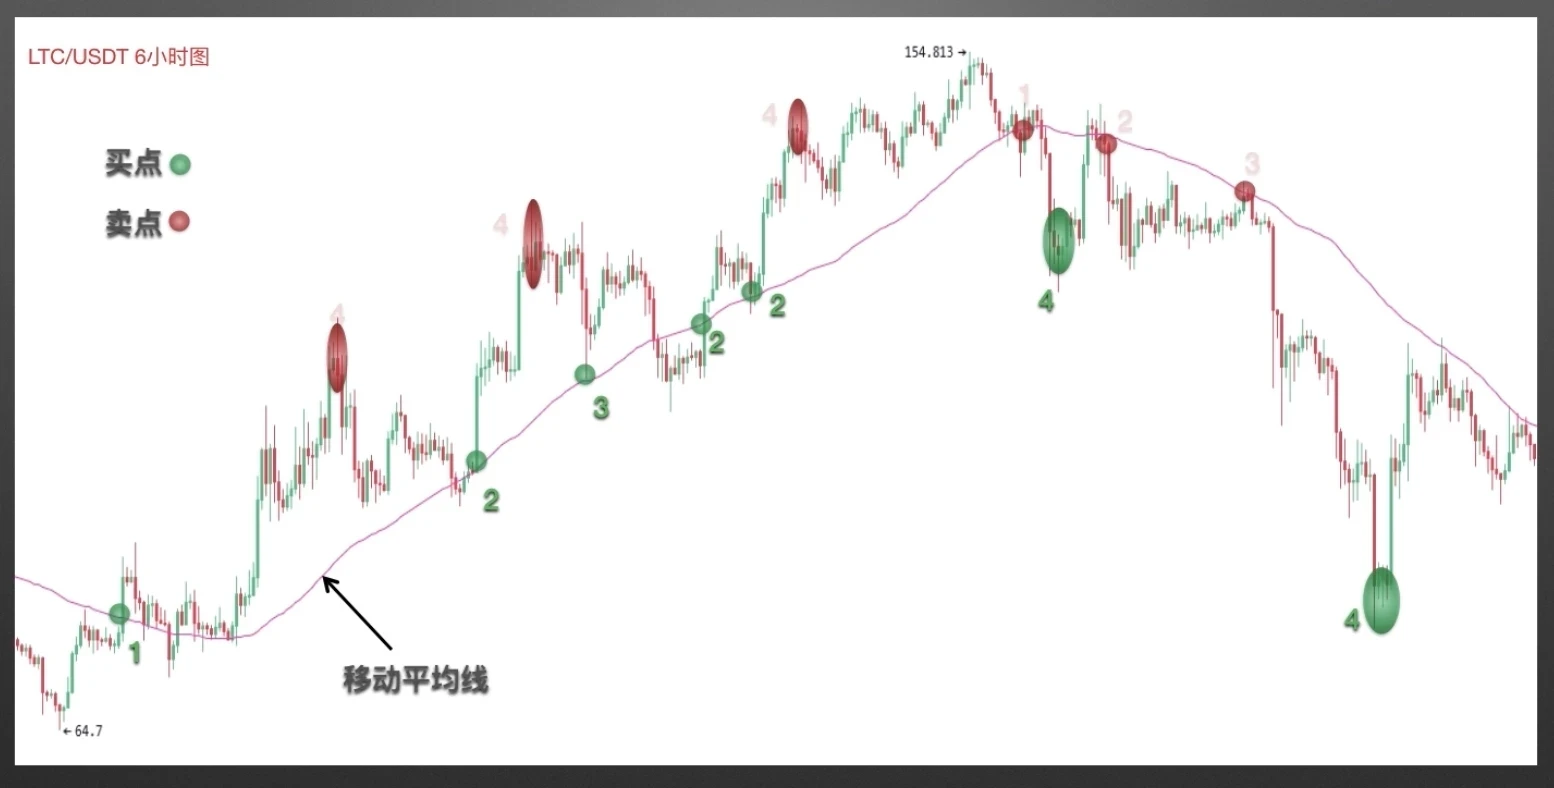
Case 1 screenshot from OKX, LTC/USDT 6-hour chart. After various types of buy signals appeared, the price showed varying degrees of increase. The 2nd and 3rd type buy signals offer higher safety and are more practical. Among various sell signal types, the 2nd and 3rd type sell signals are also best.
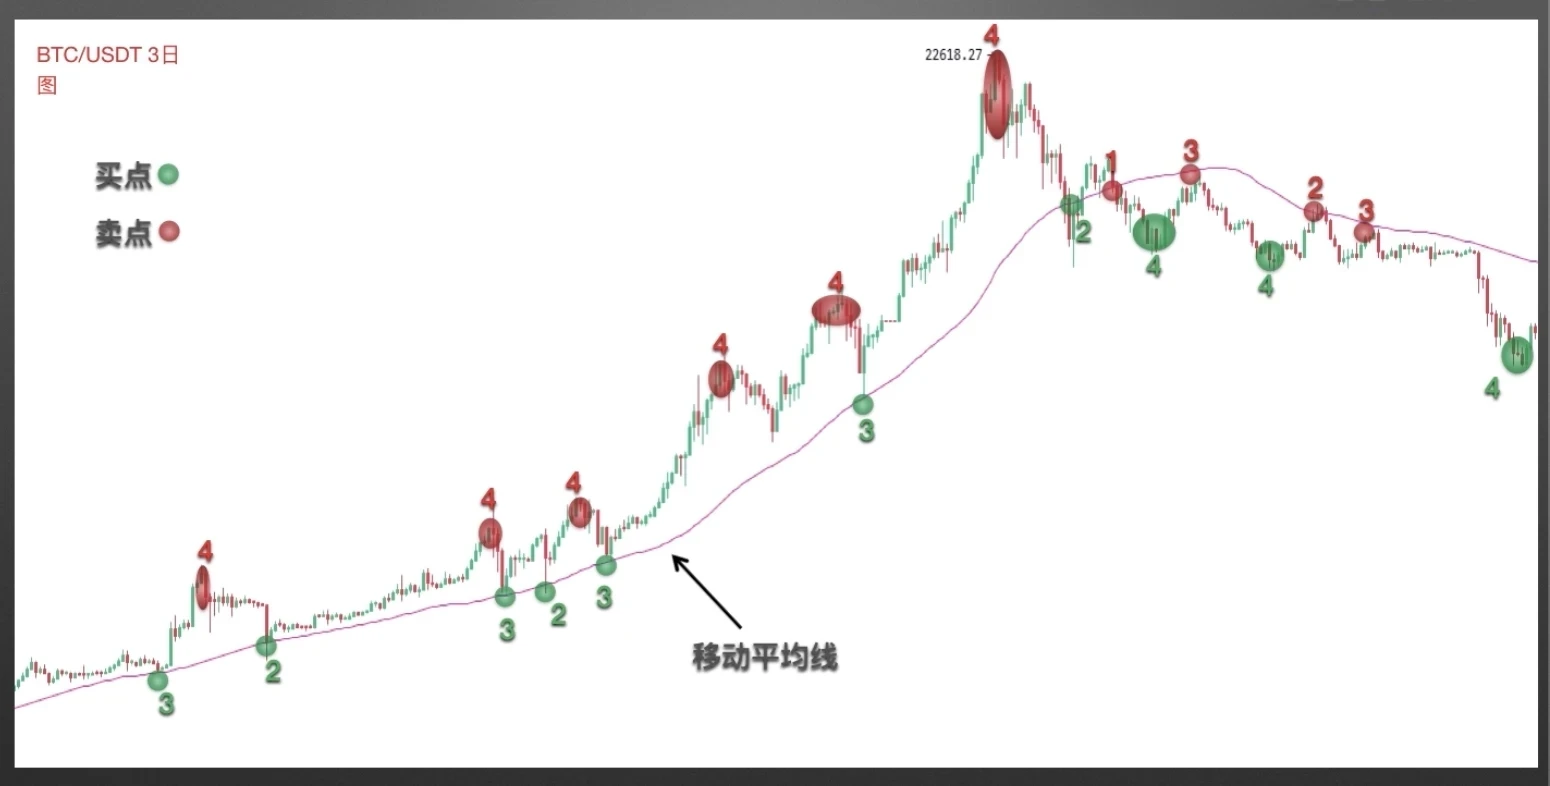
Case 2 screenshot from OKX, BTC/USDT 3-day chart. The MA parameter is 180. In the major bull market that began in 2015, this MA played a very important support role. During the rise, the MA multiple times provided 2nd and 3rd type buy signal prompts at pullback lows. After 2018, it multiple times gave sell prompts at rebound highs.
2) Dual MA Combination Usage
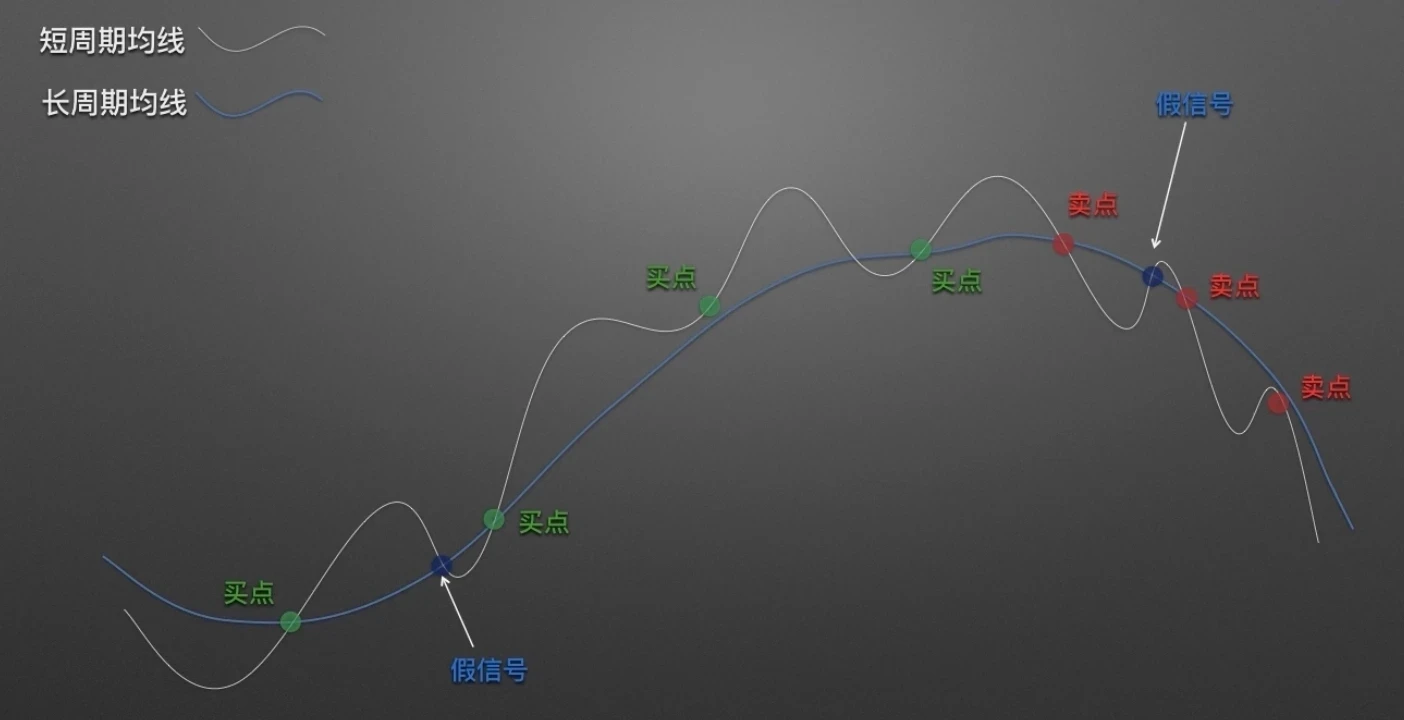
First, set two MAs: one short-period and one relatively long-period. For example, MA10 and MA20, or MA10 and MA30, etc., to suit your Trading style as much as possible. When the short MA crosses above the long MA, and the long MA is flat or rising; when the short MA breaks below the long MA then quickly breaks above again; when the short MA pulls back near the long MA then turns up again - all are good buying opportunities.
When the short MA crosses below the long MA, and the long MA is flat or falling; when the short MA breaks above the long MA then quickly breaks below again; when the short MA rallies near the long MA then turns down again - all are good selling opportunities. When the long MA is upward and the short MA crosses below, or when the long MA is downward and the short MA crosses above, both are false signals and not used as trading signals.
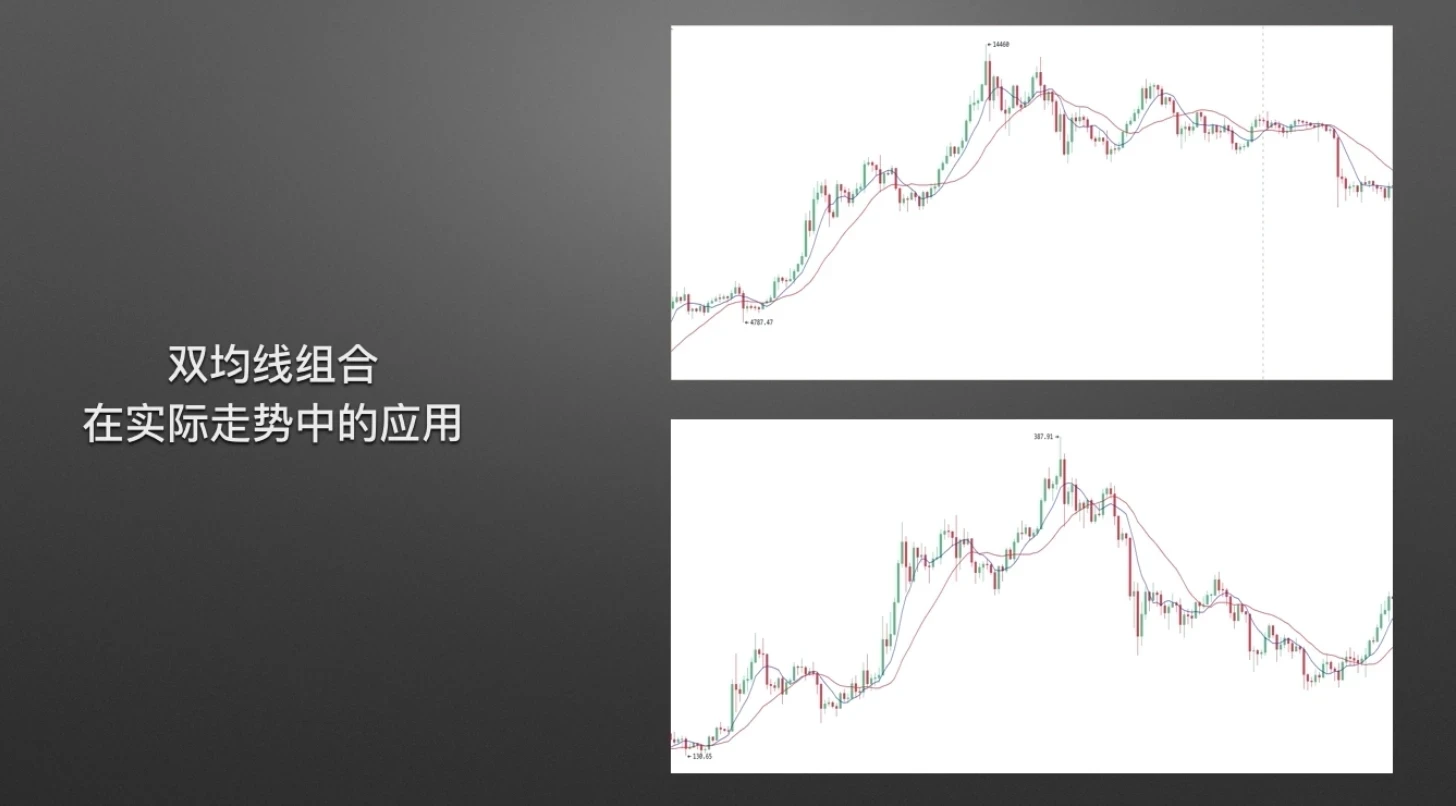
Let's look at a set of dual MA combination application cases.
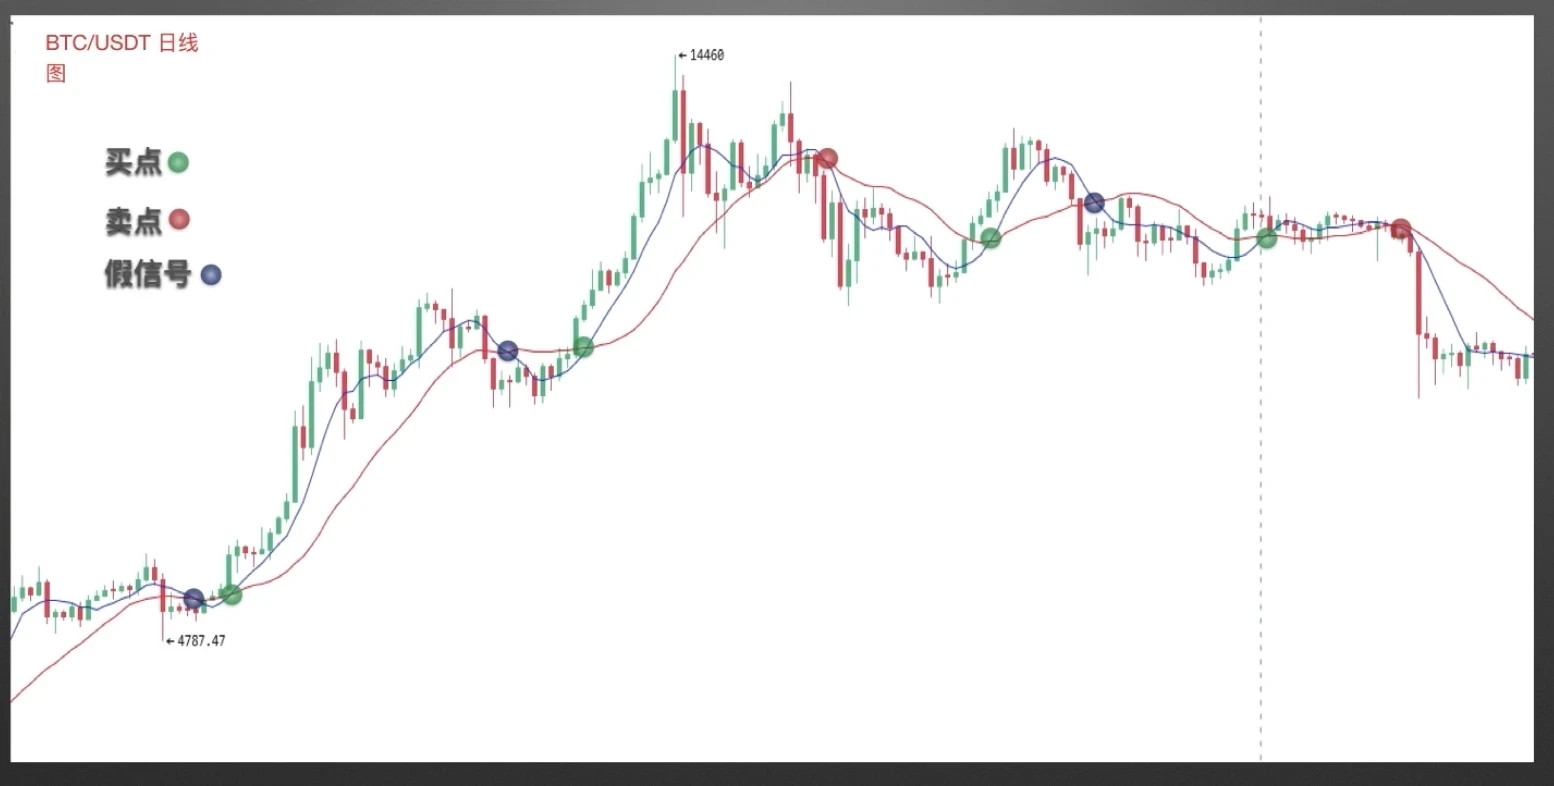
Case 1 screenshot from OKX, BTC/USDT daily chart. After most buy signals formed, the price showed significant increases. After sell signals appeared, there were significant declines. False signals can be ignored.
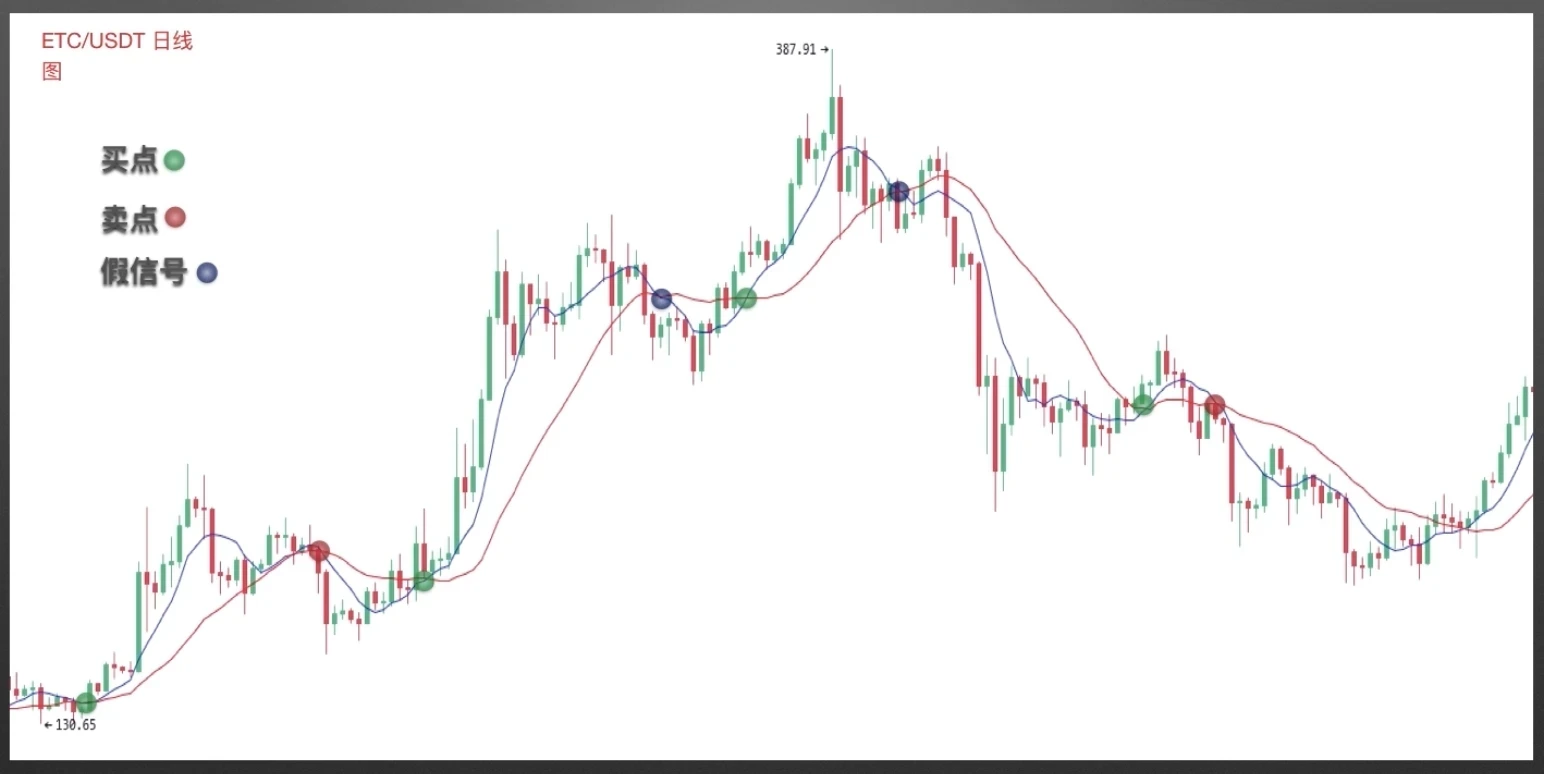
Case 2 screenshot from OKX, ETC/USDT daily chart. The dual MA combination also helped us find many quality buy and sell signals.
3) Triple MA Combination Usage
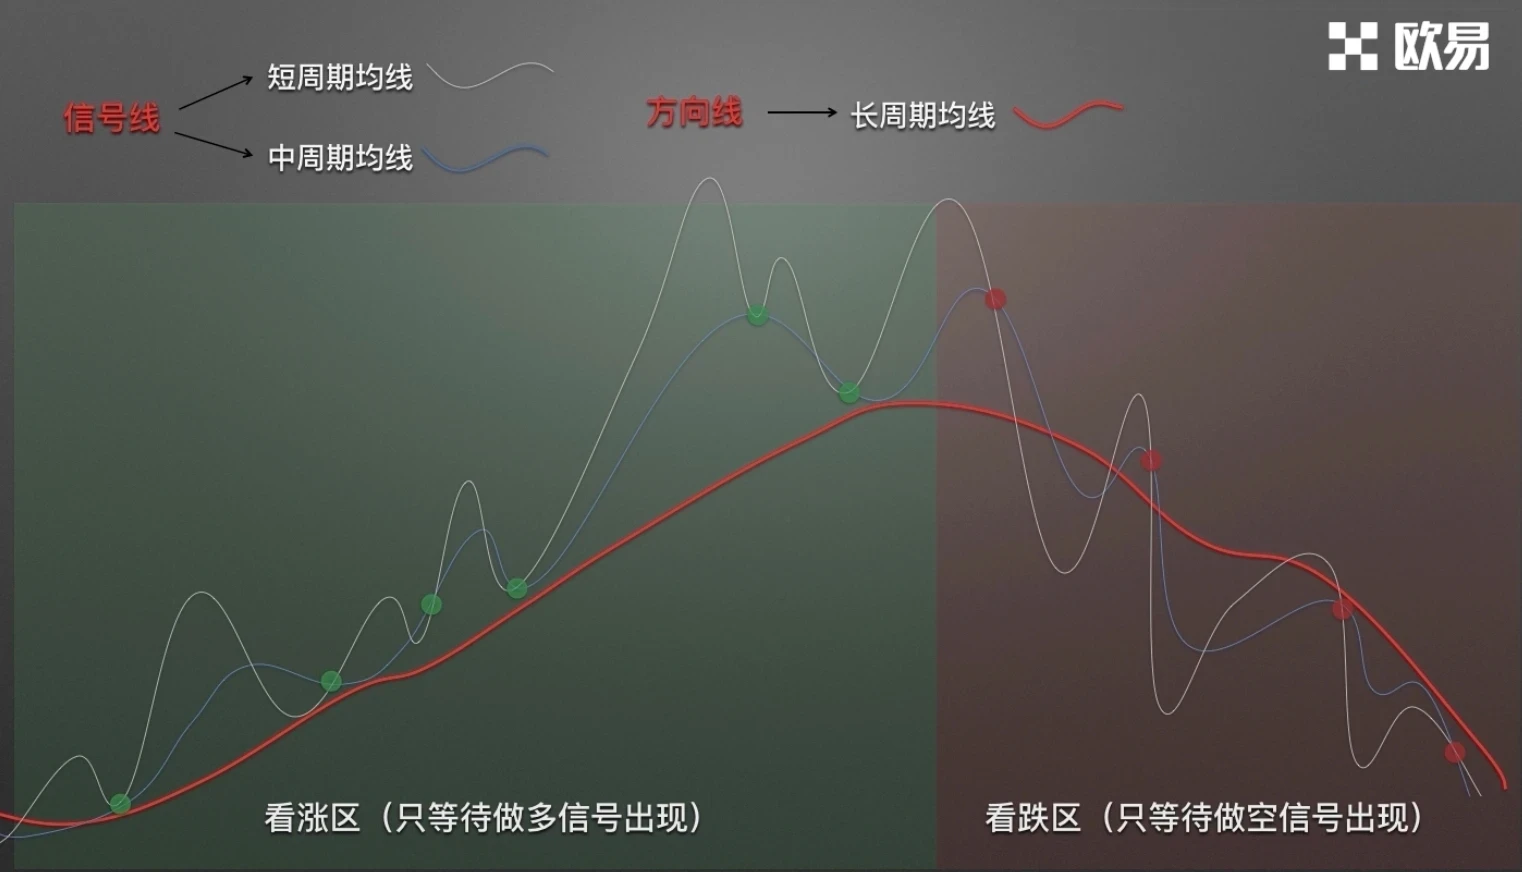
Obviously, this combination contains three MAs: relatively short and medium period MAs serve as Trading signal lines, while the long MA serves as a direction line to judge market trend. When the long MA is upward, it's a bullish zone - only wait for long signals to appear before Trading. When the long MA is downward, it's a bearish zone - only wait for short signals to appear before Trading.
In the bullish zone, as long as the short MA crosses above the medium MA, you can go long - it doesn't need to be a standard golden cross. Skip short opportunities at death crosses. In the bearish zone, as long as the short MA crosses below the medium MA, you can go short - it doesn't need to be a standard death cross. Skip long opportunities at golden crosses.
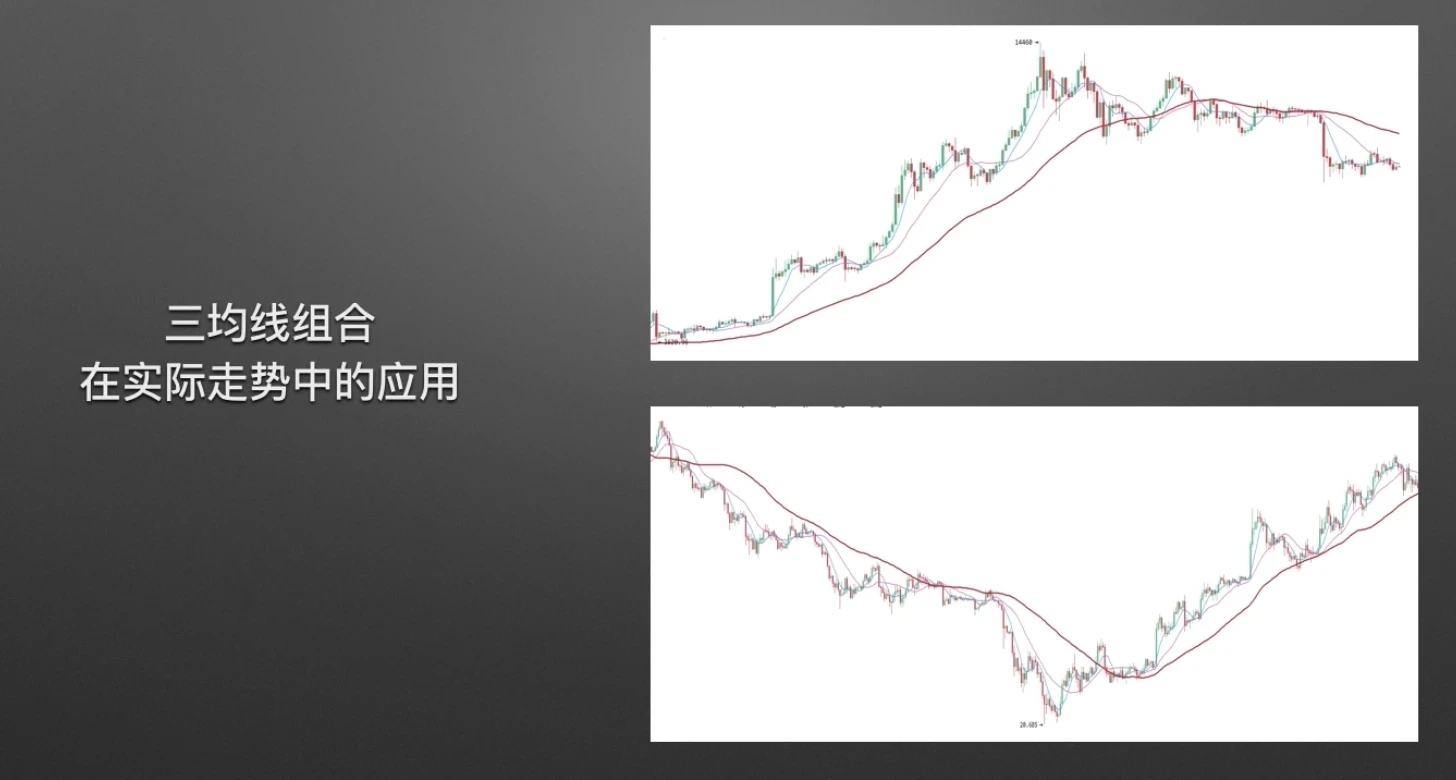
Let's look at a set of triple MA combination application cases.
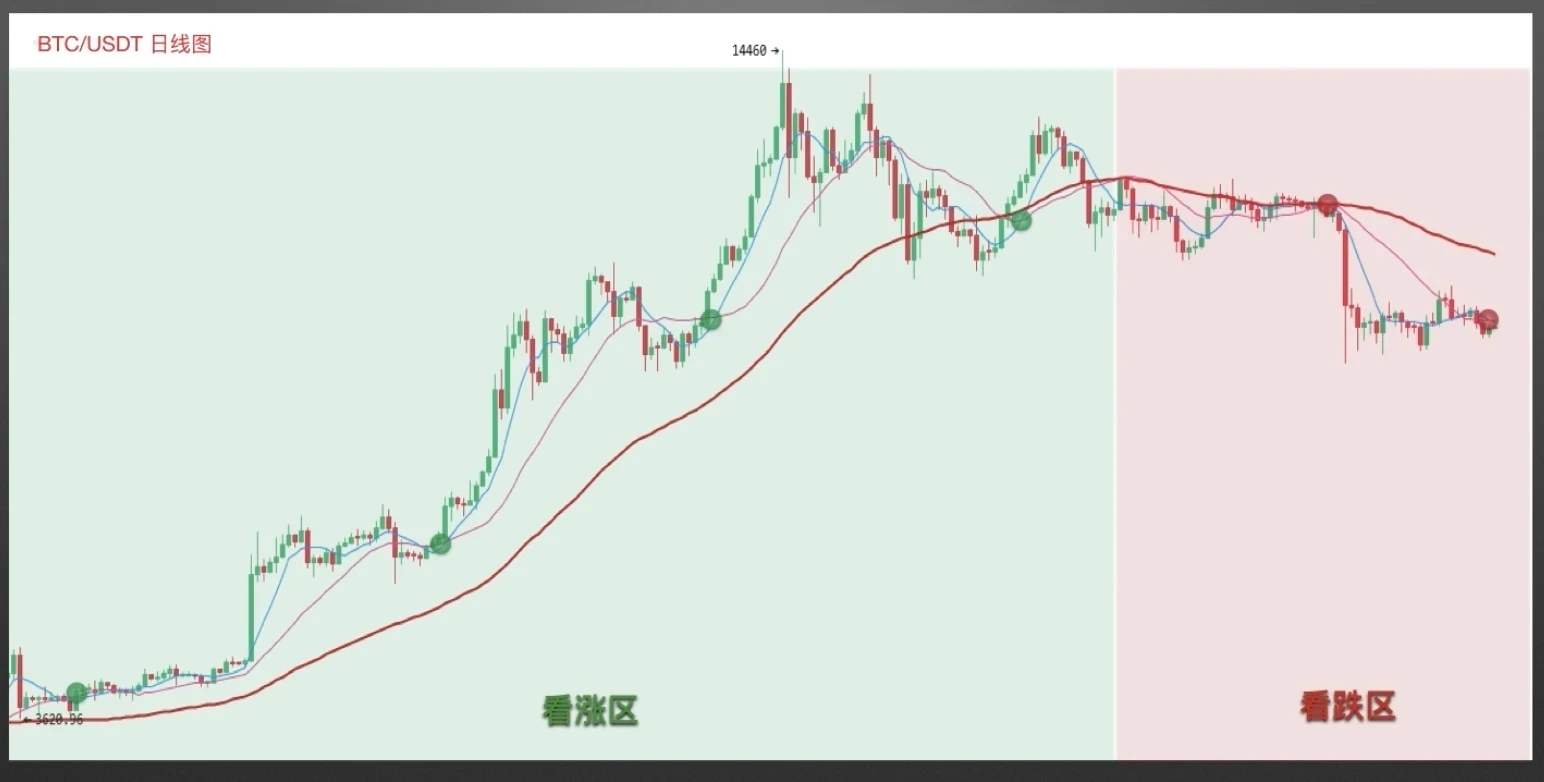
Case 1 screenshot from OKX, BTC/USDT daily chart. When the long MA moved upward, although there were multiple adjustments of varying sizes mid-way, the price overall maintained an upward trend. At this time, the short MA crossing above the medium MA provided many quality buy signals. When the long MA turned to downward movement, although there were multiple rallies mid-way, the overall direction remained downward. At this time, the short MA crossing below the medium MA provided many quality sell signals.
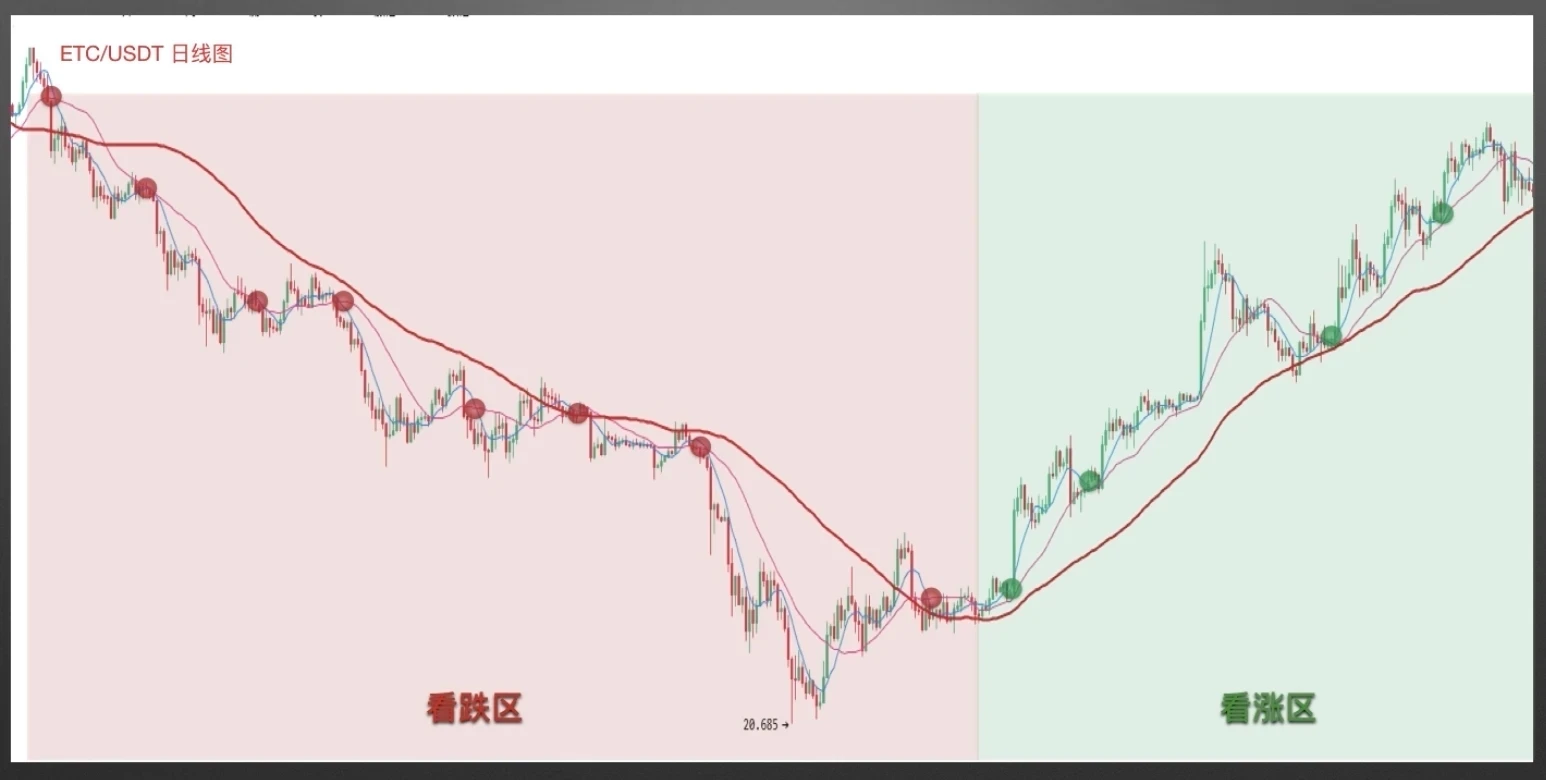
Case 2 screenshot from OKX, ETC/USDT daily chart. In the bearish zone, the short MA crossing below the medium MA almost always occurred at the beginning of a significant decline. Trading based on this undoubtedly helped us avoid much risk. After the bullish zone formed, the triple MA combination also helped us capture many buying opportunities.
Disclaimer
This article may contain product-related content not applicable to your region. This article is intended to provide general information only and assumes no responsibility for any factual errors or omissions herein. This article represents only the author's personal views and does not represent the views of OKX. This article is not intended to provide any of the following advice, including but not limited to: (i) investment advice or investment recommendations; (ii) offers or solicitations to buy, sell, or hold digital assets; or (iii) financial, accounting, legal, or tax advice. Holding digital assets (including stablecoins) involves high risk, may fluctuate significantly, and may even become worthless. You should carefully consider whether Trading or holding digital assets is suitable for you based on your financial situation. For questions about your specific situation, please consult your legal/tax/investment professional. The information appearing in this article (including market data and statistics, if any) is for general reference only. Although we have taken all reasonable precautions in preparing these data and charts, we assume no responsibility for any factual errors or omissions expressed herein. © 2025 OKX. This article may be reproduced or distributed in full, or excerpts of 100 words or less from this article may be used, provided such use is non-commercial. Any reproduction or distribution of the entire article must also prominently state: "Copyright © 2025 OKX. Used with permission." Permitted excerpts must cite the article name and include attribution, such as "Article Name, [Author Name (if applicable)], © 2025 OKX". Some content may be generated or assisted by artificial intelligence (AI) tools. Derivative works or other uses of this article are not permitted.
Show More
Recommended Reading

Profit Even When Bitcoin Falls? How to Trade Contracts
As the cryptocurrency market led by Bitcoin continues to expand, various forms of derivative Trading have gradually emerged beyond spot Trading as tools to hedge risk. Among them, contract Trading has garnered the most attention. What is contract Trading? Contracts are the most common Trading contract form in the cryptocurrency derivatives market. digital assets contract Trading refers to buyers and sellers agreeing to Trade certain assets at a specified price at a future time.
January 16, 2026

Even Simpler Than Copy Strategies? One-Click Follow the Strongest Strategy Traders on OKX, Let Traders Make Money for You
Whether in traditional finance or the cryptocurrency market, strategy Trading is a very important and critical method in the Trading system. When facing complex Trading environments and extreme Trading conditions, even with solid theoretical knowledge and rich Trading experience, it's easy to miss Trading opportunities or make wrong judgments and operations due to emotional influence. Strategy Trading is precisely an effective tool that can solve these problems. With Trading tools available, how to make
November 21, 2025

Five, Strategy Trading Series Course - Savings
Preface: We often have this hypothesis: there are many digital assets with significant gains in bull markets. If we can continuously capture assets with large increases, for example capturing one doubled digital asset per month, after one year your assets would become 2 to the power of 12, i.e., 4096 times. This is very impressive, of course this is also almost an impossible feat, because it's difficult for us to continuously catch surging coins. This is also a problem many users encounter: in bull markets, although
November 3, 2025

Which Countries/Regions Do Not Support Registration to Use OKX
OKX currently does not support providing services to customers in the following regions: certain US territories such as New York, Texas, Puerto Rico, American Samoa, Guam, Commonwealth of the Northern Mariana Islands, US Virgin Islands (St. Croix, St. John, and St. Thomas), Cuba, Iran, North Korea, Crimea, Malaysia, Syria, Bangladesh, and Bolivia. For details, please refer to the OKX Terms of Service.
April 25, 2024

Quick Understanding of OKX Common Products and Features
OKX (www.okx.com) is one of the world's famous digital assets service platforms, mainly providing global users with Bitcoin, Ethereum, and other digital assets spot and derivative Trading services, while also exploring the world of DeFi, DApp, NFT, and GameFi together with users. On OKX, you can enjoy smooth Trading experiences such as spot and contracts, stay updated on token information in hot areas/concepts, and also
April 25, 2024

Learn K-Line from Zero | 5 Importance of K-Line Combination Applications
Rises and falls follow trends; understand the language of prices; buy and sell with signals; say goodbye to intuitive Trading. I. Bullish K-Line Combinations at Key Positions In the first two sections of this chapter, we covered applications of bullish and bearish K-line combinations, but these combinations are not effective in all positions. In this section, we'll explain the importance of where combinations appear. Where can bullish combinations better serve their purpose? The first situation: in a clear upward trend, the preceding
April 25, 2024


