Zero Basics: Learn K-Line Charts | 2. Evolution and Meaning of Single Candlesticks
Trends drive price movement, read the language of the market;
Signals guide your trades, trade with confidence.
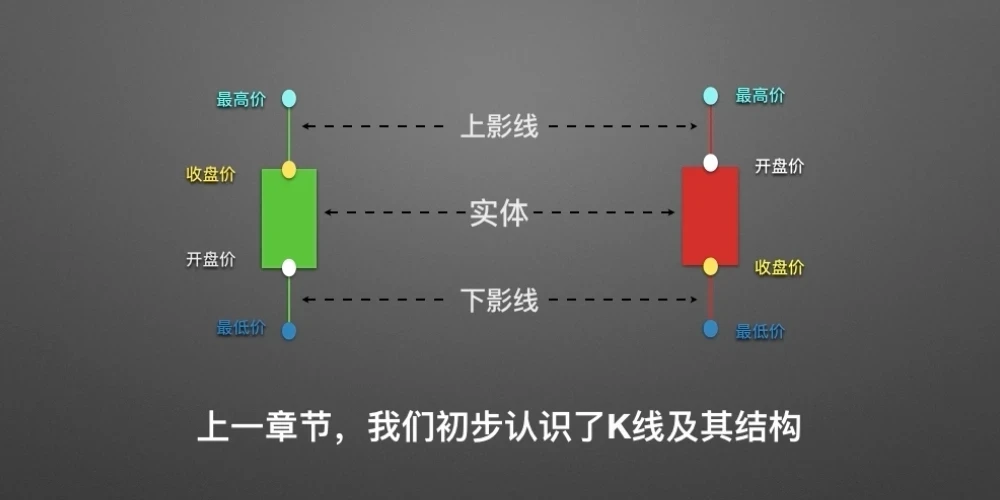
In the previous lesson, we got an initial understanding of K-line charts and their structure. But what's the point of knowing them? Today, we will learn about the evolution and meaning of single candlesticks.
1. How K-Line Charts Evolve in Continuous Price Changes
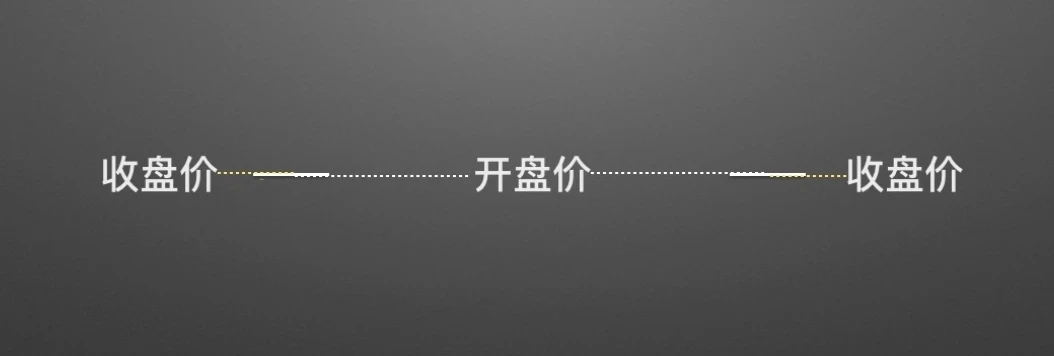
This is a "Doji Line," where the opening and closing prices are the same. It often appears at the moment of market open, when trading volume is extremely thin, or when the stock market hits its daily price limit up or down at open.
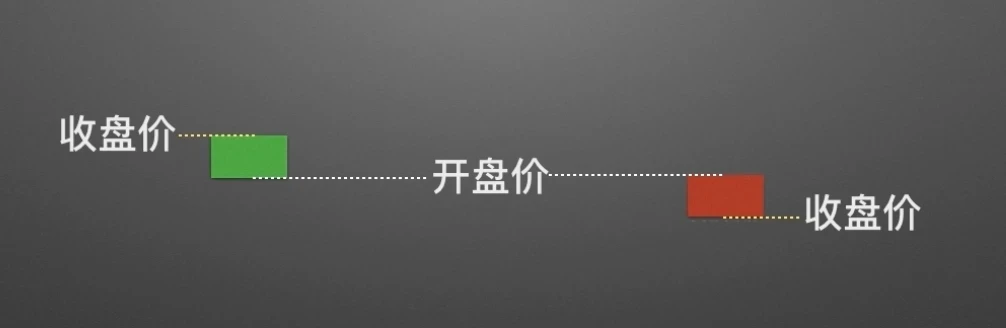
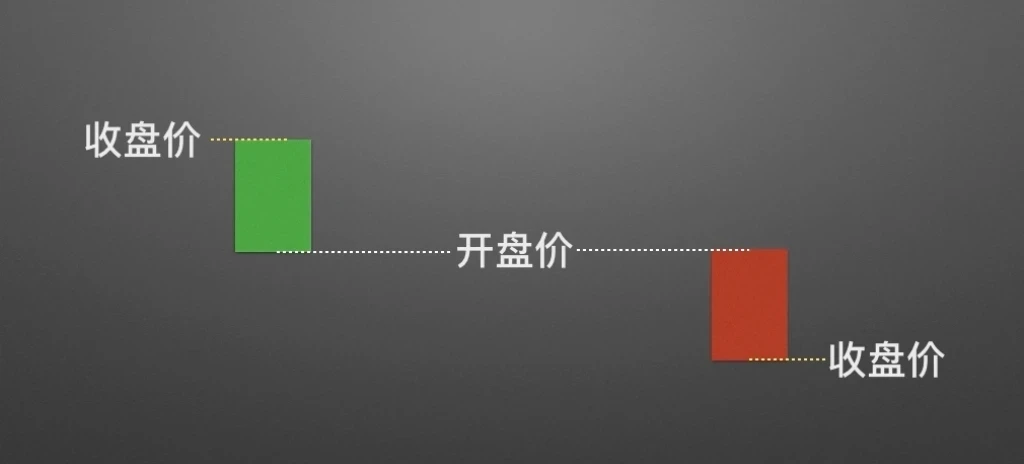
As the market gradually picks up activity, prices begin to move. This forms the relatively small-bodied "small K-line" shown in the chart. The left side indicates rising prices, commonly referred to as a "small bullish candle," while the right side indicates falling prices, commonly referred to as a "small bearish candle."
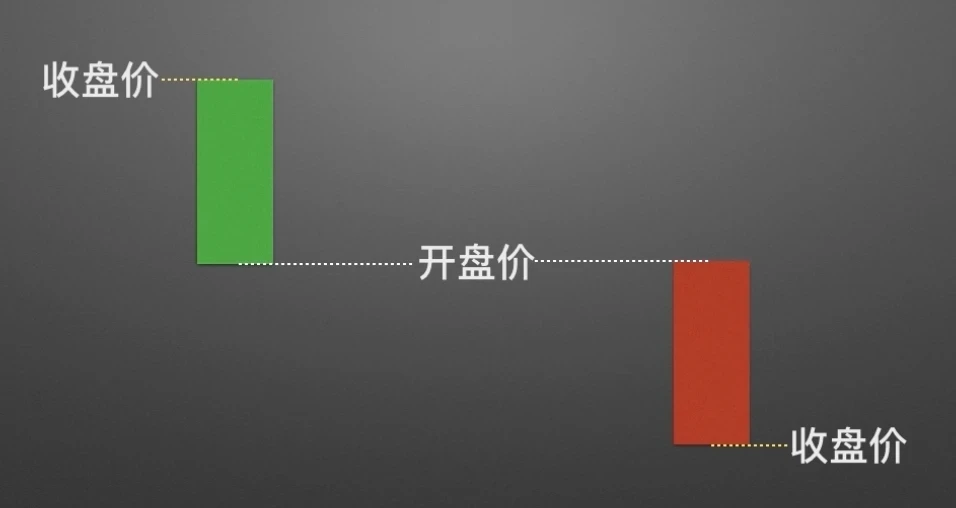
In a more active market, longer-bodied "medium bullish candles" and "medium bearish candles" form as shown.
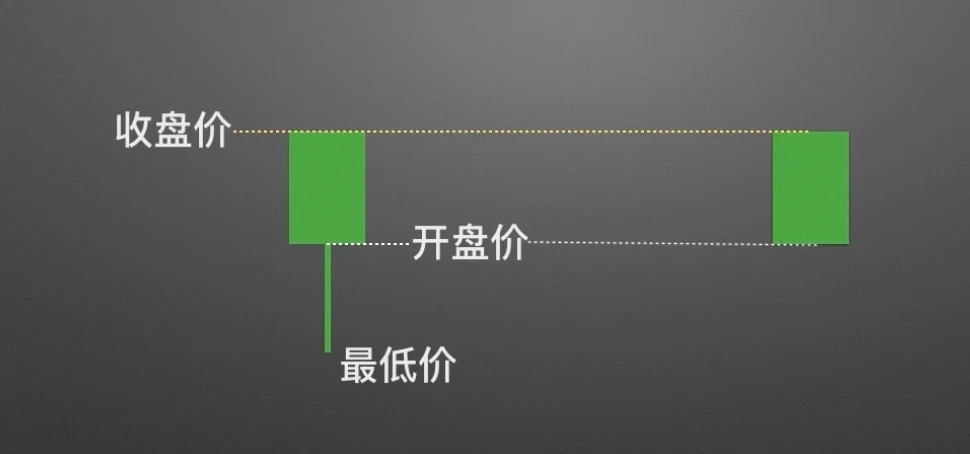
When trading activity reaches extreme levels during this period, the "large bullish candle" on the left and the "large bearish candle" on the right form.
So, how are the shadows (wicks) formed?
Let's go back to how the market looked when it just opened.
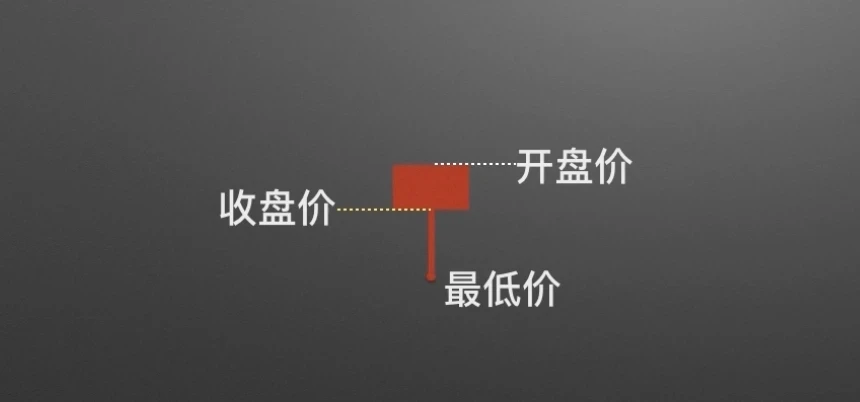
The price gradually declined. When the price dropped to a certain level, proactive buyers began to enter the market, pushing the price back up step by step, forming the lower shadow. As shown, when the K-line body is small with only a lower shadow, it is commonly known as a "Hammer Line."
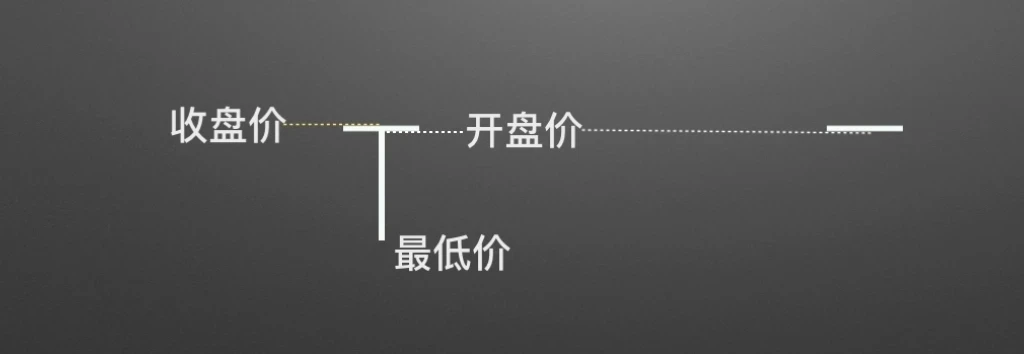
When the K-line body becomes a thin line as shown on the left, it is called a "T-Line." The right chart shows the "Doji Line" we discussed earlier.
As buying pressure grows stronger, the price gradually rises, forming the two bullish candle patterns shown.
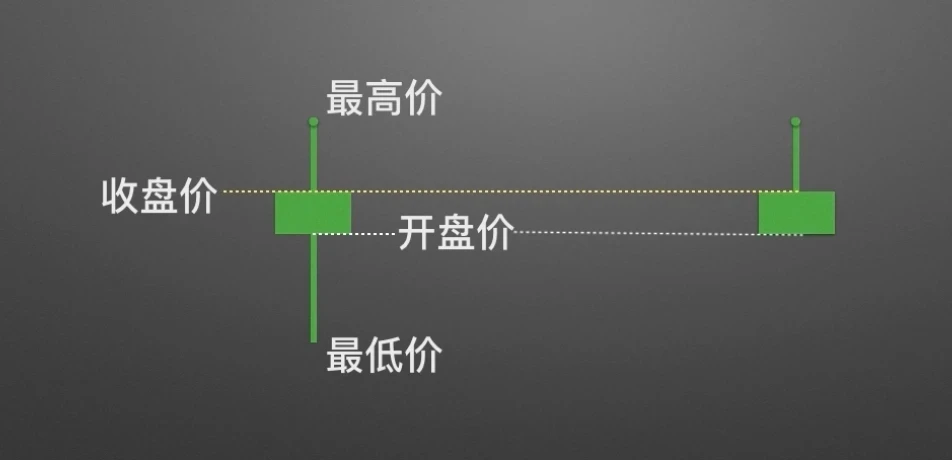
When the price rises to a certain level, proactive sellers gradually enter the market, driving the price down and forming the upper shadow, as shown. When the K-line body is small with only an upper shadow, it is commonly known as an "Inverted Hammer Line."
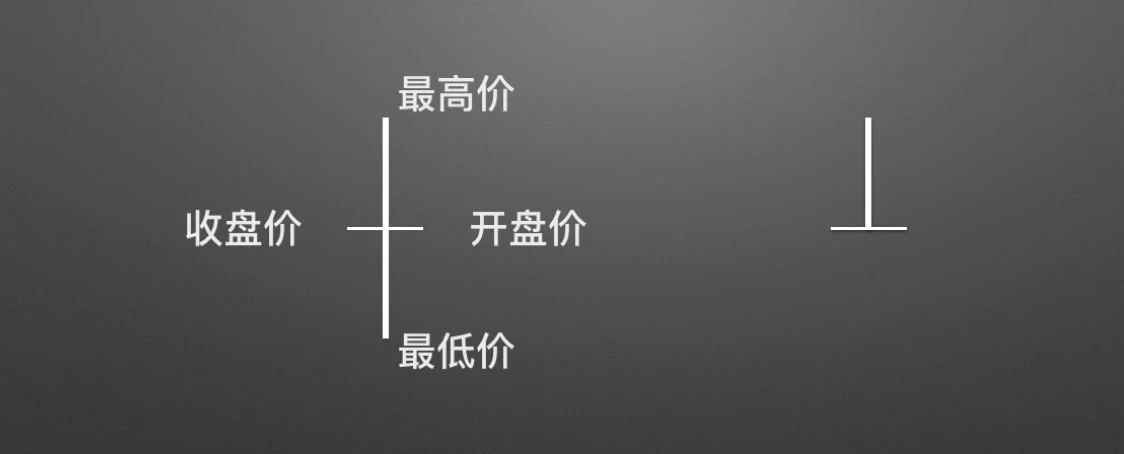
Selling pressure gradually increases, pushing prices lower until the closing price matches the opening price. As shown, the K-line on the left that resembles a cross is called a "Doji Star Line," while the one on the right, resembling a tombstone, is commonly called a "Gravestone Doji," also known as an "Inverted T-Line."
2. K-Line Classification and Their Meanings
Through the step-by-step evolution of K-lines, we have come to recognize many patterns. So, how many different types of K-lines are there? And how should they be classified?
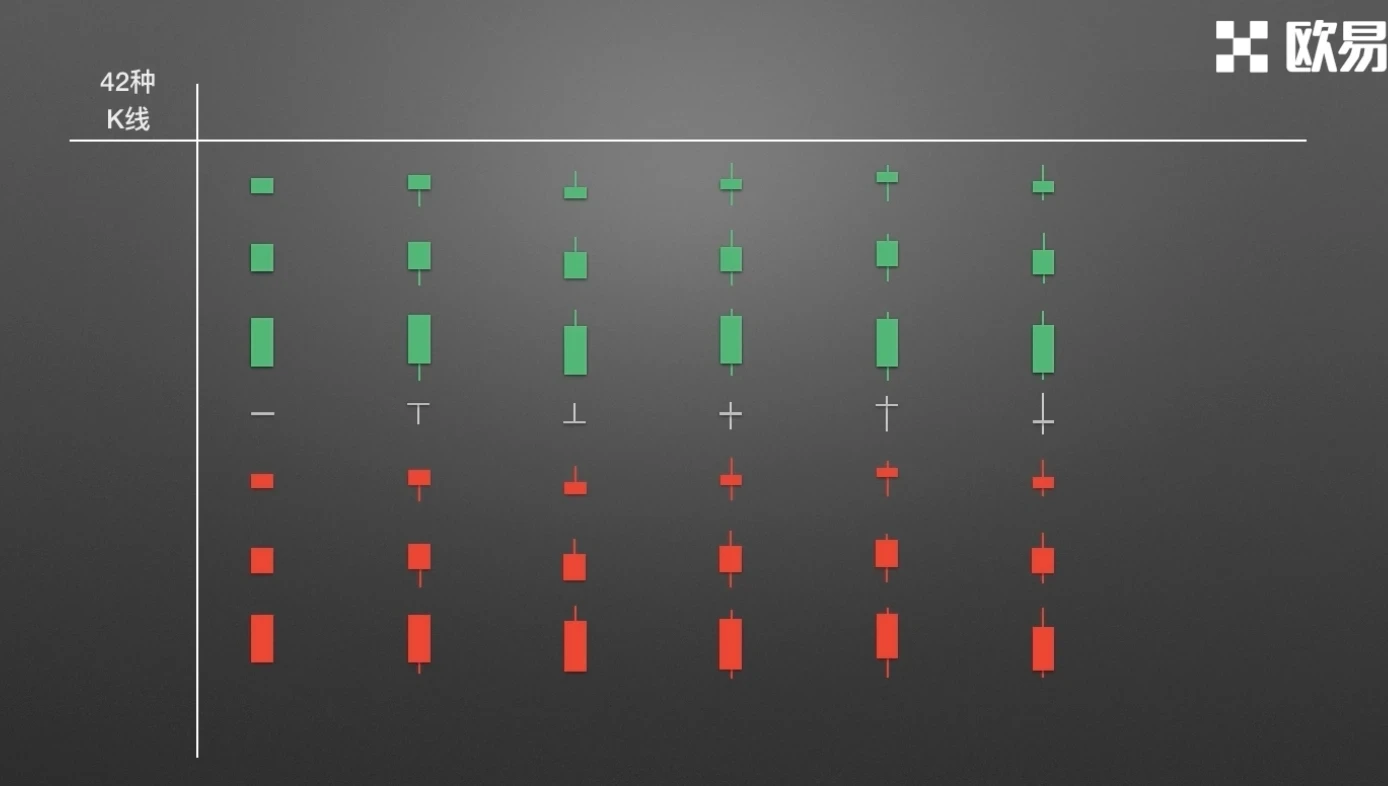
As shown, we have arranged various K-line patterns in an orderly manner. Arranged both horizontally and vertically, there are 42 types in total. Let's first explain the meaning behind the length of K-line bodies.
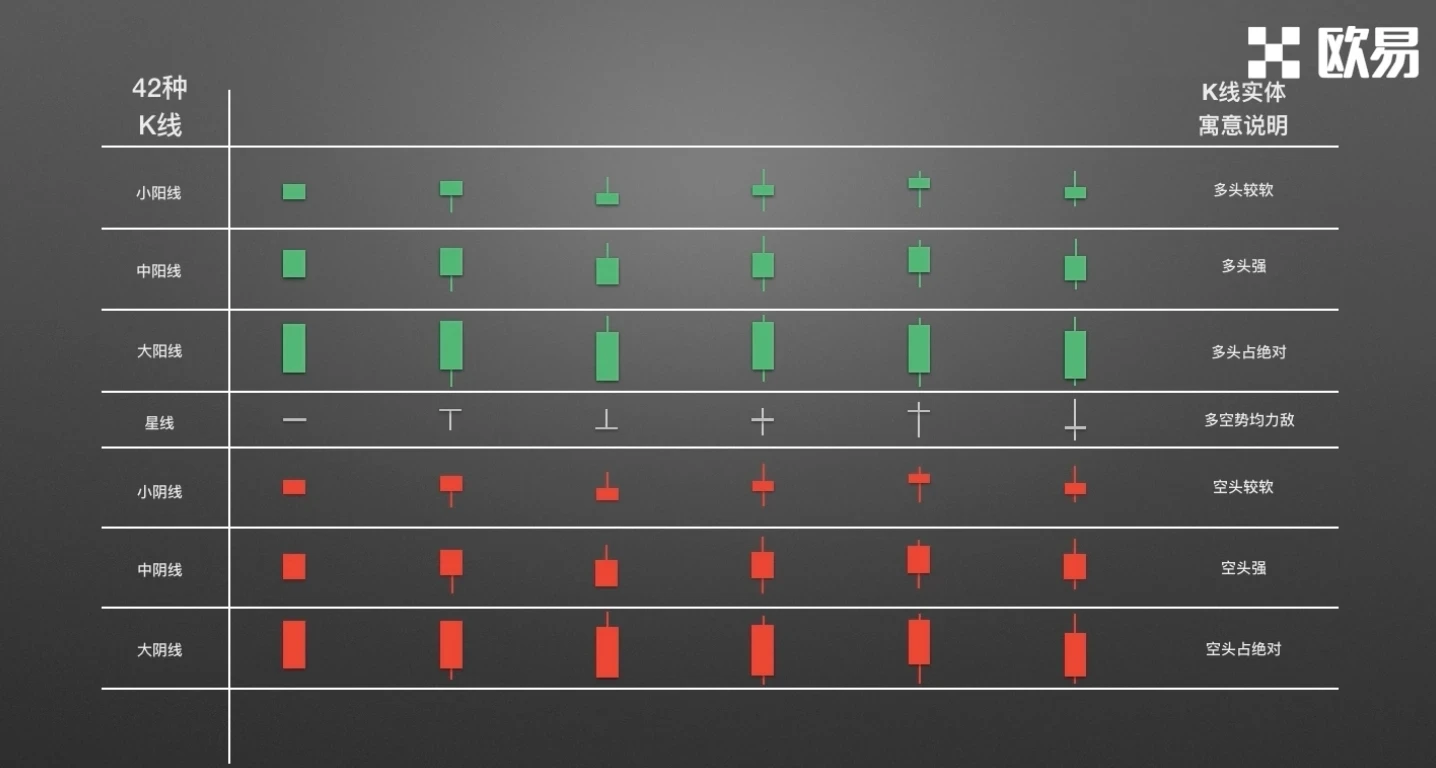
Row 1: Short-bodied green small bullish candles indicate weak upward momentum.
Row 2: Medium-bodied green medium bullish candles indicate strong upward momentum.
Row 3: Very long-bodied green large bullish candles indicate absolute dominance of upward momentum.
Row 4: Bodies appear as thin lines, collectively known as star lines, indicating intense tug-of-war between bulls and bears with evenly matched forces.
Row 5: Short-bodied red small bearish candles indicate weak downward momentum.
Row 6: Medium-bodied red medium bearish candles indicate strong downward momentum.
Row 7: Very long-bodied red large bearish candles indicate absolute dominance of downward momentum.
Next, let's uncover the meaning behind the length of upper and lower shadows.
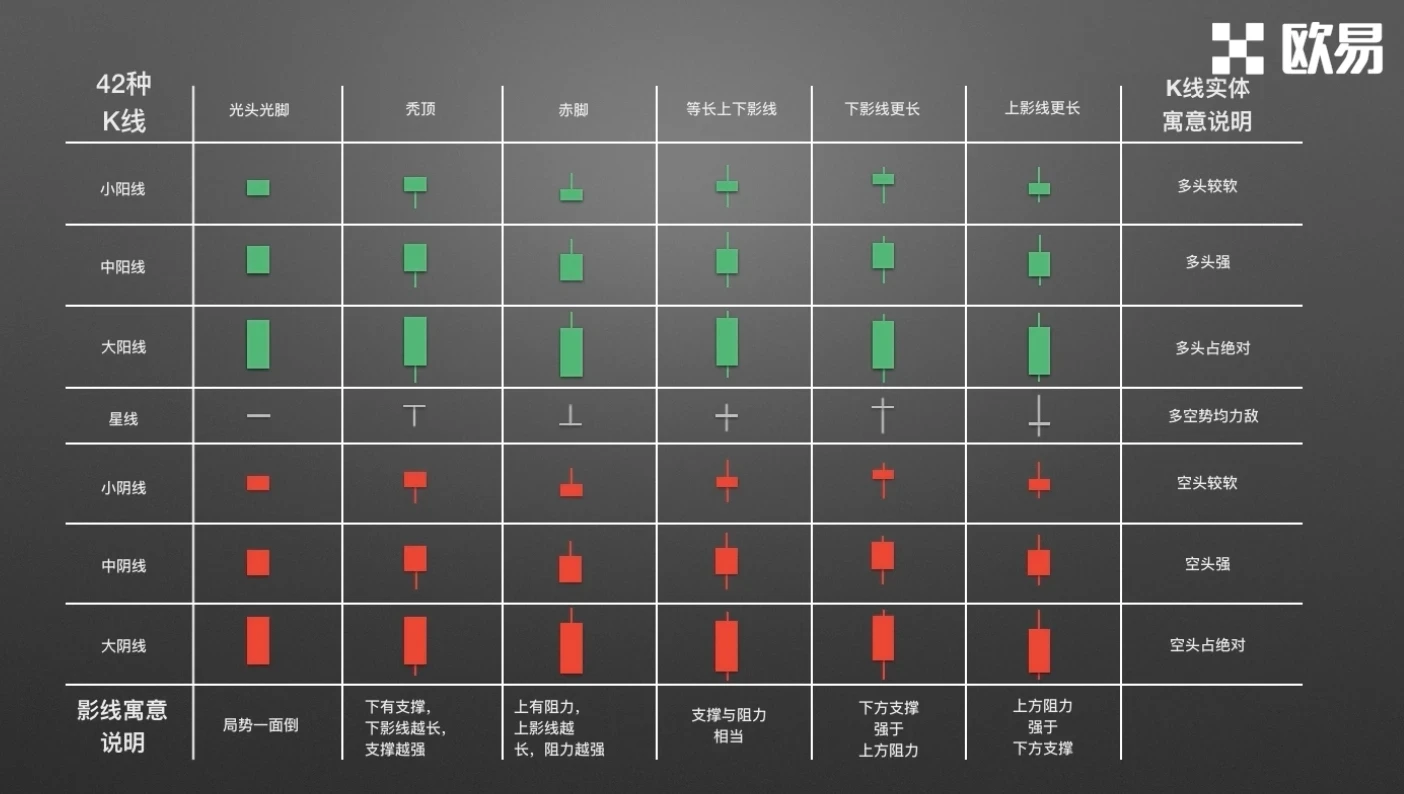
Column 1: K-lines with no upper or lower shadows are commonly known as "bareheaded and barefoot," indicating a one-sided market. A bullish candle indicates strong bull dominance, while a bearish candle indicates strong bear dominance.
Column 2: Only lower shadows, looking as if the K-line didn't grow any hair, hence commonly called "bald top." This indicates support from below; the longer the lower shadow, the stronger the support.
Column 3: K-lines with only upper shadows, commonly known as "barefoot." This indicates resistance from above; the longer the upper shadow, the stronger the resistance.
Column 4: Upper and lower shadows are nearly equal in length, indicating both support and resistance are present and evenly matched.
Column 5: Lower shadow is longer than the upper shadow, indicating support from below is greater than resistance from above.
Column 6: Upper shadow is longer than the lower shadow, indicating resistance from above is greater than support from below.
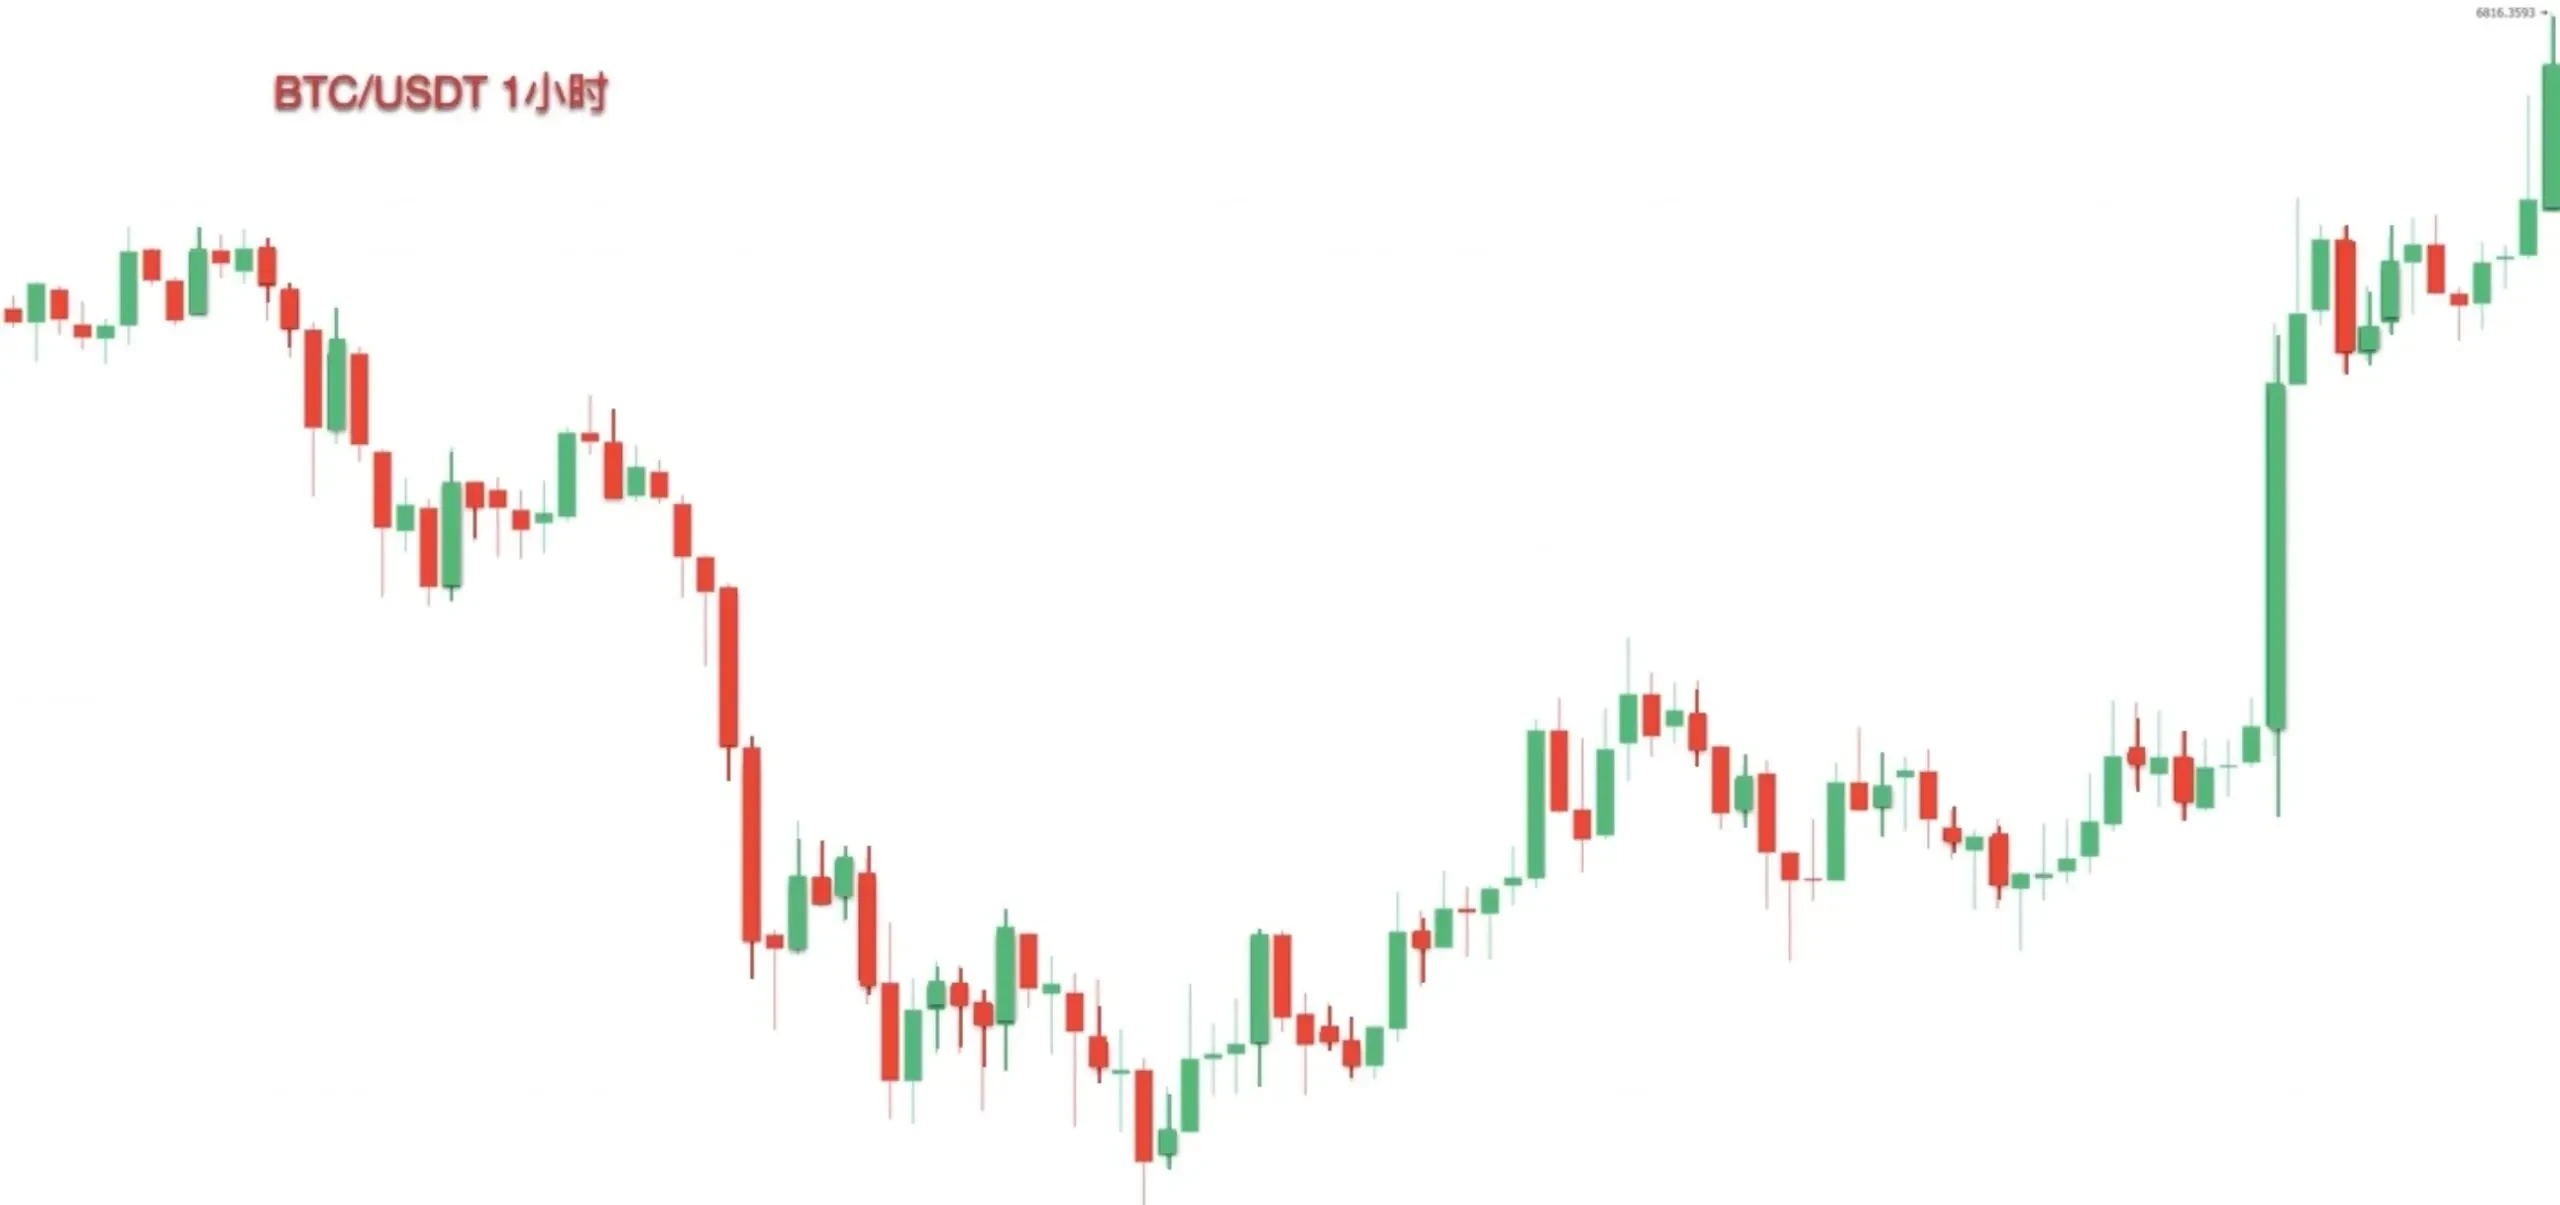
When countless groups of these K-lines are arranged together, they form the price trend charts we commonly see. The screenshot is from the OKX spot BTC/USDT price chart in the trading area.
That concludes this lesson. In the next lesson, we will share methods to predict future price movements by observing regular K-line patterns.
Disclaimer
This article may contain product-related content not applicable to your region. This article is intended to provide general information only and makes no representation as to any factual errors or omissions. The views expressed are those of the author and do not represent the views of OKX. This article is not intended to provide any advice, including but not limited to: (i) investment advice or investment recommendations; (ii) offers or solicitations to buy, sell, or hold digital assets; or (iii) financial, accounting, legal, or tax advice. Holdings in digital assets (including stablecoins) involve a high degree of risk and may fluctuate significantly, potentially becoming worthless. You should carefully consider whether trading or holding digital assets is appropriate for you based on your financial situation. For questions specific to your circumstances, please consult your legal/tax/investment professional. Any information contained in this article (including market data and statistics, if applicable) is for general reference purposes only. While all reasonable precautions have been taken in the preparation of such data and charts, we accept no responsibility for any factual errors or omissions expressed herein. © 2025 OKX. This article may be reproduced or distributed in its entirety, or brief excerpts of 100 words or less from this article may be used, provided that such use is for non-commercial purposes. Any reproduction or distribution of the full article must prominently state: "This article is copyrighted © 2025 OKX, used with permission." Permitted excerpts must cite the article title and include the source, for example: "Article title, [author name (if applicable)], © 2025 OKX." Some content may have been generated or assisted by artificial intelligence (AI) tools. Derivative works and other uses of this article are not permitted.
Show More
Recommended Reading

Profit from Bitcoin Drops? How to Trade Contracts
With the continuous expansion of the cryptocurrency market represented by Bitcoin, diverse derivatives trading has gradually emerged alongside spot trading as a risk hedging tool, with contract trading receiving the most attention. What is contract trading? Contracts are the most common trading instrument in the cryptocurrency derivatives market. Digital assets contract trading refers to buyers and sellers agreeing to trade a specific asset at a predetermined price at a future time.
January 16, 2026

Simpler Than Copying Strategies? Copy Top Traders with One Click on OKX and Let Them Earn for You
Whether in traditional finance or the cryptocurrency market, strategic trading is a crucial component of the trading system. When faced with complex trading environments and extreme market conditions, even those with solid theoretical knowledge and extensive trading experience can easily miss trading opportunities or make poor decisions influenced by emotions. Strategic trading is precisely an effective tool to address these issues. You have the trading tools, so how do you use
November 21, 2025

5. Strategic Trading Series — Recurring Buy Tool
Preface: We often have this thought: During a bull market, there are many digital assets that surge significantly. If you could continuously capture coins with large gains, such as catching one that doubles every month, your assets would grow to 2 to the 12th power, or 4,096 times, over a year — which is quite astonishing. Of course, this is nearly an impossible feat, as it's difficult to consistently capture surging coins. This is also a common problem many users face: during a bull market, although
November 3, 2025

Which Countries/Regions Do Not Support OKX Registration
OKX currently does not provide services to customers in the following regions: certain U.S. territories such as New York, Texas, Puerto Rico, American Samoa, Guam, the Northern Mariana Islands, the U.S. Virgin Islands (St. Croix, St. John, and St. Thomas), Cuba, Iran, North Korea, Crimea, Malaysia, Syria, Bangladesh, and Bolivia. For more details, please refer to the OKX Terms of Service.
April 25, 2024

Quick Guide to OKX Products and Features
OKX (www. okx. com) is one of the world's renowned digital assets service platforms, primarily serving global users with Bitcoin, Ethereum and other digital assets spot and derivatives trading services, while also exploring the worlds of DeFi, dApps, NFTs, and GameFi with its users. On OKX, you can enjoy seamless spot and futures trading experiences, stay updated on tokens in trending sectors/concepts first, and more.
April 25, 2024

Zero Basics: Learn K-Line Charts | 5. The Importance of K-Line Pattern Applications
Trends drive price movement, read the language of the market; signals guide your trades, trade with confidence. 1. Bullish K-Line Patterns at Key Levels In the previous two installments of this chapter, we covered the application of bullish and bearish K-line combinations. However, these patterns are not effective at every position. In this lesson, we will explain the importance of where these patterns appear. Where do bullish patterns work best? First scenario: Approaching a clear uptrend,
April 25, 2024


