Learn K-Line from Zero | 20 Common Analysis Indicators 2 — Trading Volume
Price trends speak volumes; trading signals eliminate guesswork.
Sentiment shifts, embrace Trading with confidence.
Part 1. What Is the Trading Volume Indicator
In this lesson, we will explore the second installment of our series on intricate technical indicators — the Trading Volume Indicator.
In this lesson, we will explore the second installment of our series on intricate technical indicators — the Trading Volume Indicator.
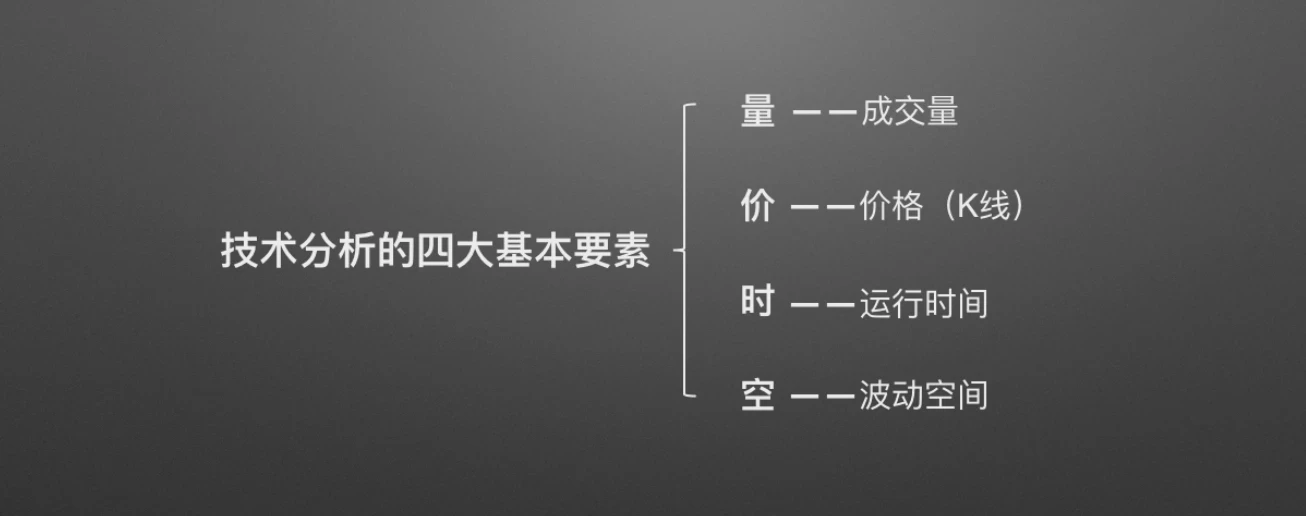
Generally speaking, technical analysis revolves around four core elements — volume, price, time, and space — referring to trading volume, K-line charts, runtime, and price fluctuation range. This underscores the importance of studying volume indicators in technical analysis.
So, what is the trading volume indicator?
Simply put, trading volume represents the total number of buy and sell orders for a given trading asset over a period of time. Changes in market trading volume reflect market activity and can serve as one of the indicators for analyzing market sentiment and gauging future price movements.
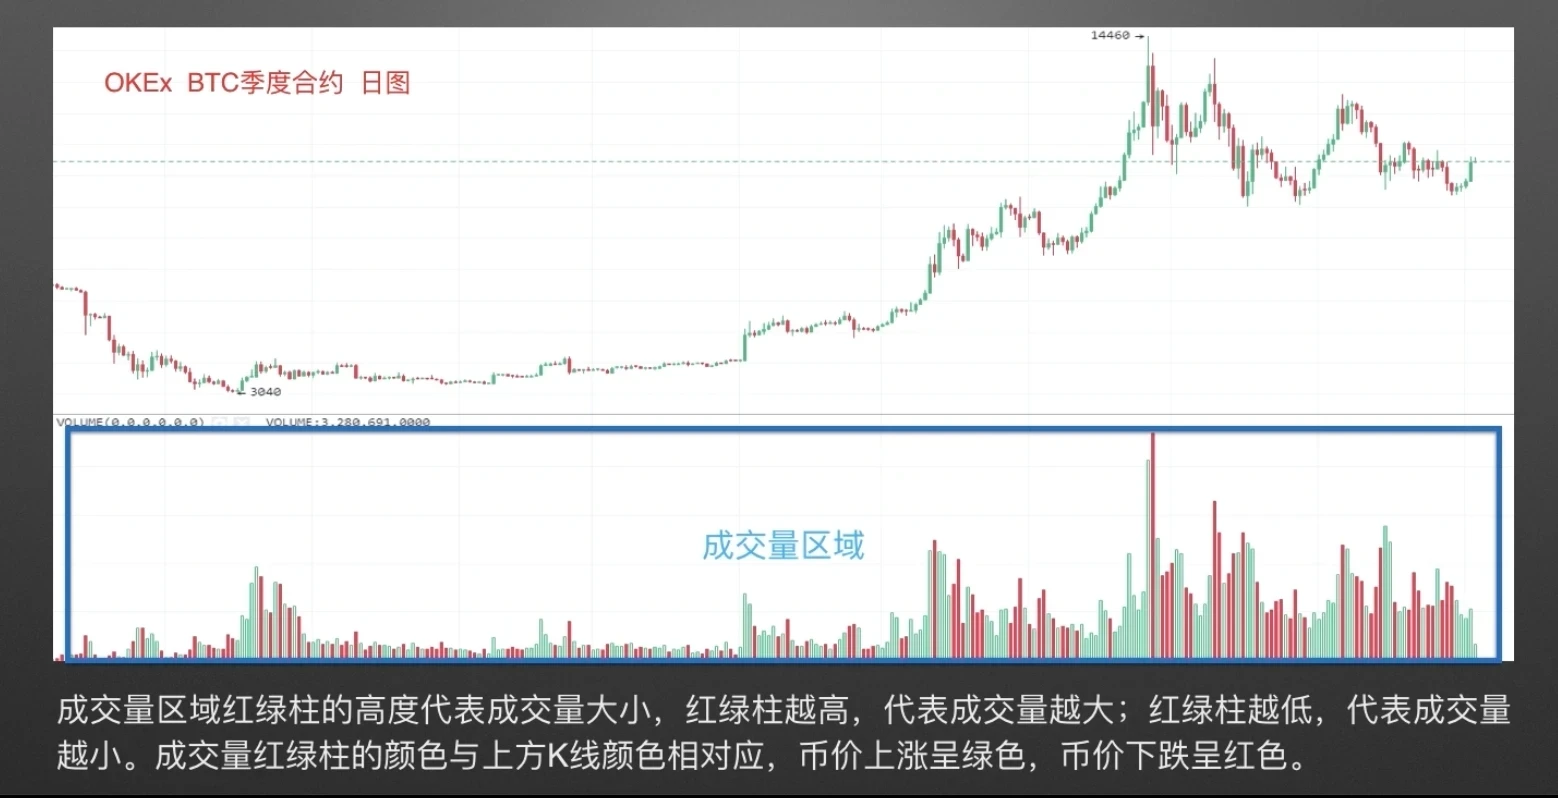
BTC Quarterly Futures Daily Chart. The blue box at the bottom represents the trading volume area. The height of the red and green bars in the volume area reflects trading volume — taller bars indicate higher volume, shorter bars indicate lower volume. The color of the volume bars corresponds to the color of the K-lines above: green when the price rises, red when the price falls.
Part 2. Types of Trading Volume
Next, let's look at the different types of trading volume.
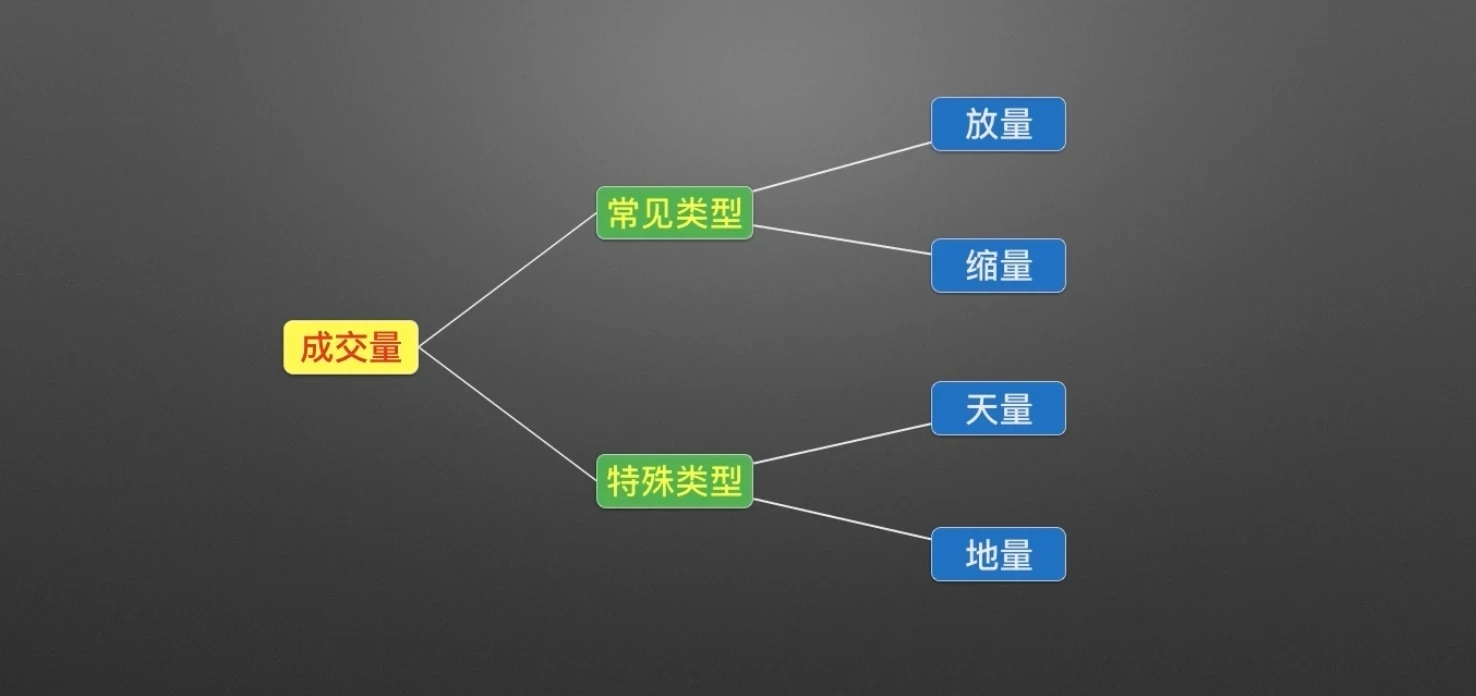
As shown in the diagram, trading volume is categorized into common types and special types. Common types include increasing volume and decreasing volume, while special types include peak volume and low volume.
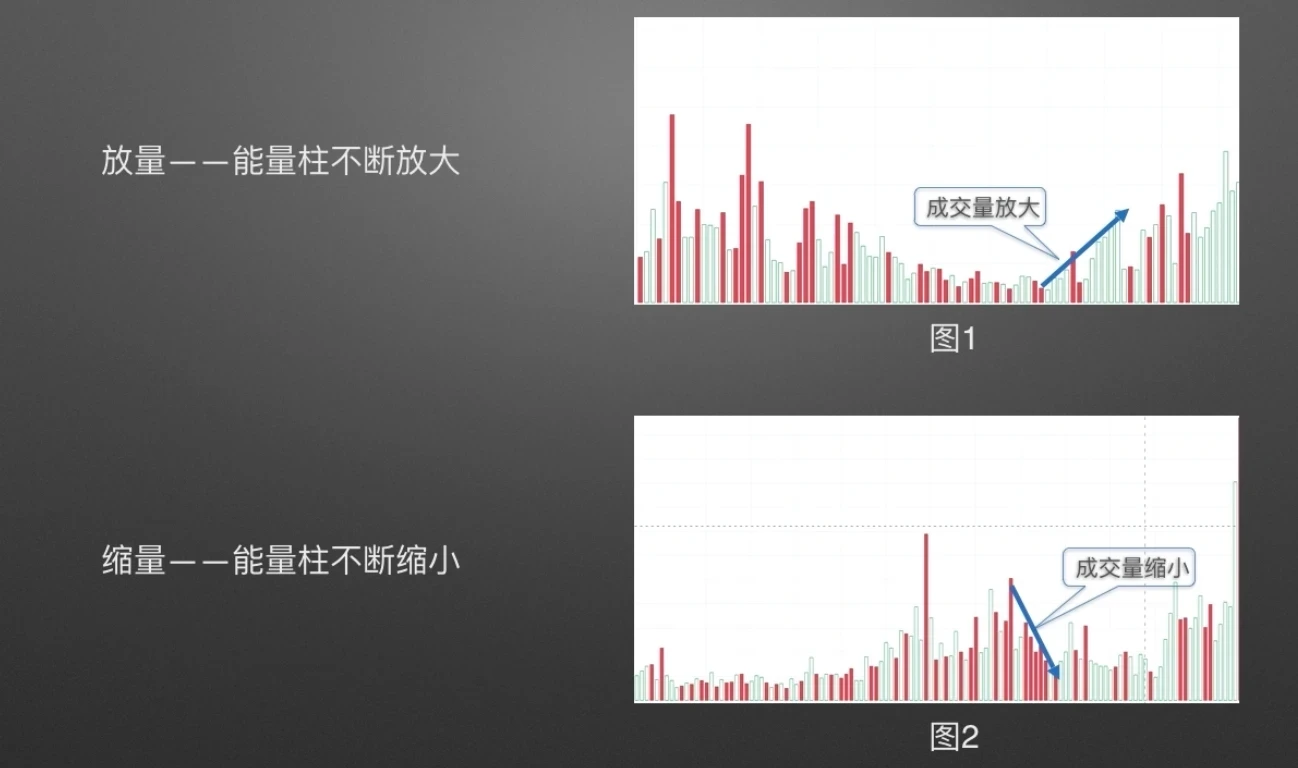
Let's first examine the two common types of trading volume. The first type, increasing volume, is shown in Figure 1 — the volume bars grow progressively taller, indicating rising trading volume and an increasingly active market. The second type, decreasing volume, is shown in Figure 2 — the volume bars progressively shorten, indicating declining trading volume, fading market trading sentiment, and lower volatility.
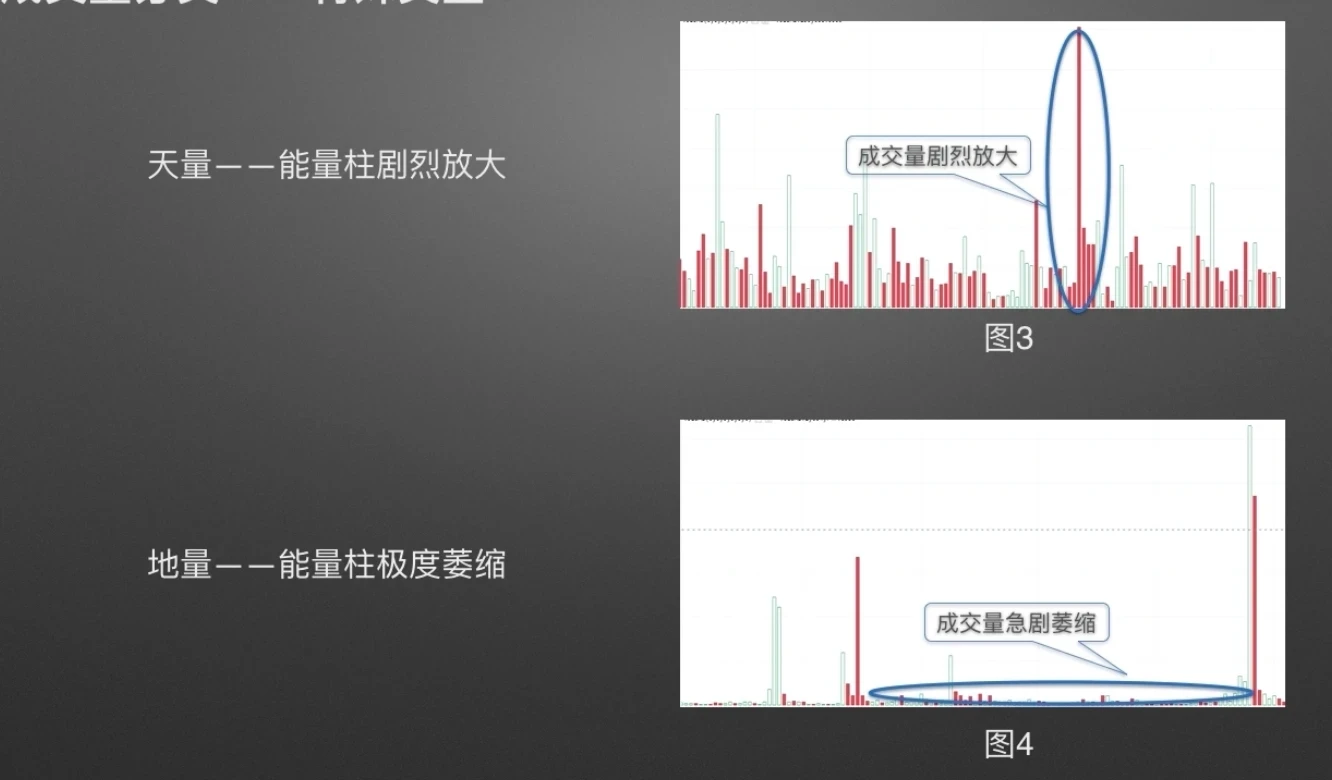
Now let's look at the two special types of trading volume. Peak volume, as shown in Figure 3, refers to trading volume that is multiples higher than that of any adjacent periods. Low volume, as shown in Figure 4, refers to volume bars that contract sharply within a specific time range, indicating extremely subdued buying and selling activity, typically occurring during a market bottoming phase.
Part 3. Volume-Price Relationships
So, what is the relationship between price and trading volume? What does the volume-price relationship look like in technical analysis?
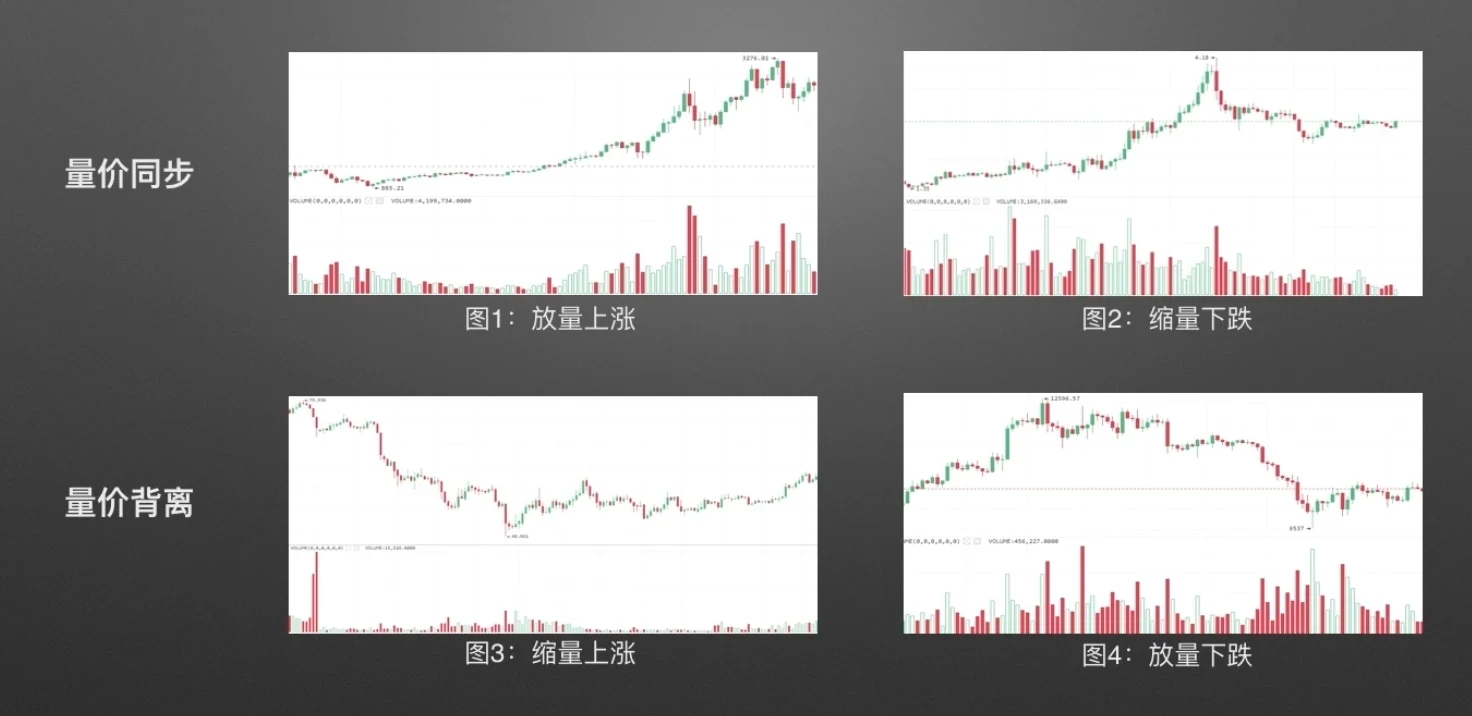
Let's first look at several common volume-price relationships. These fall into two categories — synchronized and diverging volume-price behavior. Synchronized relationships include rising prices with increasing volume and falling prices with decreasing volume. Diverging relationships include rising prices with decreasing volume and falling prices with increasing volume.
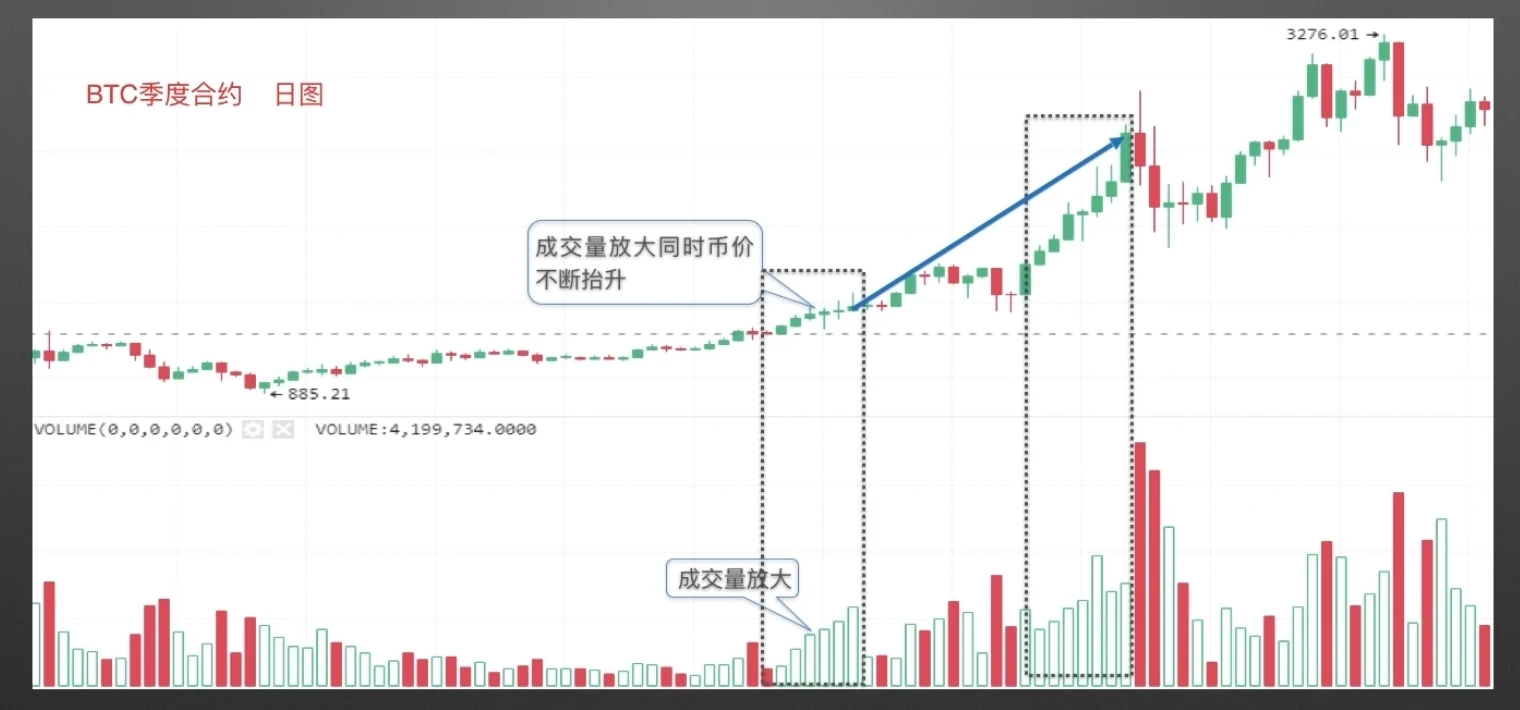
BTC/USDT Daily Chart. As shown in the left black outlined box, as trading volume progressively increases, the price rises modestly, displaying synchronized volume-price upward movement, which signals strengthening bullish momentum. As shown in the right black outlined box, as trading volume continues to expand, the price extends its upward trend, as indicated by the blue arrows.
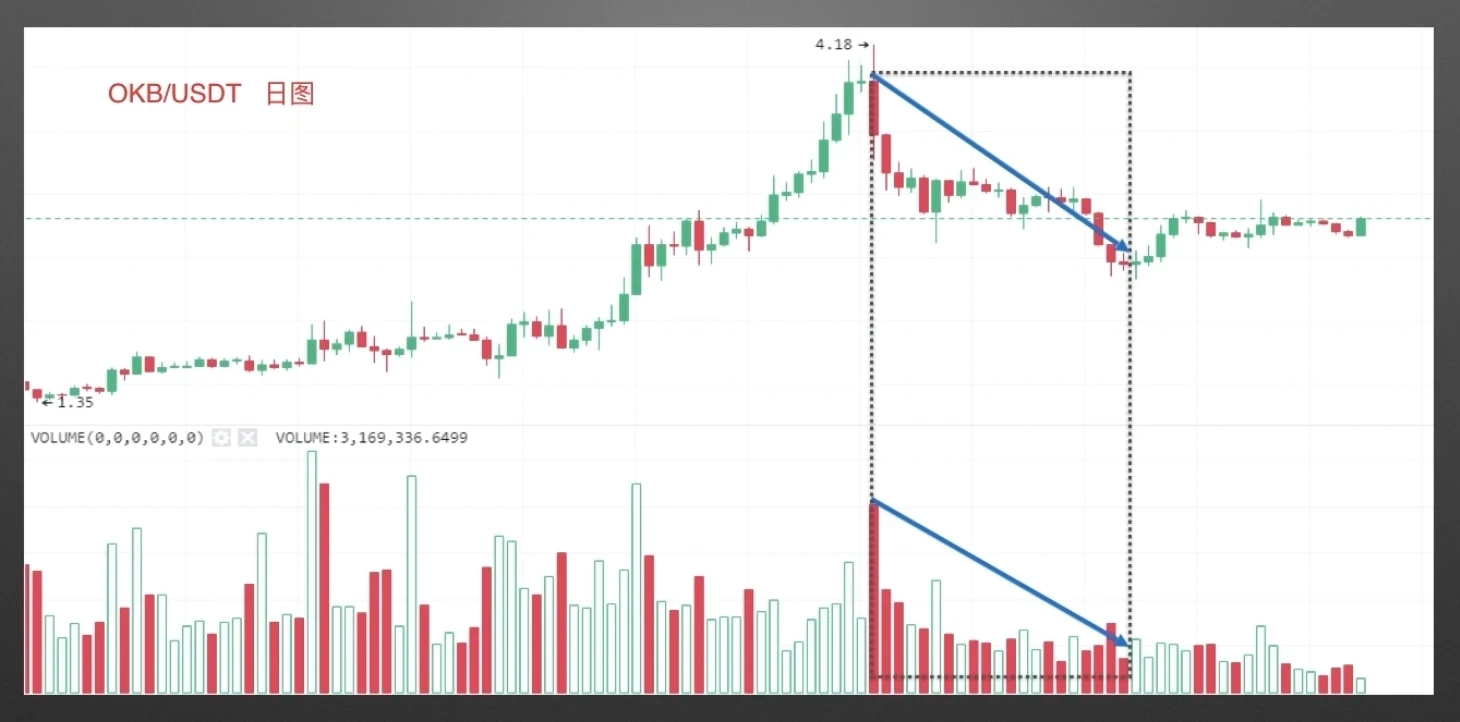
OKB/USDT Daily Chart. As shown in the black outlined area, as trading volume progressively decreases, the price gradually declines, exhibiting synchronized volume-price downward movement, indicating weakening bearish momentum.
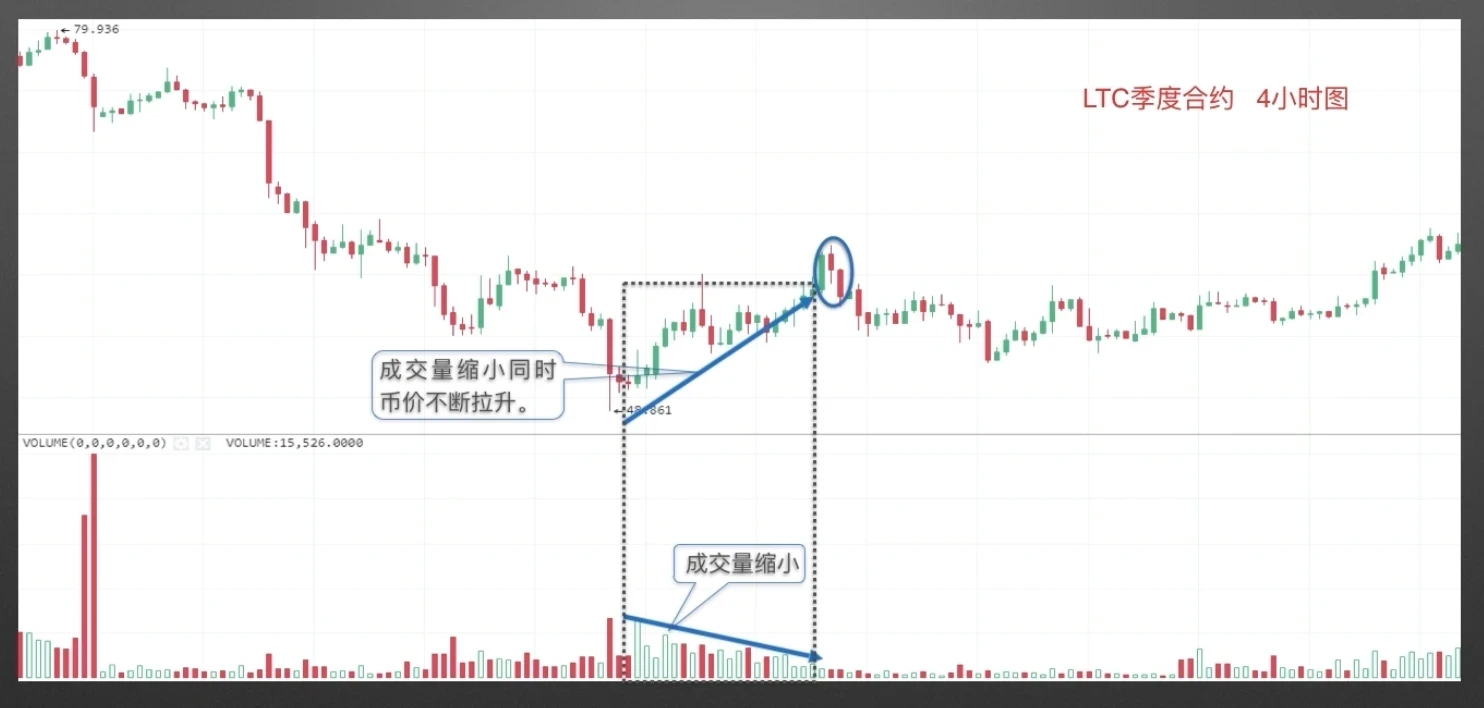
LTC Quarterly Futures 4-Hour Chart. As shown in the black outlined area, trading volume progressively shrinks while the price gradually rises — a volume-price divergence that signals weakening bullish momentum. When bearish K-line pattern formations shared in Lesson 3 appear alongside this divergence, it forms a sell signal.
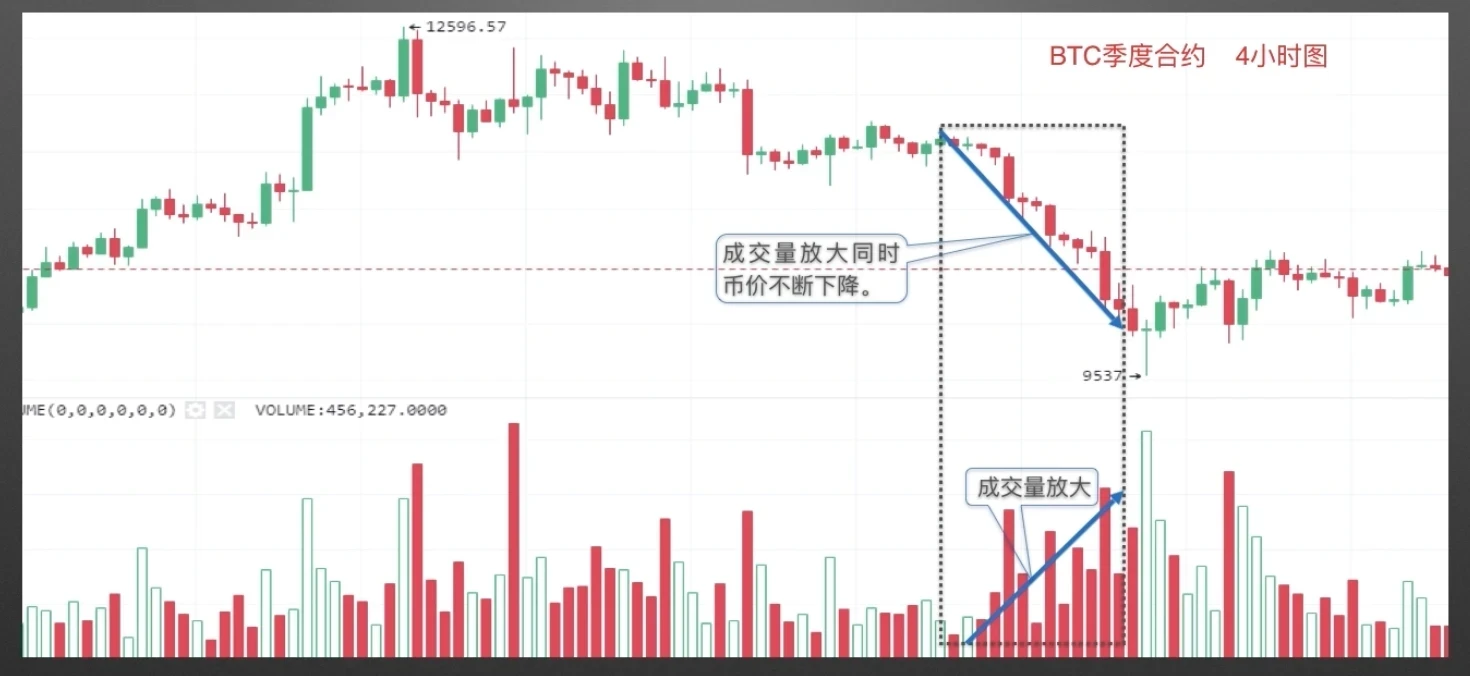
BTC Quarterly Futures 4-Hour Chart. As shown in the black outlined area, trading volume progressively expands while the price steadily declines — a volume-price divergence indicating strengthening bearish momentum. Typically, this surge in volume with price decline occurs following major negative news and is sometimes an irrational selling panic. One should wait for clear signs of volume contracting before expecting a price bottom to form.
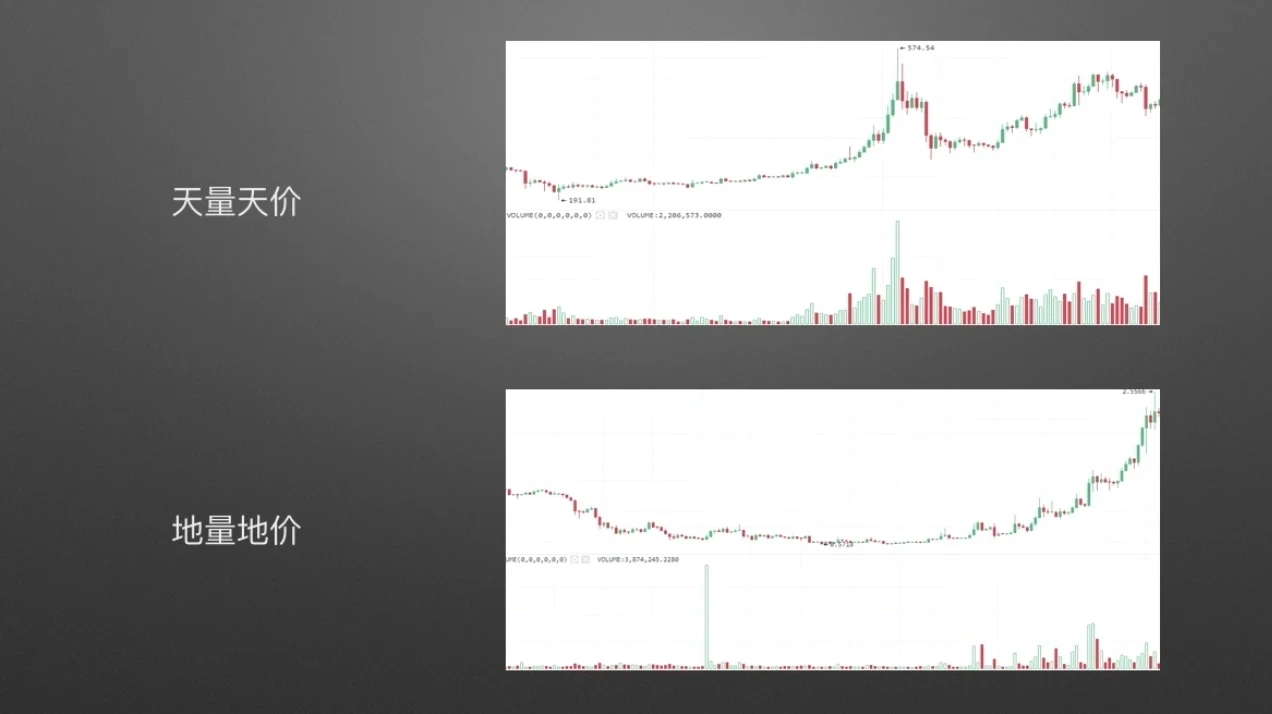
Beyond common volume-price relationships, there are two special ones: peak volume with peak price and low volume with low price.

BTC Quarterly Futures Daily Chart. When the price reaches a certain high, the corresponding trading volume is significantly higher than in adjacent areas, forming peak volume. At the same time, the K-lines at the high show long upper wicks, and when bearish K-line pattern formations appear, the corresponding K-line price is likely topping out, forming a peak price.
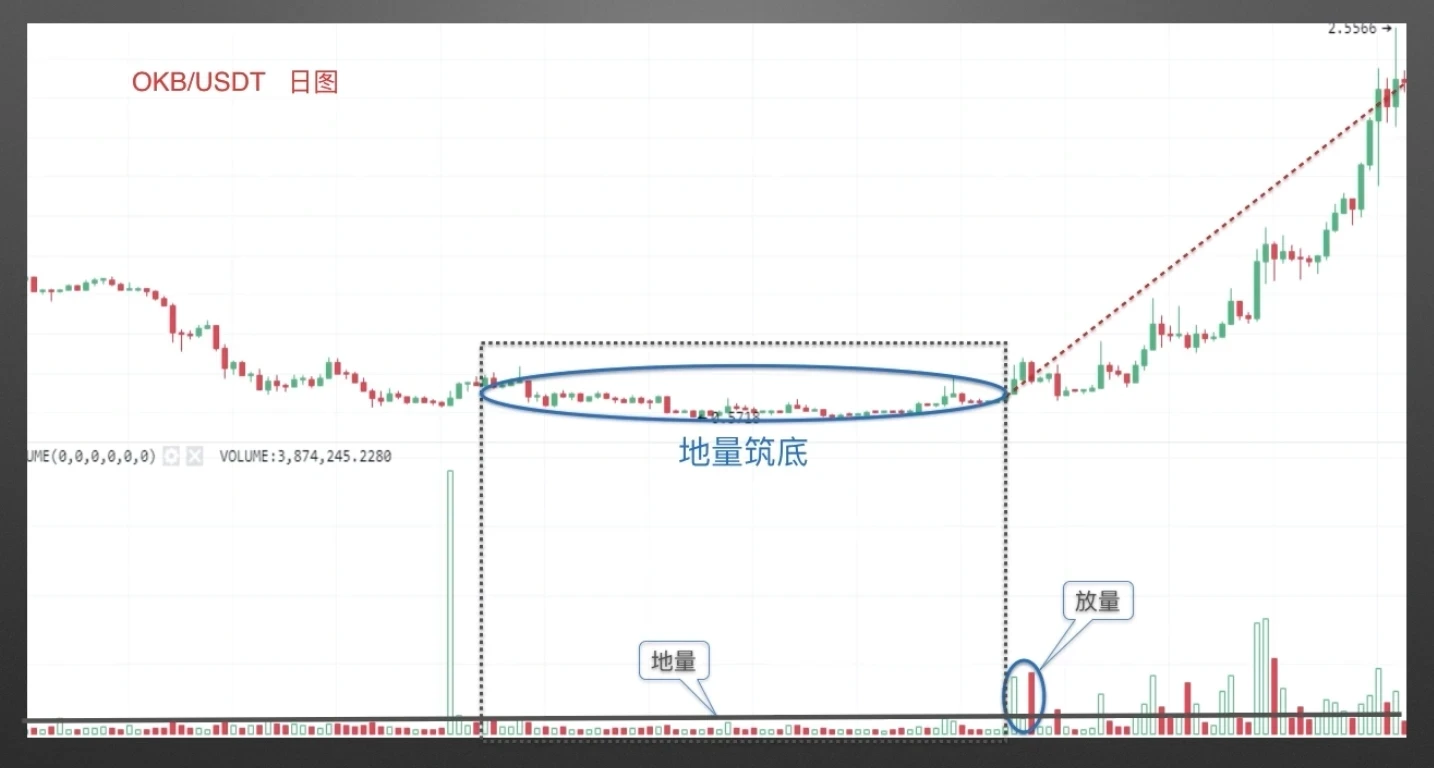
OKB/USDT Daily Chart. As shown in the dashed black outlined area, when volume bars remain persistently low and the corresponding price oscillates within a narrow range, a price bottom is likely forming. A noticeable surge in trading volume, as marked by the small blue circle, can serve as a signal that a new trend is beginning, as shown by the red dashed line.
After learning volume-price analysis, how can you apply it to guide your trading? Let's walk through three real-world trading examples below!
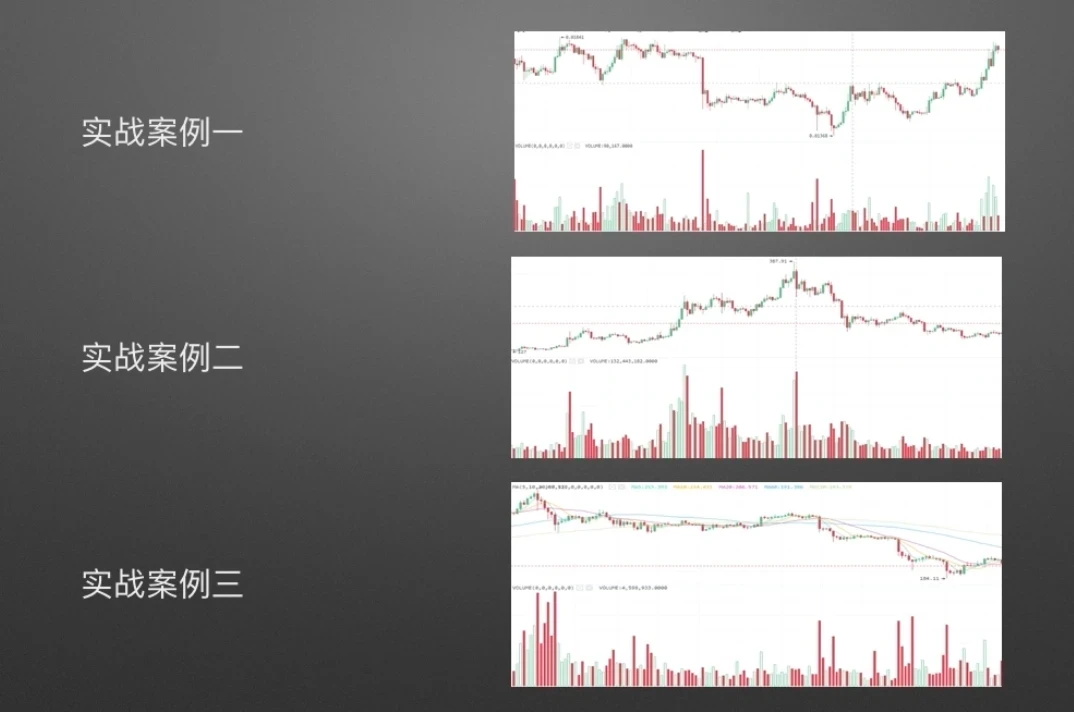
Real-world trading examples are shown in the figure
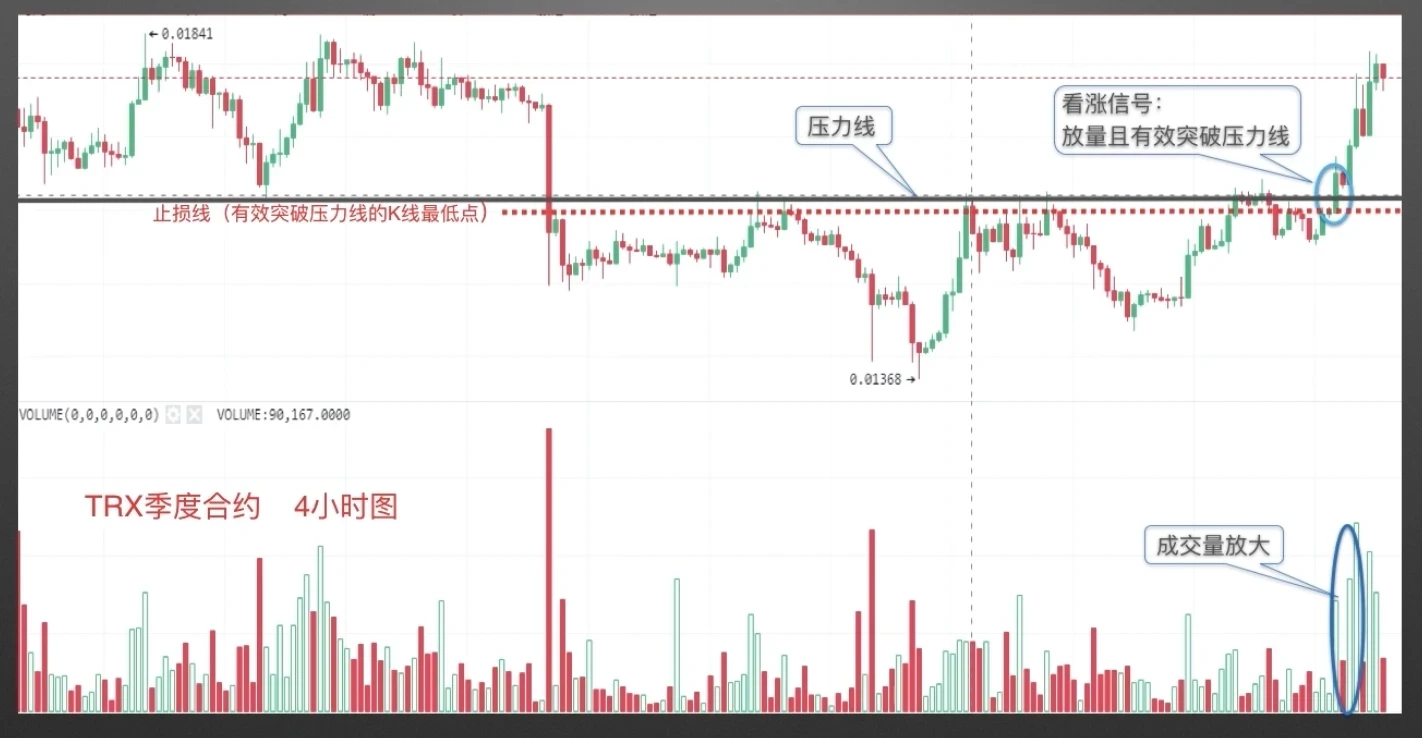
TRX Quarterly Futures 4-Hour Chart. The horizontal black line represents a strong resistance level. The price attempted to break through multiple times without success. When the K-line of this period closes with a valid breakout above this resistance level, accompanied by expanding trading volume, it constitutes a bullish signal. The stop-loss can be set at the low of the K-line that validly broke through the resistance, as shown by the red dashed line.
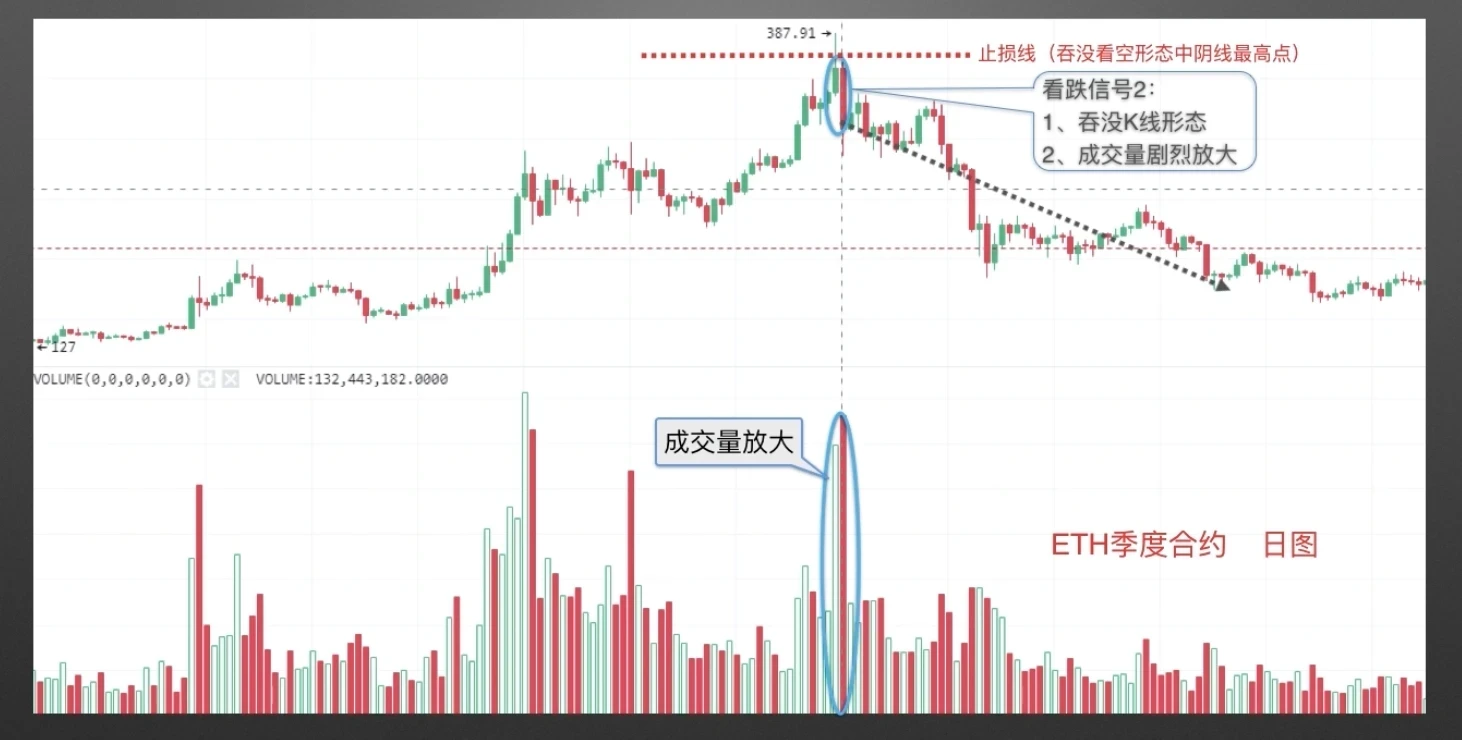
ETH Quarterly Futures Daily Chart. As shown, trading volume surged to an enormous level and the price kept climbing. When the bearish K-line pattern formations shared in Lesson 3 appeared at the high, a bearish signal 1 was triggered. However, after the bearish signal appeared, the price did not decline as expected, resulting in a stop-loss exit. As the price continued to rally, trading volume surged again to peak levels, and a bearish engulfing pattern appeared at the high, triggering bearish signal 2. It is recommended to set the stop-loss at the high of the bearish engulfing candle. The price subsequently declined as expected.
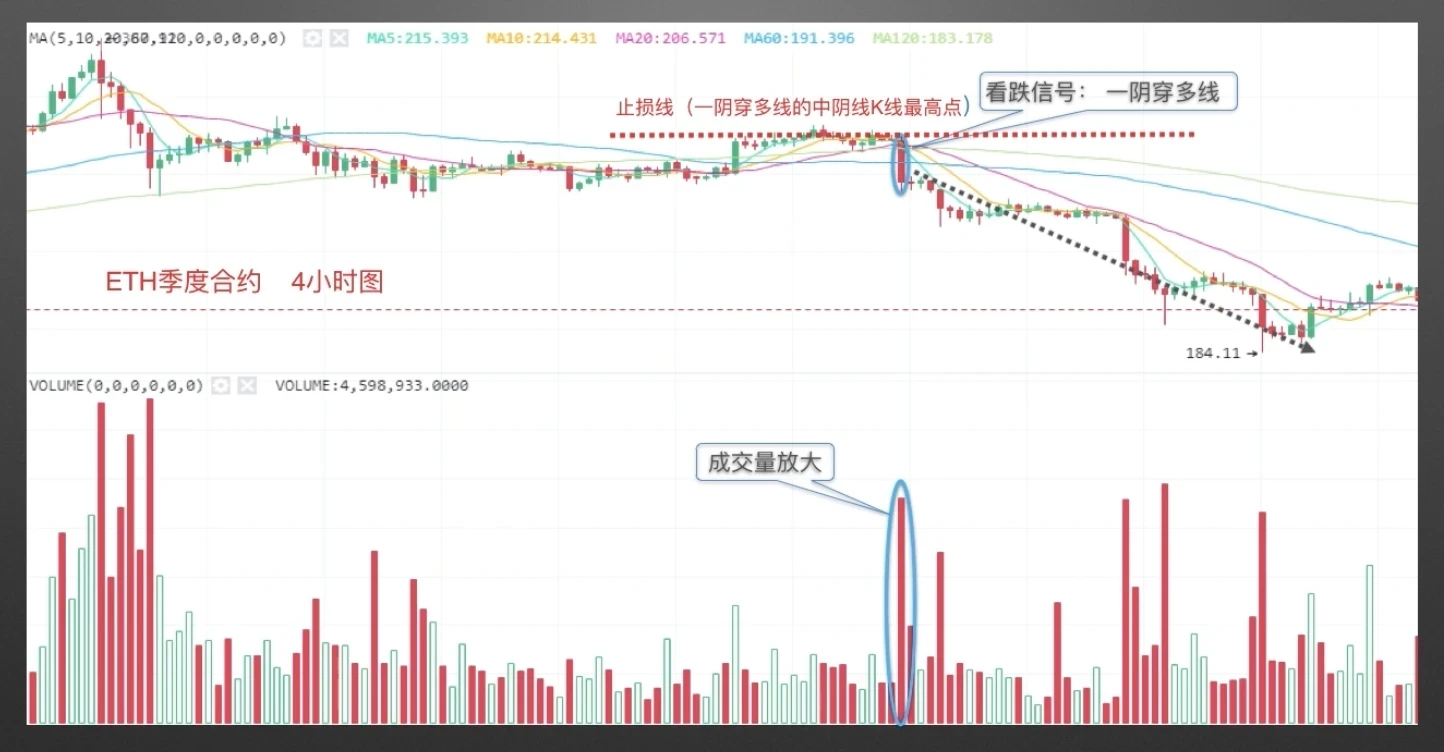
ETH Quarterly Futures 4-Hour Chart. As marked by the blue circle, a bearish candle broke through multiple moving averages, forming a single-candle-through-multi-MA pattern. The trading volume below expanded alongside, triggering a bearish signal. The stop-loss can be set at the high of the bearish candle that broke through the moving averages, as shown by the red dashed line. The moving averages subsequently arranged in a bearish formation, with the price trading below the moving averages.
Disclaimer
This article may contain product-related content that does not apply to your region. This article is intended solely to provide general information and makes no responsibility for any factual errors or omissions herein. This article represents the author's personal views only and does not constitute the views of OKX. This article is not intended to provide any advice, including but not limited to: (i) investment advice or investment recommendations; (ii) offers or solicitations to buy, sell, or hold digital assets; or (iii) financial, accounting, legal, or tax advice. Holdings in digital assets (including stablecoins) involve a high level of risk, may be subject to significant price fluctuations, and may even become worthless. You should carefully consider whether trading or holding digital assets is appropriate for you based on your financial situation. For questions specific to your circumstances, please consult your legal/tax/investment professional. The information contained in this article (including market data and statistics, where applicable) is provided for general reference purposes only. Although all reasonable precautions have been taken in preparing such data and charts, we accept no responsibility for any factual errors or omissions expressed herein. © 2025 OKX. This article may be reproduced or distributed in its entirety, and excerpts of 100 words or fewer from this article may be used, provided that such use is non-commercial in nature. Any reproduction or distribution of the entire article must prominently state: "This article is copyrighted © 2025 OKX, used by permission." Authorized excerpts must cite the article's title and include the source, e.g., "Article Title, [Author Name (if applicable)], © 2025 OKX." Some content may have been generated or assisted by artificial intelligence (AI) tools. Derivative works and other uses of this article are not permitted.
Show More
Recommended Reading

Can You Profit When Bitcoin Falls? How to Trade Futures
As the cryptocurrency market, led by Bitcoin, continues to expand in size, diverse derivative trading products have emerged alongside spot trading as hedging tools, among which futures trading has garnered the most attention. What is futures trading? Futures are the most common form of trading contract in the cryptocurrency derivatives market. Digital asset futures trading refers to buyers and sellers agreeing to trade a specific asset at a predetermined price at a future date.
January 16, 2026

Easier Than Copying Strategies? Copy Top Traders with One Click on OKX and Let Them Earn for You
Whether in traditional finance or the cryptocurrency market, strategy trading is a highly important and critical component of the trading system. When faced with complex trading environments and extreme market conditions, even those with solid theoretical knowledge and extensive trading experience can easily miss trading opportunities or make poor decisions driven by emotions. Strategy trading is an effective tool to address these challenges. Now that you have the trading tools, how do you
November 21, 2025

Part 5. Strategic Trading Series — DCA Bot
Introduction: We often have this thought: During a bull market, there are many digital assets that surge in value. If you could consistently capture assets with large gains — for example, catching one that doubles every month — your assets would grow to 2 to the power of 12, or 4,096 times, over a year. That's an astonishing figure, and of course, it's nearly impossible to achieve because it's very difficult to consistently capture assets that make big moves. This is a common challenge many users face: during a bull market, although
November 3, 2025

Which Countries/Regions Do Not Support OKX Registration
OKX currently does not provide services to customers from the following regions: certain U.S. territories, including New York, Texas, Puerto Rico, American Samoa, Guam, the Northern Mariana Islands, the U.S. Virgin Islands (St. Croix, St. John, and St. Thomas), Cuba, Iran, North Korea, Crimea, Malaysia, Syria, Bangladesh, and Bolivia. For details, please refer to the OKX Terms of Service.
April 25, 2024

Quick Guide to OKX Common Products and Features
OKX (www. okx. com) is one of the world's leading digital asset service platforms, primarily serving global users with spot and derivatives trading services for Bitcoin, Ethereum, and other digital assets, while also exploring the world of DeFi, dApps, NFTs, and GameFi alongside its users. On OKX, you can enjoy seamless spot and futures trading experiences, stay updated on tokens in trending sectors/concepts in real time, and much more.
April 25, 2024

Learn K-Line from Zero | 5 The Importance of K-Line Pattern Application
Price trends speak volumes; trading signals eliminate guesswork. Part 1. Bullish K-Line Patterns at Key Levels In the previous two chapters of this series, we covered the application of bullish and bearish K-line pattern combinations. However, these patterns are not effective in every position. In this section, we will explain why the placement of these patterns matters so much. Where do bullish patterns work best? The first scenario: towards the end of a pronounced uptrend, the
April 25, 2024


