
Learn Candlestick Charts from Zero | 21 Common Analysis Indicators 3—Bollinger Bands
BSV+1. 96%
Price movements follow trends, understand the language of prices;
Buy and sell with signals, say goodbye to emotional Trading.
1. BOLL Bollinger Bands Indicator
Starting from this lesson, we learn the third lecture on technical indicators, which is also a frequently used indicator by investors—the BOLL Bollinger Bands, used as a main chart indicator.
So what exactly does the BOLL Bollinger Bands indicator look like in reality?
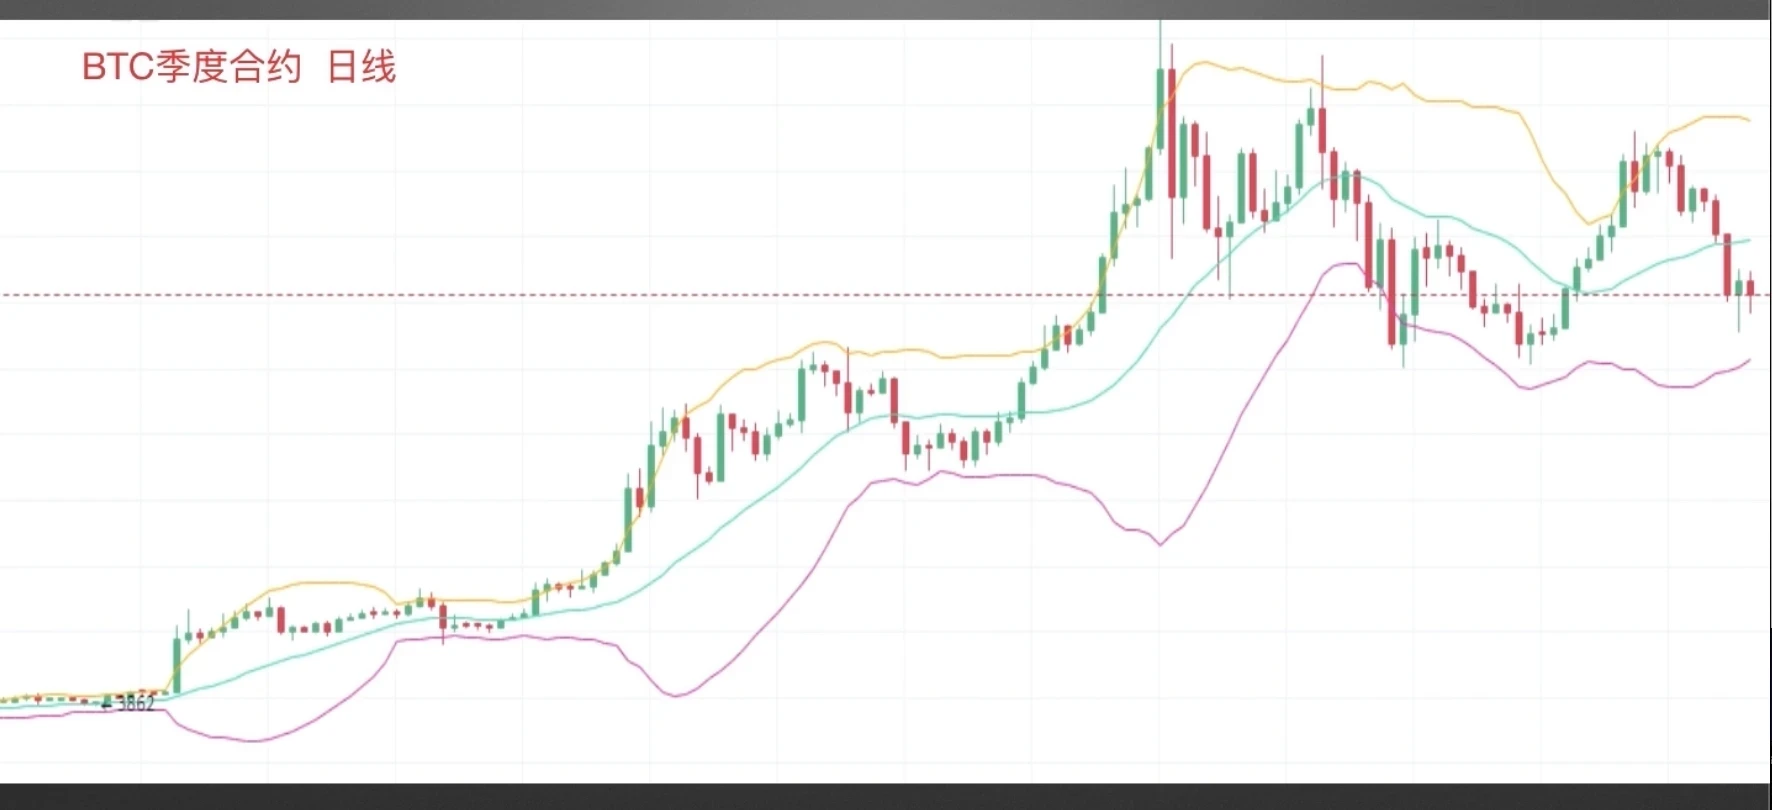
BTC quarterly contract daily chart. From the chart, we can see that Bollinger Bands consist of three curves: the upper band (yellow line) that acts as resistance, the core moving average middle band (blue line), and the lower band (purple line) that acts as support.
The Bollinger Bands indicator was invented by American stock market analyst John Bollinger. It is designed based on the standard deviation principle in statistics. The BOLL indicator is transliterated as "Bollinger" and is commonly known as Bollinger Bands due to its band-like shape.
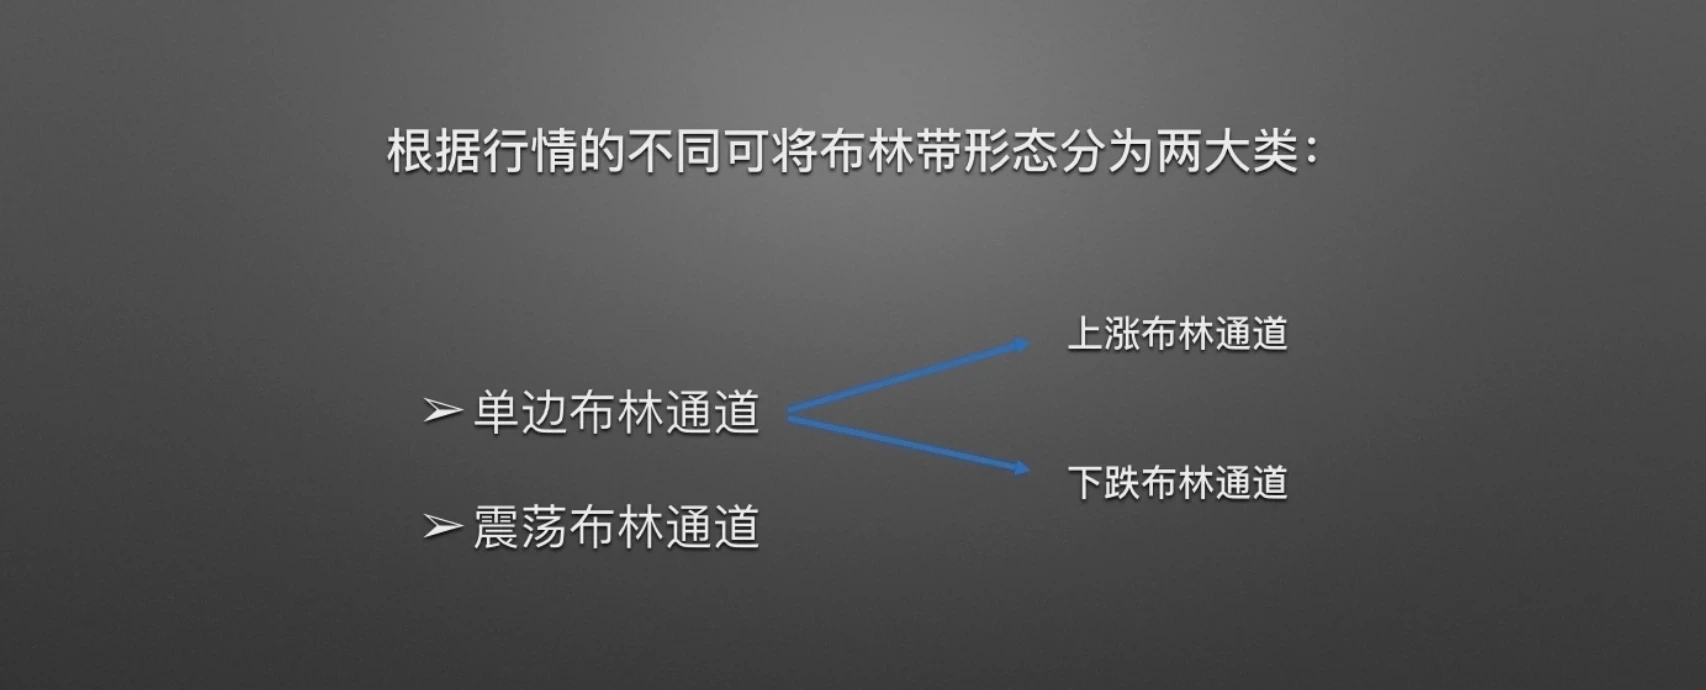
According to different market conditions, Bollinger Bands patterns can be divided into two major categories: trending Bollinger channels and ranging Bollinger channels. Trending Bollinger channels are further divided into upward Bollinger channels and downward Bollinger channels.
Let's look at a set of real cases.
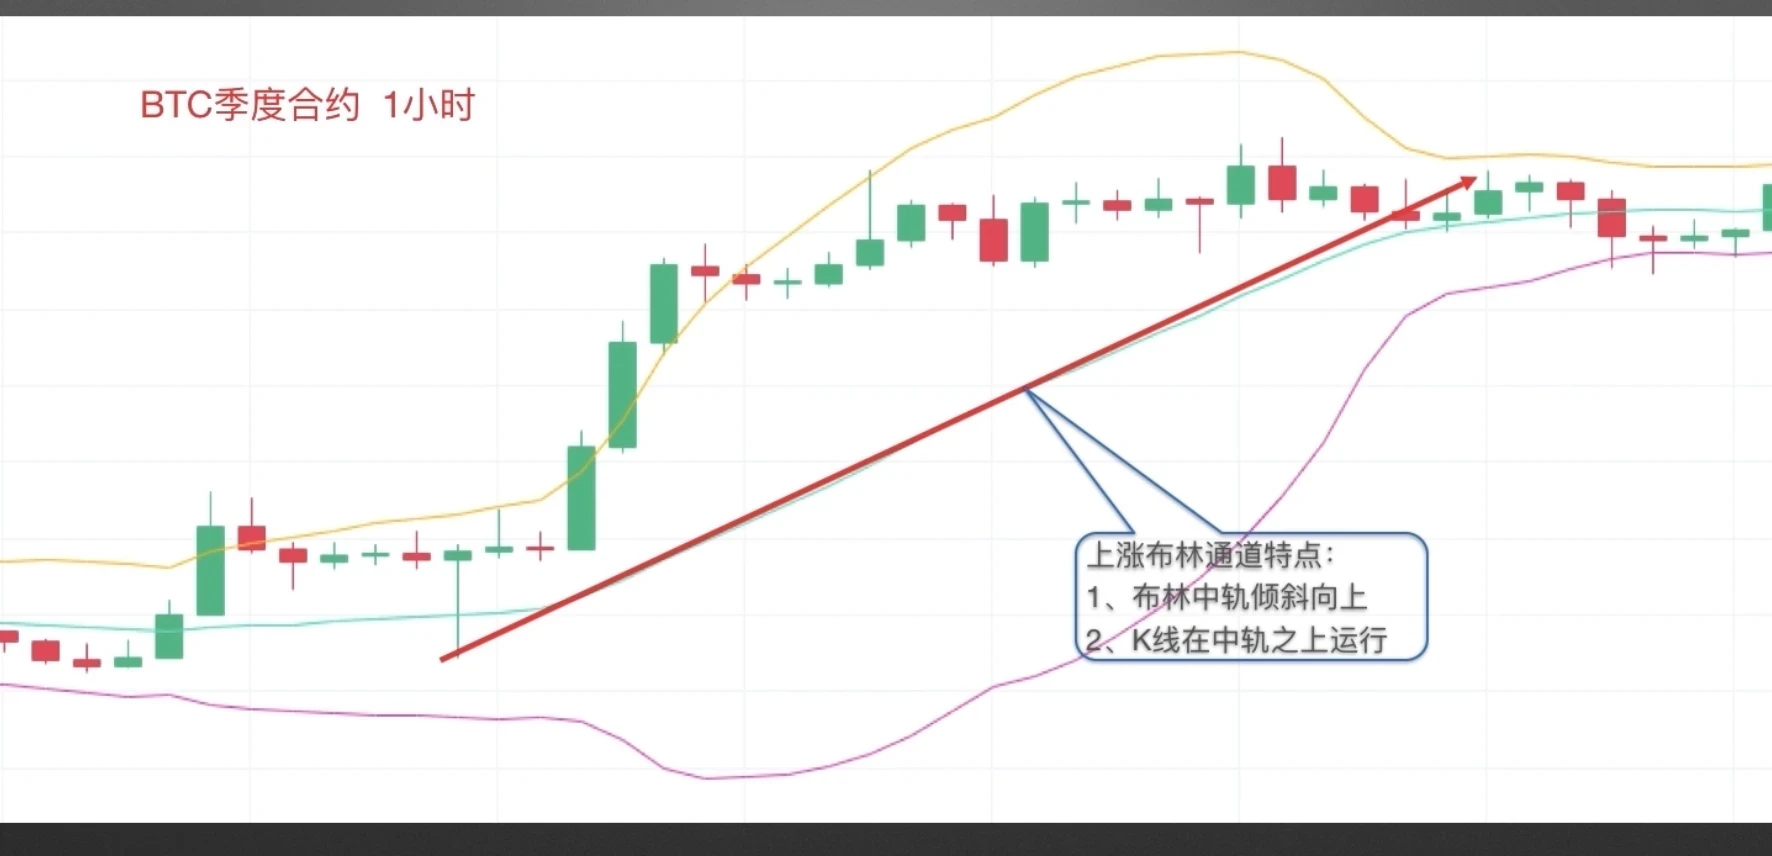
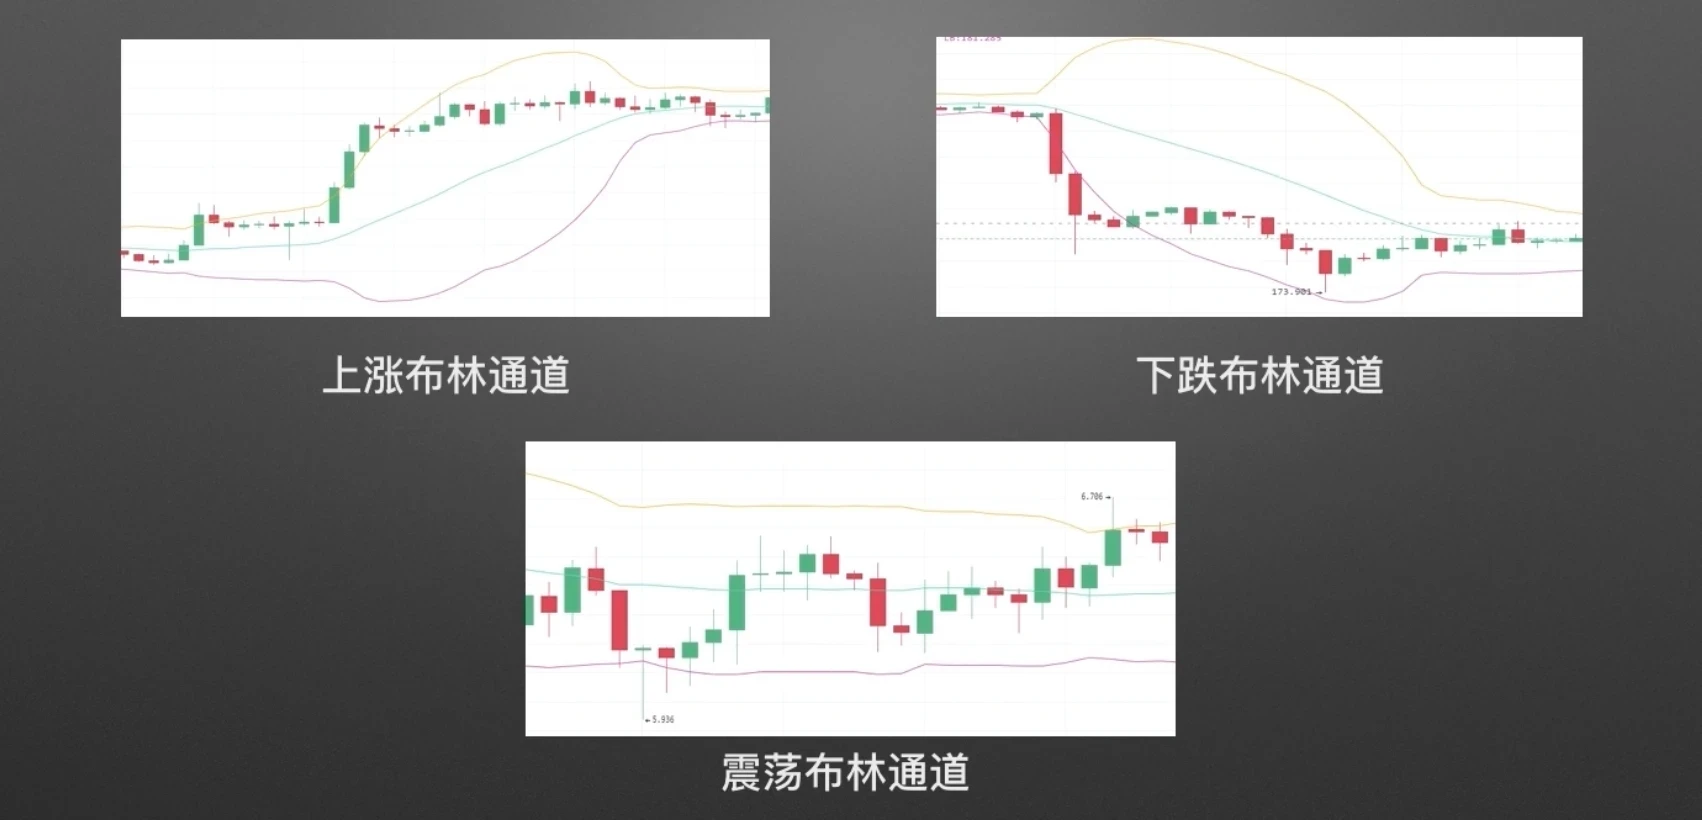
First, let's look at the upward Bollinger channel. The screenshot is from the OKX BTC quarterly contract 1-hour chart. What are the characteristics of an upward Bollinger channel? When the Bollinger middle band slopes upward, and candlesticks consistently run above the middle band, this is an upward Bollinger channel.
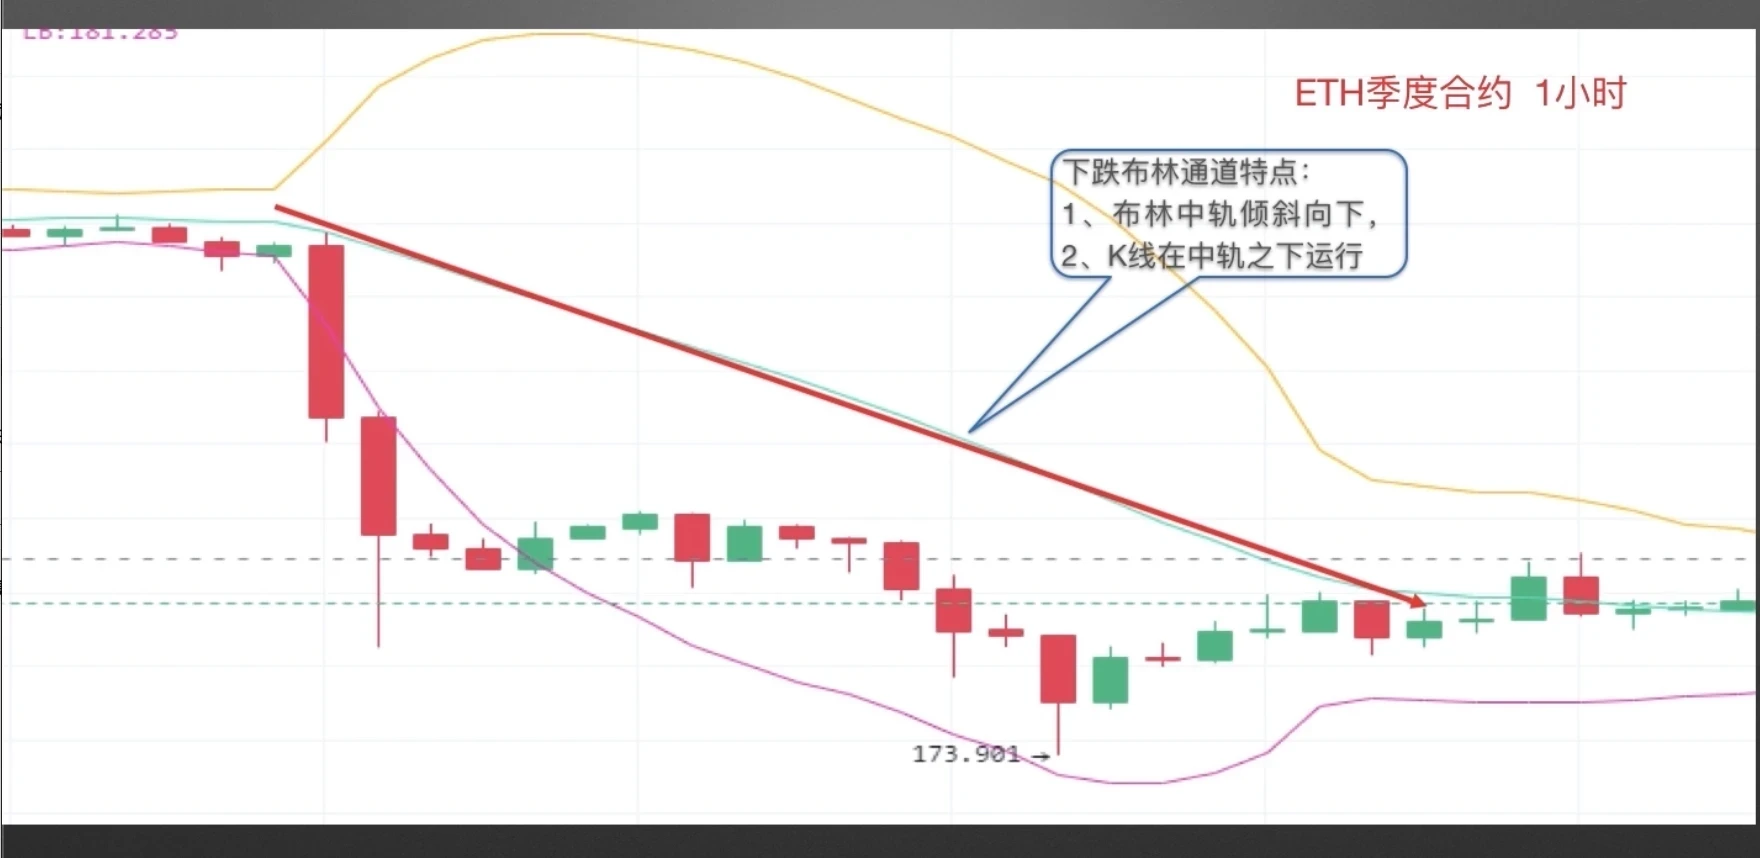
Next, let's look at the downward Bollinger channel. The screenshot is from the OKX ETH quarterly contract 1-hour chart. When the Bollinger middle band slopes downward, and candlesticks consistently run below the middle band, it can be determined as a downward Bollinger channel.
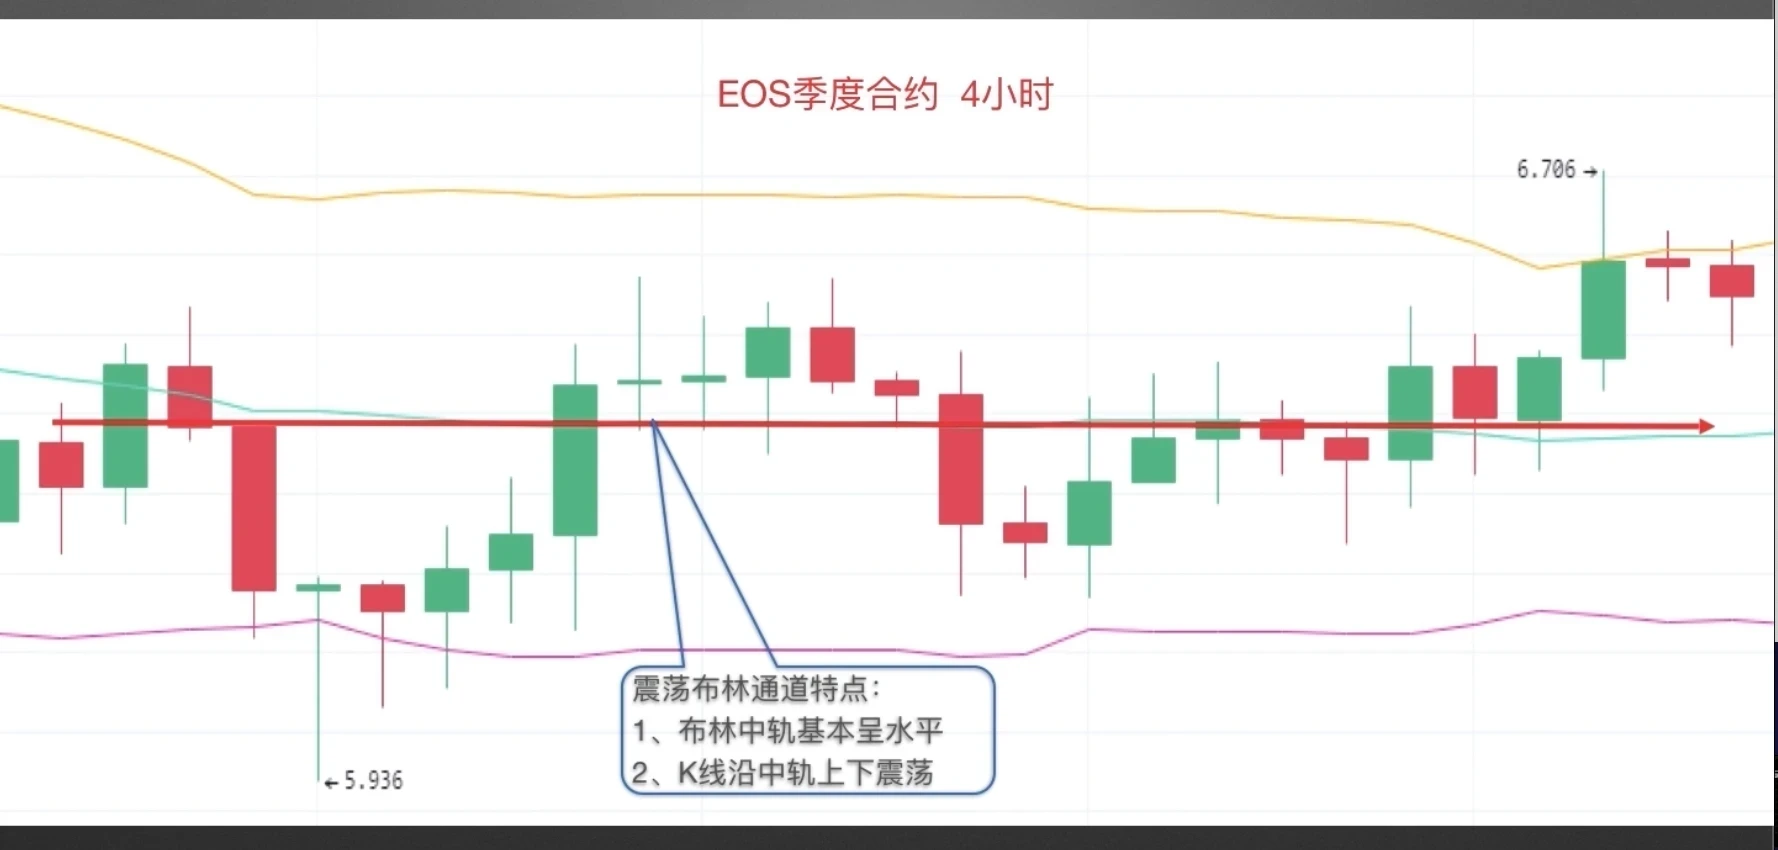
Finally, let's look at the ranging Bollinger channel. The screenshot is from the OKX EOS quarterly contract 4-hour chart. When the Bollinger middle band is basically horizontal, and candlesticks oscillate up and down around the Bollinger middle band, it can be classified as a ranging Bollinger channel.
2. Application Rules of BOLL Bollinger Bands Indicator
After learning these three types of Bollinger channels, how can we determine market trend transitions through BOLL patterns?
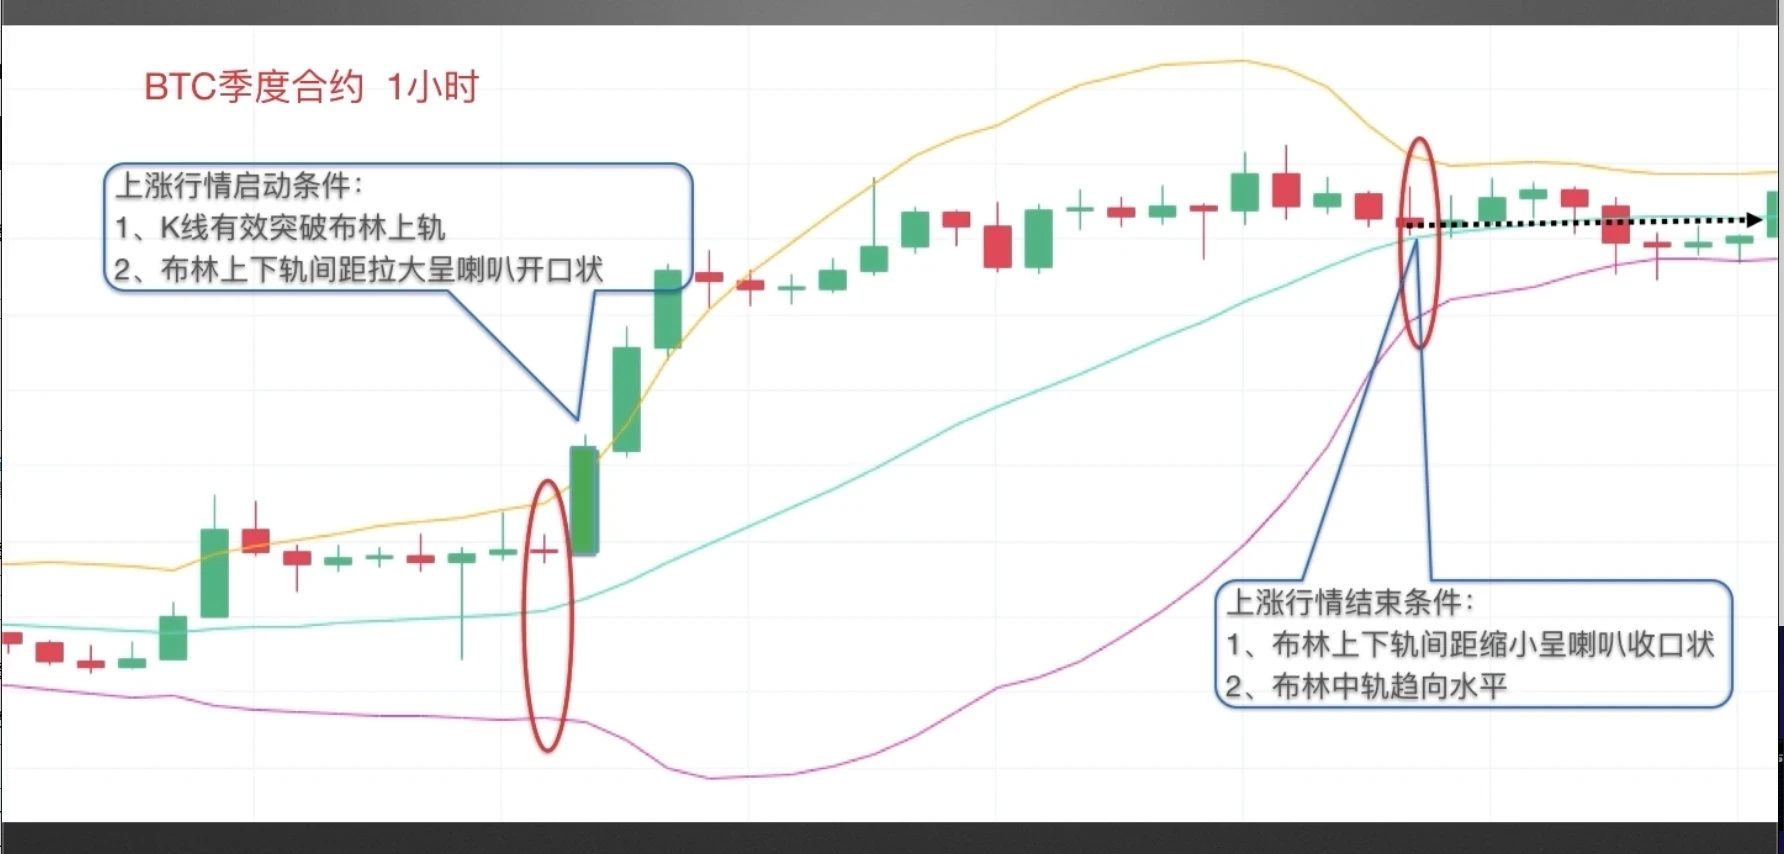
First, let's look at the signal points that appear in a range-to-upward trend. The screenshot is from the OKX BTC quarterly contract 1-hour chart. The left side of the chart shows a ranging market. As a medium-sized bullish candlestick effectively breaks through the Bollinger upper band, the distance between the upper and lower bands expands in a trumpet opening shape, indicating that a one-sided upward trend is approaching. Candlesticks consistently run above the Bollinger middle band until the Bollinger upper band starts to turn downward, the distance between the upper and lower bands shrinks in a trumpet closing shape, and the Bollinger middle band tends toward horizontal, indicating the end of this upward trend, followed by a ranging market.
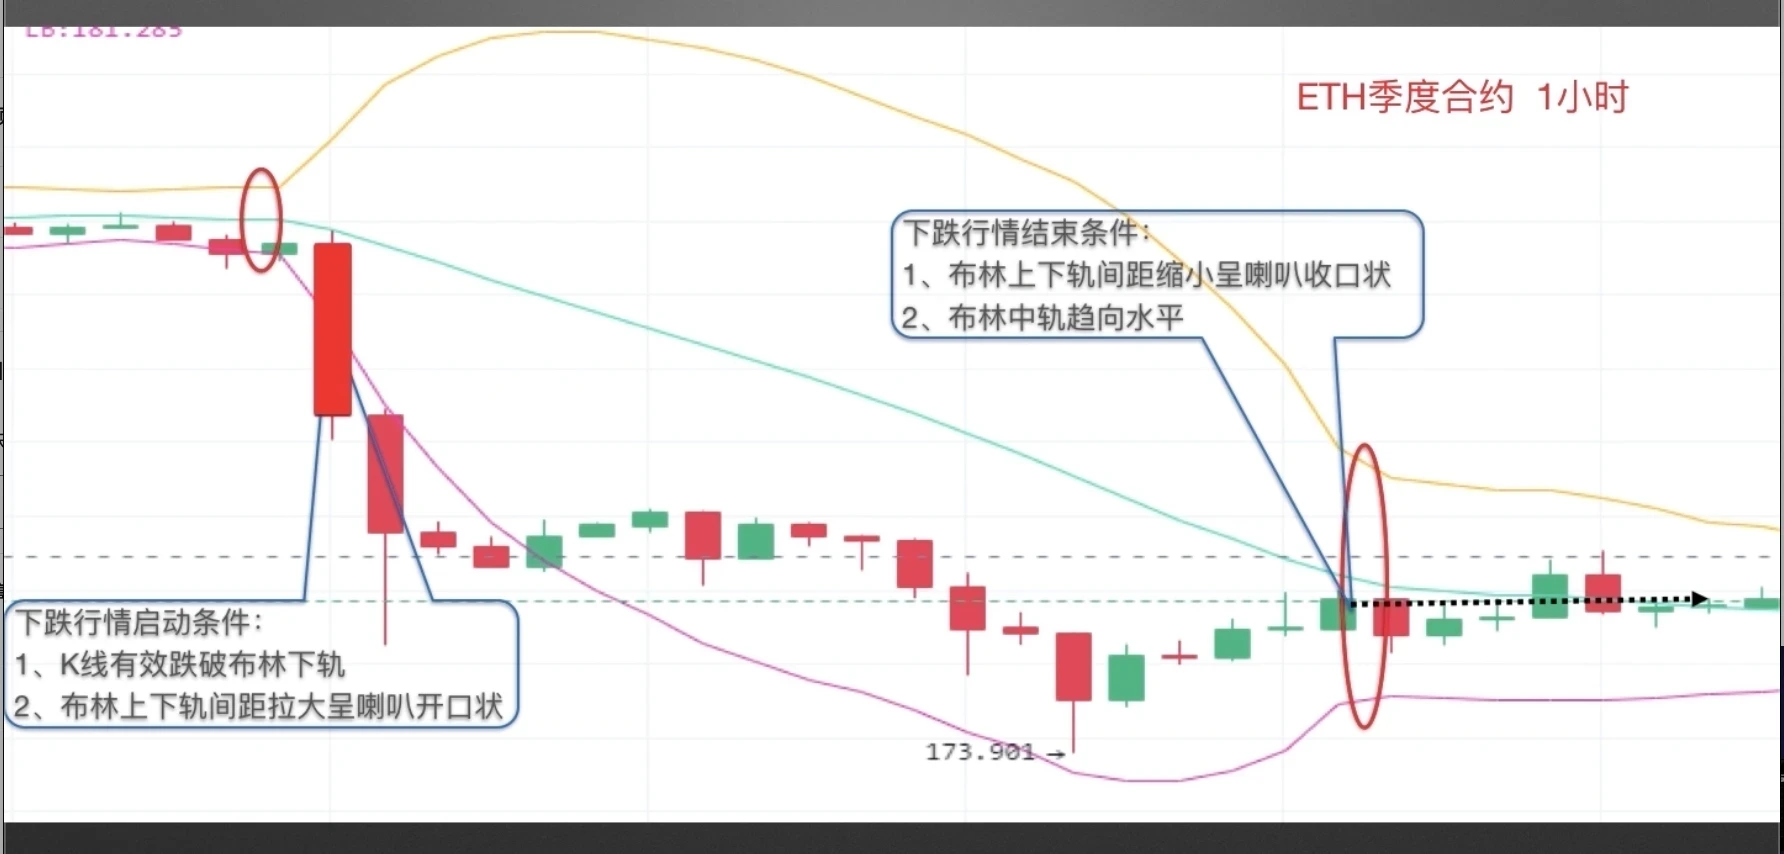
Let's also look at the signal points that appear in a range-to-downward trend. The screenshot is from the OKX ETH quarterly contract 1-hour chart. The left side of the chart shows a narrow range oscillation where candlesticks run below the Bollinger middle band. As a medium-sized bearish candlestick effectively breaks below the lower band, the distance between the Bollinger upper band and lower band significantly expands in a trumpet opening shape, indicating that a one-sided downward trend is approaching. Afterwards, candlesticks consistently run below the Bollinger middle band until the Bollinger Bands form a closing shape, and the Bollinger middle band tends toward horizontal, indicating the end of this downward trend, followed by a ranging market.
Let's explain the usage of the Bollinger Bands indicator with real cases.
We'll provide one example each for upward trends, downward trends, and ranging trends.
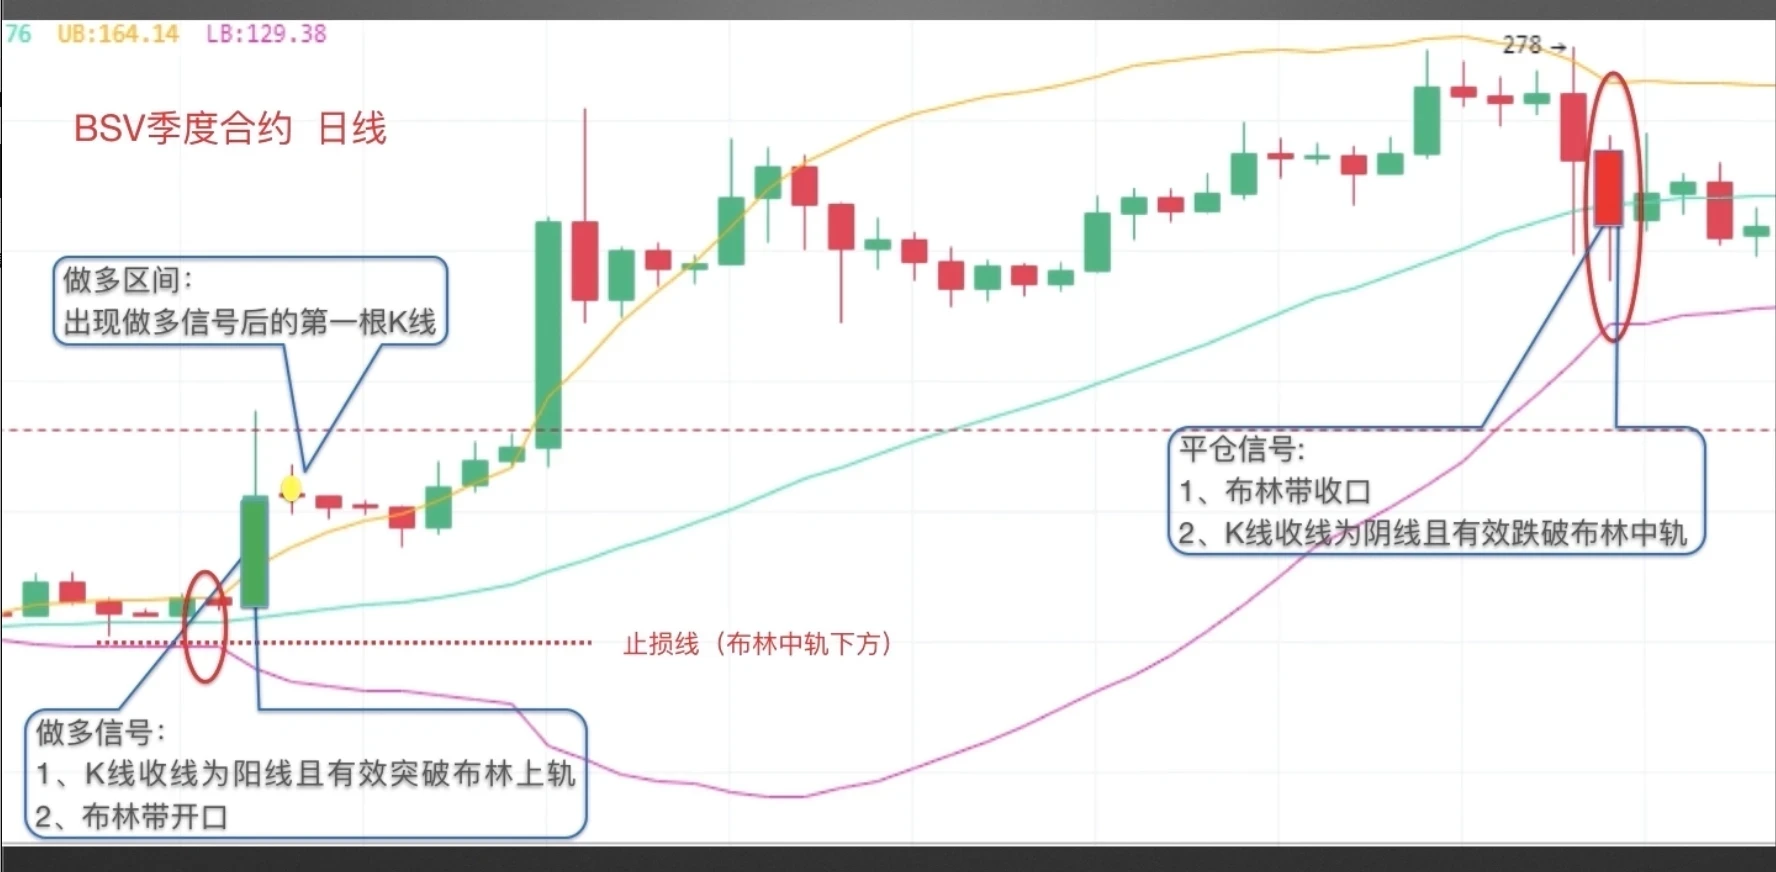
First, let's look at the upward trend. The screenshot is from the OKX BSV quarterly contract daily chart. A medium-sized bullish candlestick effectively breaks through the Bollinger upper band, the Bollinger Bands form an opening, and a long signal appears. The following first candlestick (as marked by the yellow dot on the left side of the chart) is the long entry zone. Stop-loss can be set below the Bollinger middle band (as shown by the red dashed line). In the upward trend, the price runs above the Bollinger middle band until the Bollinger Bands form a closing, the candlestick closes as a bearish candle and effectively breaks below the Bollinger middle band, forming an end-of-upward-trend signal. It is recommended to close long positions.
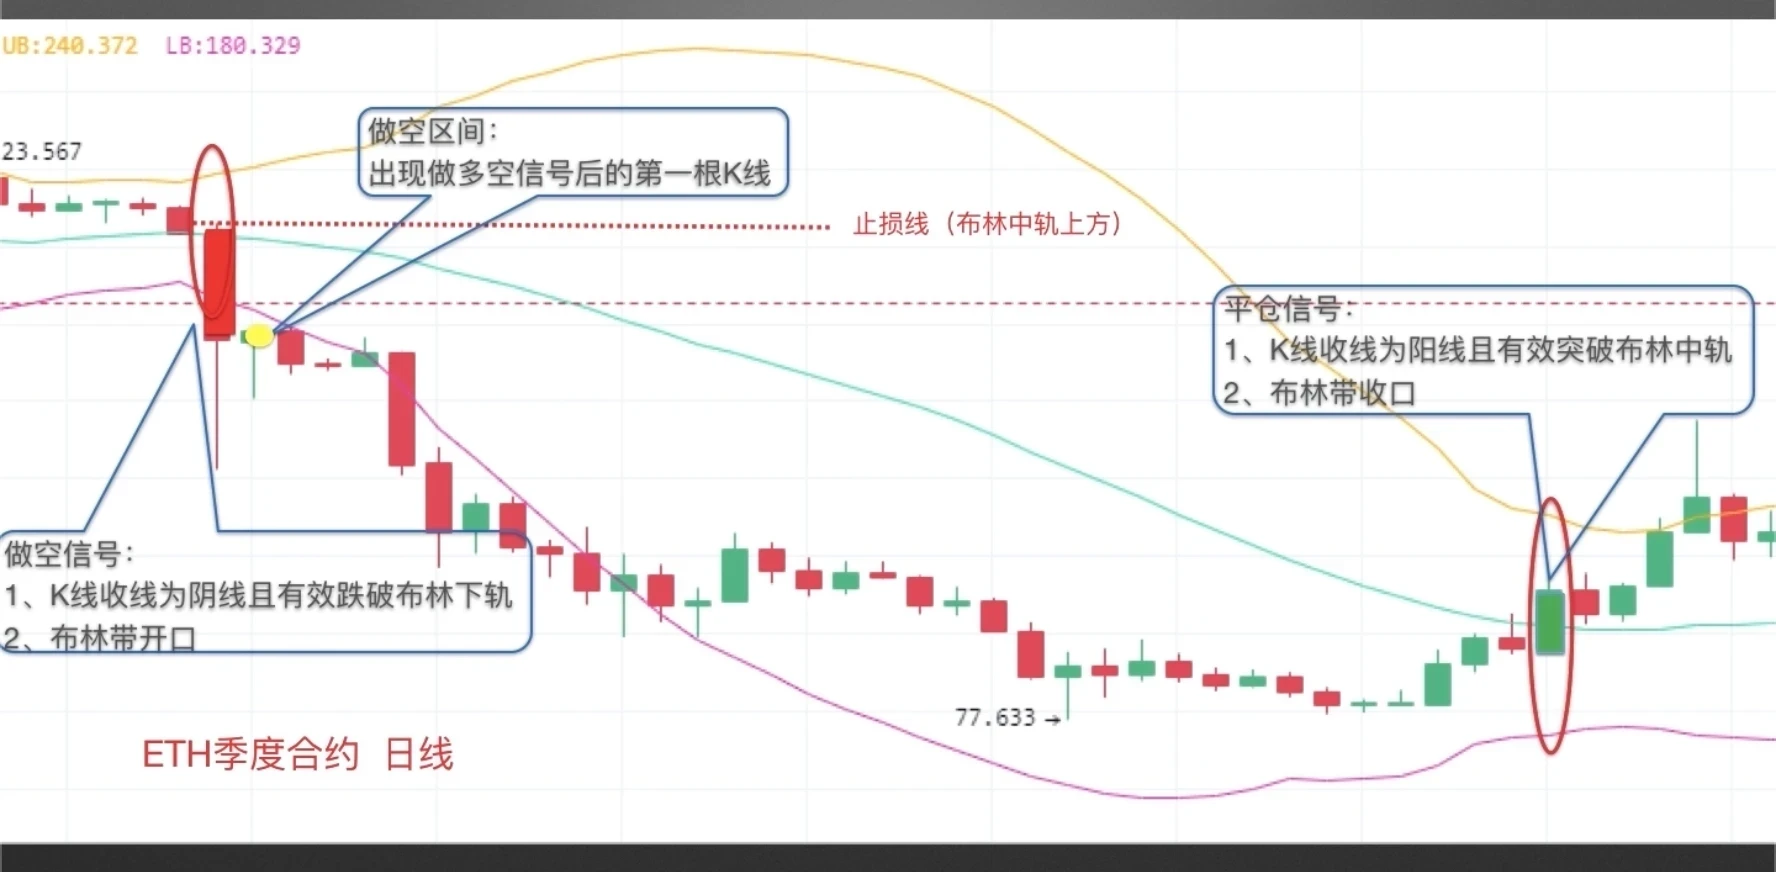
Similarly, the downward trend case screenshot is from the OKX ETH quarterly contract daily chart. When a medium-sized bearish candlestick effectively breaks below the Bollinger lower band, the Bollinger Bands form an opening, and a short signal appears. The following first candlestick is the short entry zone (as marked by the yellow dot in the chart). Stop-loss can be set above the Bollinger middle band (as shown by the red dashed line). In the downward trend, the price consistently runs below the Bollinger middle band until the Bollinger Bands form a closing, the candlestick closes as a bullish candle and effectively breaks through the Bollinger middle band, forming an end-of-downward-trend signal. It is recommended to close short positions.
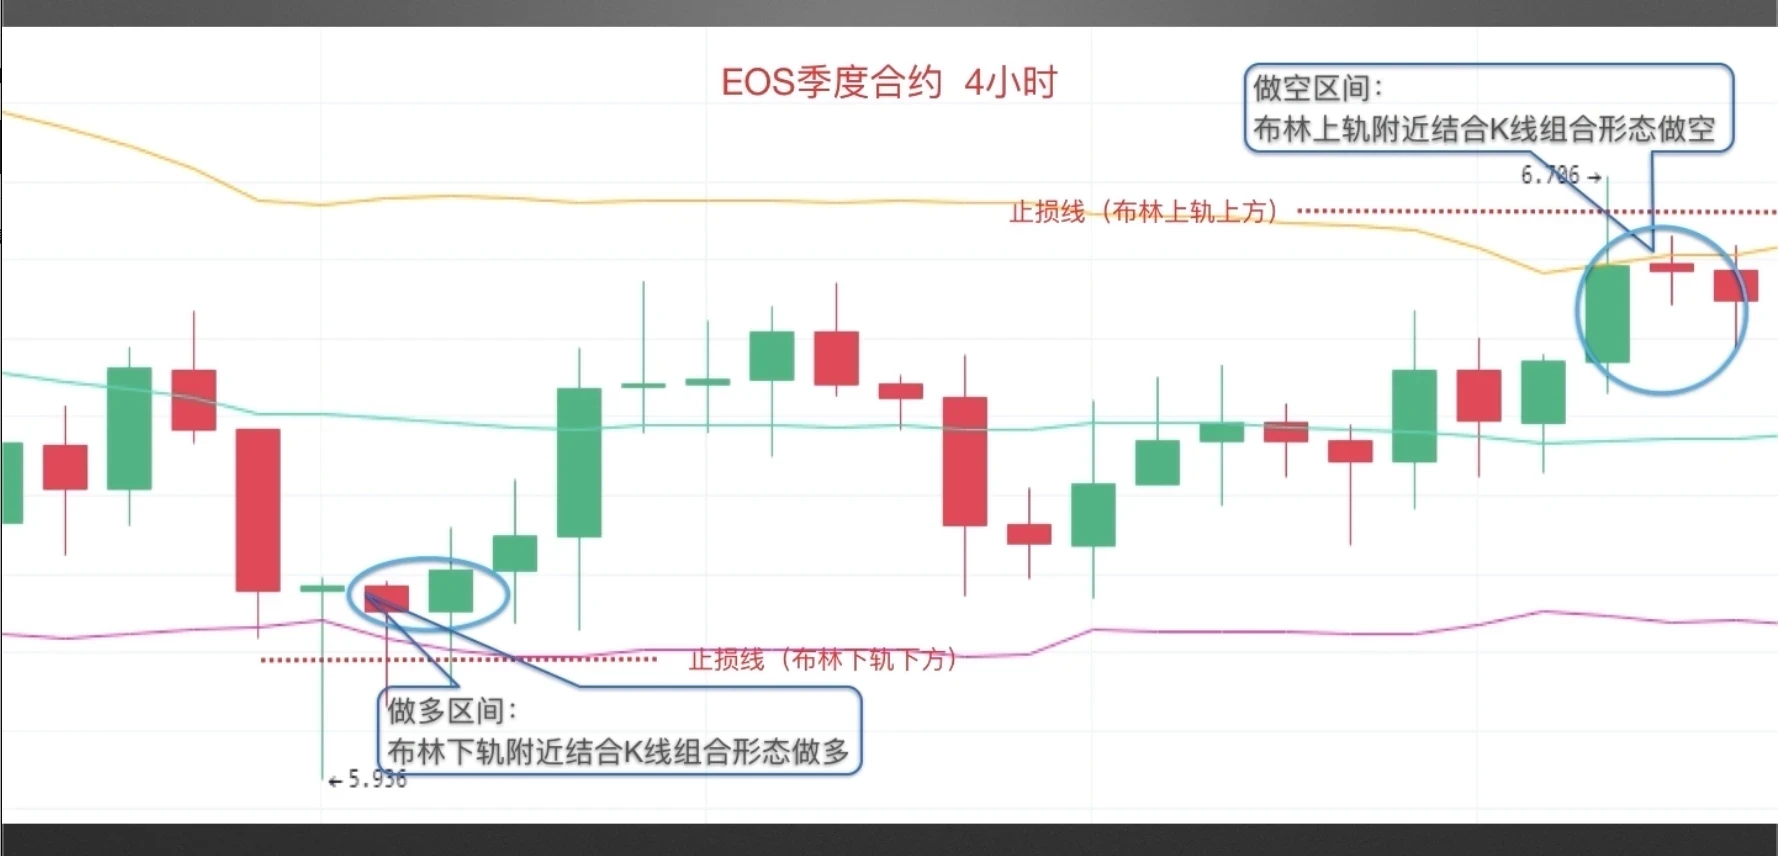
Finally, the ranging trend case screenshot is from the OKX EOS quarterly contract 4-hour chart. In a ranging market, when candlesticks effectively break below the Bollinger middle band, if the price approaches the Bollinger lower band and simultaneously shows bullish candlestick combinations such as the Morning Star or Bullish Engulfing mentioned in Chapter 1 Section 3, this is a bullish signal. Stop-loss can be set below the Bollinger lower band. When candlesticks effectively break through the Bollinger middle band, if the price continues to approach the Bollinger upper band and simultaneously shows bearish candlestick combinations such as the Evening Star or Bearish Engulfing mentioned in Chapter 1 Section 4, this is a bearish signal. Stop-loss can be set above the Bollinger upper band.
At the end of this lesson, let's provide a simple risk warning regarding the usage of the Bollinger Bands indicator:
First, in narrow-range ranging markets, it is not recommended for investors to engage in frequent Trading;
Second, in one-sided trends, when candlesticks are above the Bollinger middle band, focus on long positions; when candlesticks are below the Bollinger middle band, focus on short positions; Third, a single technical indicator has limitations in determining market conditions. It is recommended that investors use the Bollinger Bands indicator in combination with other technical indicators for better results.
Disclaimer
This article may contain content related to products that are not available in your region. This article is intended to provide general information only and does not assume responsibility for any factual errors or omissions contained herein. This article represents only the author's personal views and does not represent the views of OKX. This article is not intended to provide any of the following advice, including but not limited to: (i) investment advice or investment recommendations; (ii) offers or solicitations to buy, sell, or hold digital assets; or (iii) financial, accounting, legal, or tax advice. Holding digital assets (including stablecoins) involves high risk, may fluctuate significantly, and may even become worthless. You should carefully consider whether trading or holding digital assets is suitable for you based on your financial situation. For questions regarding your specific situation, please consult your legal/tax/investment professional. The information appearing in this article (including market data and statistics, if any) is for general reference only. Although we have taken all reasonable precautions in preparing these data and charts, we assume no responsibility for any factual errors or omissions expressed herein. © 2025 OKX. This article may be reproduced or distributed in its entirety, or excerpts of 100 words or less from this article may be used, provided that such use is non-commercial. Any reproduction or distribution of the entire article must also prominently state: "Copyright © 2025 OKX. Used with permission." Permitted excerpts must cite the article name and include attribution, such as "Article Name, [Author Name (if applicable)], © 2025 OKX". Portions of this content may be generated or assisted by artificial intelligence (AI) tools. Derivative works or other uses of this article are not permitted.
Show More
Recommended Reading

Profit from Bitcoin declines? How to conduct contract Trading
As the cryptocurrency market scale represented by Bitcoin continues to expand, various forms of derivatives trading have gradually emerged beyond spot trading as a tool to hedge risk. Among them, contract trading has received the most attention. What is contract trading? Contracts are the most common trading contract form in the cryptocurrency derivatives market. Digital asset contract trading refers to buyers and sellers agreeing to trade a certain asset at a specified price at a future time.
January 16, 2026

Simpler than copy strategies? One-click follow the best strategy traders on OKX, let traders earn money for you
Whether in traditional finance or the cryptocurrency market, strategy trading is a very important and crucial method in the trading system. When facing complex trading environments and extreme trading conditions, even with solid theoretical knowledge and rich trading experience, it's easy to miss trading opportunities or make wrong judgments and operations due to emotional influence. Strategy trading is precisely an effective tool that can solve these problems. Now that you have trading tools, how do you use them
November 21, 2025

5. Strategy Trading Series Course—Earn Savings
Preface: We often have such speculation: In bull markets, there are many digital assets with significant gains. If we can continuously capture assets with large increases, for example, catching a doubling digital asset every month, after one year your assets will become 2 to the power of 12, that is, 4096 times. This is very amazing, of course, this is also almost impossible to complete, because we find it difficult to continuously catch assets with large increases. This is also a problem many users encounter: In bull markets, although
November 3, 2025

Which countries/regions do not support registration to use OKX
OKX currently does not provide services to customers in the following regions: Certain US territories, such as New York, Texas, Puerto Rico, American Samoa, Guam, Commonwealth of the Northern Mariana Islands, US Virgin Islands (St. Croix, St. John, and St. Thomas), Cuba, Iran, North Korea, Crimea, Malaysia, Syria, Bangladesh, and Bolivia. For details, please refer to the OKX Terms of Service.
April 25, 2024

Quickly understand OKX common products and features
OKX (www. okx. com) is one of the world's famous digital asset service platforms, mainly providing Bitcoin, Ethereum, and other digital asset spot and derivatives trading services to global users, while also exploring the world of DeFi, dApps, NFTs, and GameFi together with users. On OKX, you can enjoy smooth trading experiences such as spot and contract trading, keep up with token information in hot areas/concepts for the first time, and also
April 25, 2024

Learn Candlestick Charts from Zero | 5 Importance of Candlestick Pattern Applications
Price movements follow trends, understand the language of prices; buy and sell with signals, say goodbye to emotional trading. 1. Bullish Candlestick Combinations at Key Positions In the first two sections of this chapter, we explained the applications of bullish and bearish candlestick combinations, but these combinations are not effective in any position. In this section, we will explain the importance of where combinations appear. In which positions can bullish combinations play a better role? The first situation: In a clear upward trend, near the previous
April 25, 2024


