
Zero Basics to Learn K-Line | 3 Bullish K-Line Patterns
EOS+8. 75%
Price movements follow trends — learn to read the language of price;
Trading signals replace guesswork — make informed Trading decisions.
In this chapter, we explore the application of K-line combinations. Today we share bullish K-line patterns.
I. Bullish K-Line Pattern — Morning Star
Darkness is about to fade, and a beautiful new day is on the horizon. The appearance of a Morning Star signals that the price is about to embark on an upward move.

What kind of K-line combination qualifies as a Morning Star? As shown by the red markup in the chart.
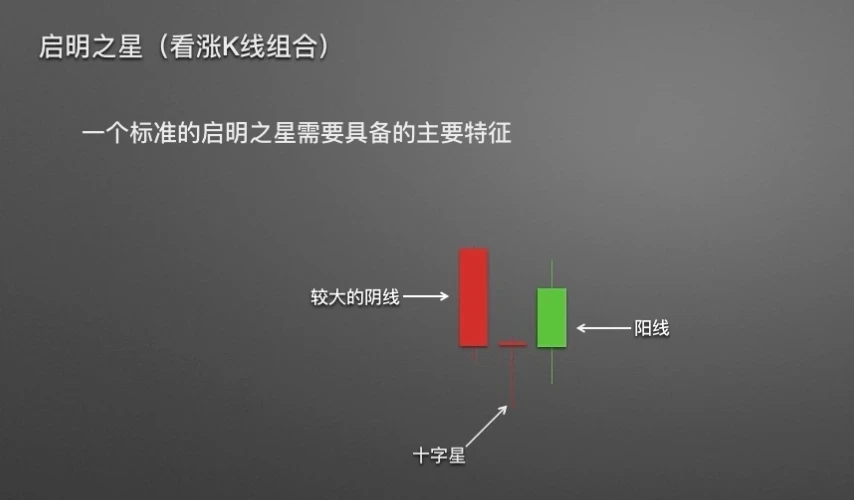
A standard Morning Star is formed by three consecutive K-lines: first, a relatively large bearish candle; followed by a star-like line resembling a "cross" (doji); and then a third relatively large bullish candle. For the Morning Star pattern to be valid, the third bullish candle has a specific requirement — its closing price must be above the 50% level of the first bearish candle's body.
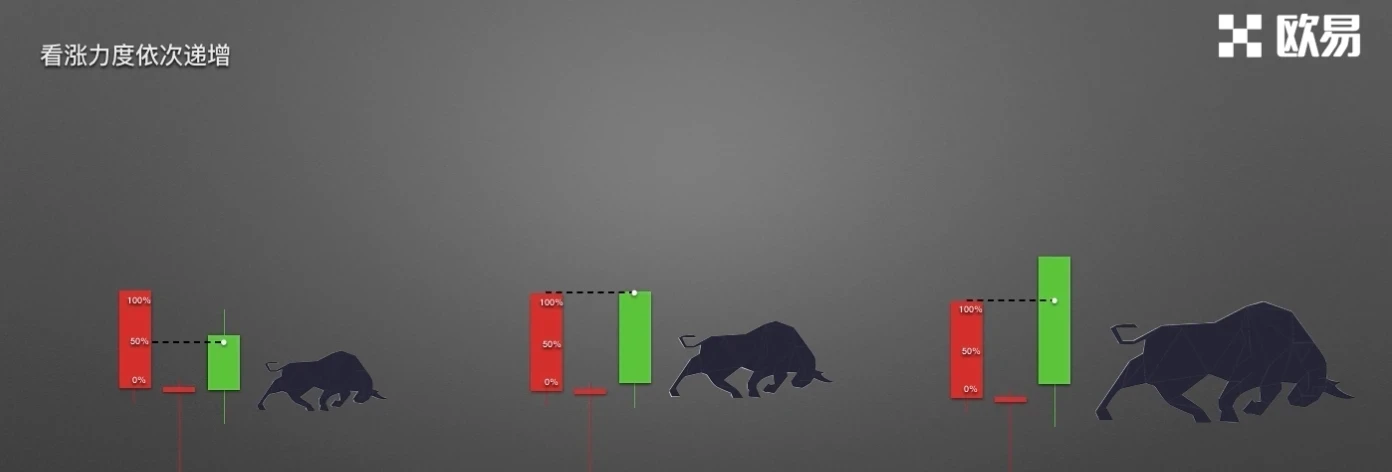
Once a valid Morning Star is confirmed, we can also gauge the strength of the bullish momentum by looking at where the third bullish candle closes. As shown in the chart: if the closing price barely clears the 50% passing threshold, the bullish momentum is relatively weak. If the third bullish candle closes at the same level as the first bearish candle's opening price, the bullish momentum is considered strong. If the third bullish candle closes significantly above the first bearish candle's opening price, the bullish momentum is even stronger.
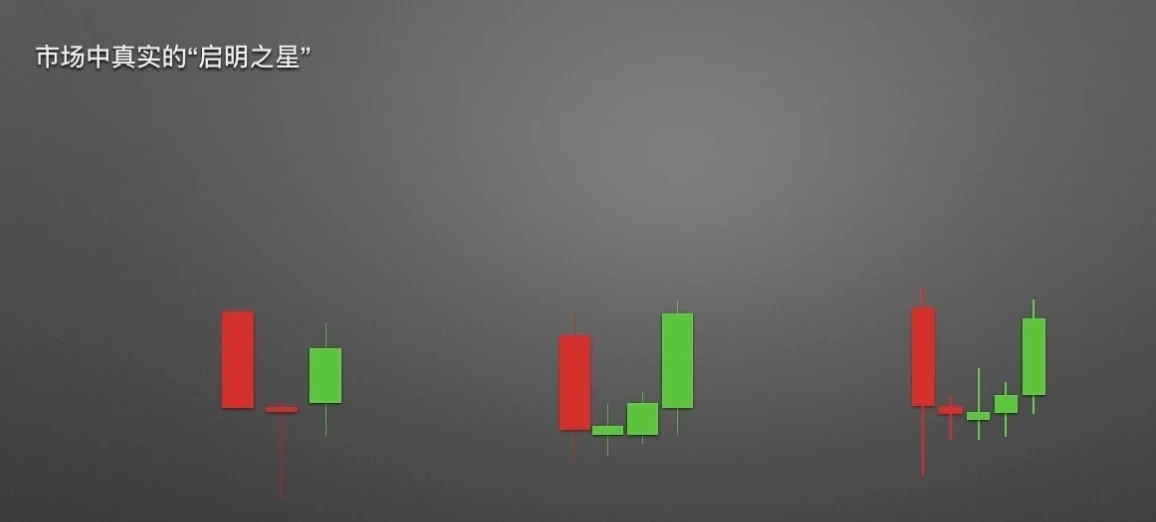
What we just discussed represents the most standard Morning Star pattern. However, in actual price movements, Morning Stars can take various forms. So what does a real-market Morning Star look like?
For example, here are three variations of the Morning Star. Example 1: the middle is not a "cross" star, but more like a "T-shape" line. Let's look at it in a real price chart.
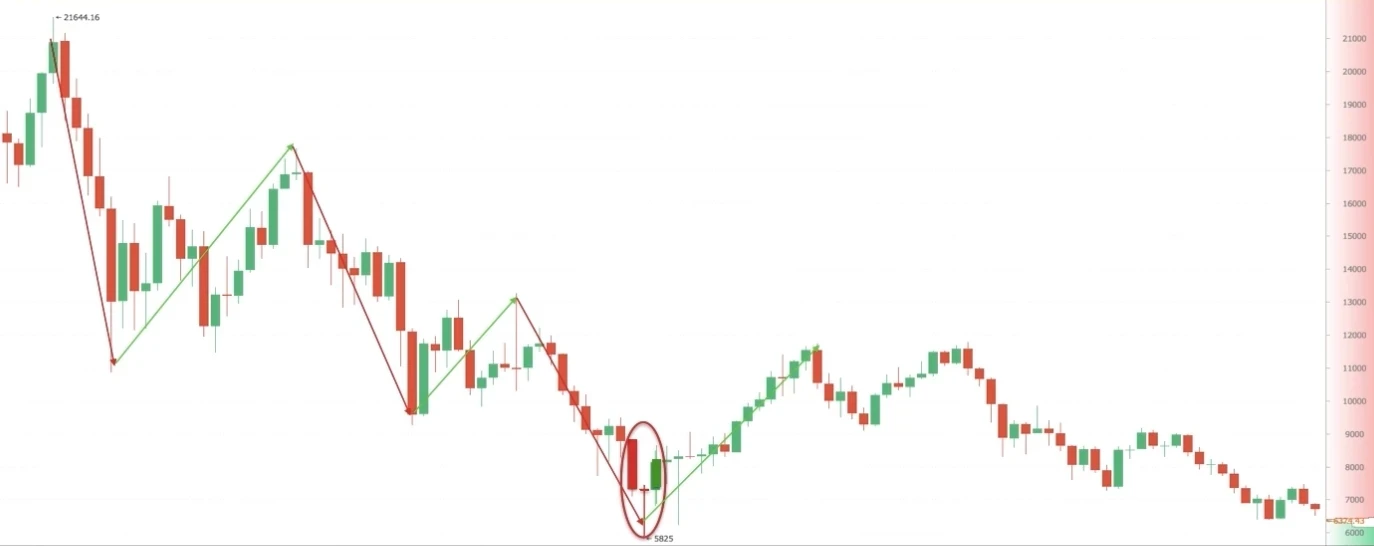
The price plummeted, a Morning Star formed, and the price later bottomed out and rebounded.
Example 2: the middle is composed of two small K-lines. The price formed a Morning Star during an uptrend, and the price continued to rise afterward.
Example 3: composed of three small K-lines or star lines. The price dropped sharply, a Morning Star appeared, and the price subsequently bottomed out and reversed.
II. Bullish K-Line Pattern — Bullish Engulfing
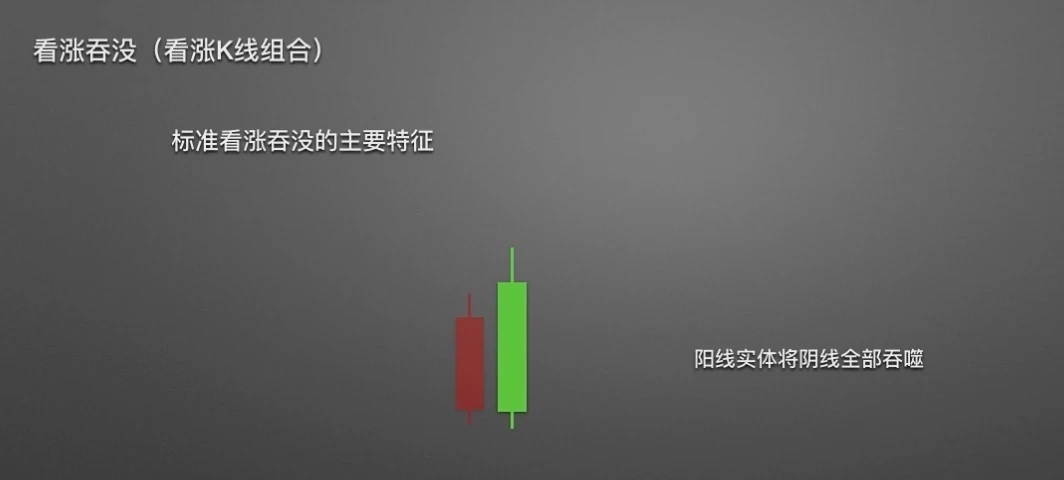
First, let's look at the characteristics of a Bullish Engulfing pattern. The body of the later bullish candle completely covers the body of the preceding bearish candle, as if the bearish candle were swallowed up by the bullish one — signaling that bullish forces are mounting a strong counterattack. Hence the name "Bullish Engulfing."
How to assess the strength of the bullish signal?
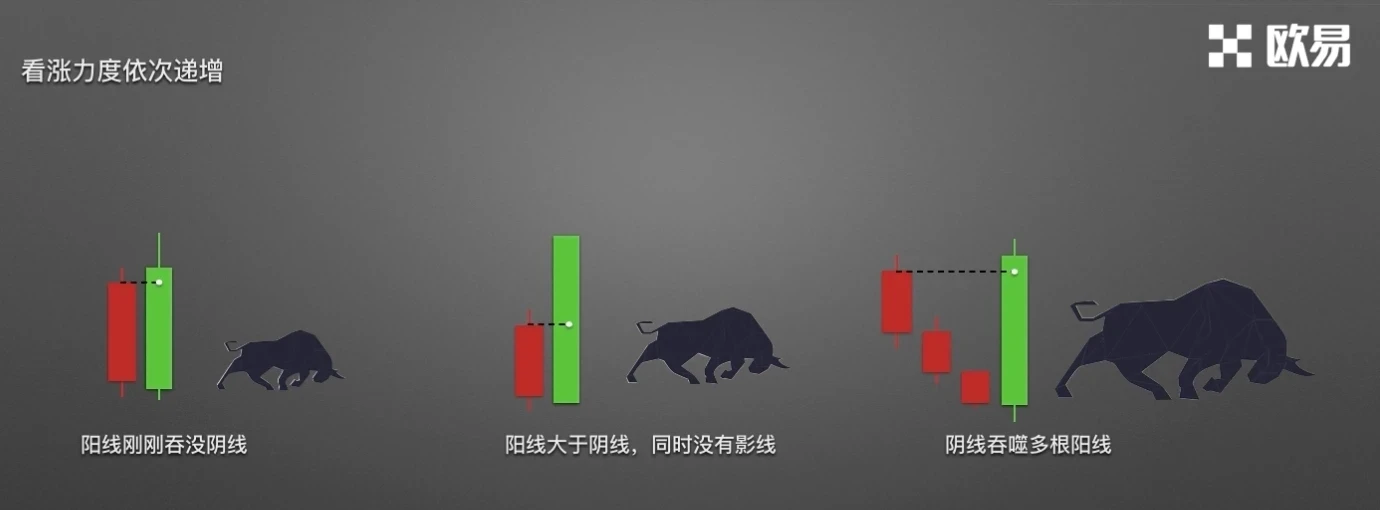
Example 1: The bullish candle barely engulfs the preceding bearish candle — the bullish signal is the weakest. Example 2: The bullish candle body is significantly larger than the preceding bearish candle, even reaching nearly twice its size — the bullish signal is strong. Example 3: The bullish candle engulfs multiple preceding bearish candles in one sweep — the bullish signal is the strongest.
There are many non-standard Bullish Engulfing patterns in the market. So what does a real-market "Bullish Engulfing" look like?
For example, here are three variations. Note that the bullish candle does not need to fully engulf the wicks of the preceding bearish candle.
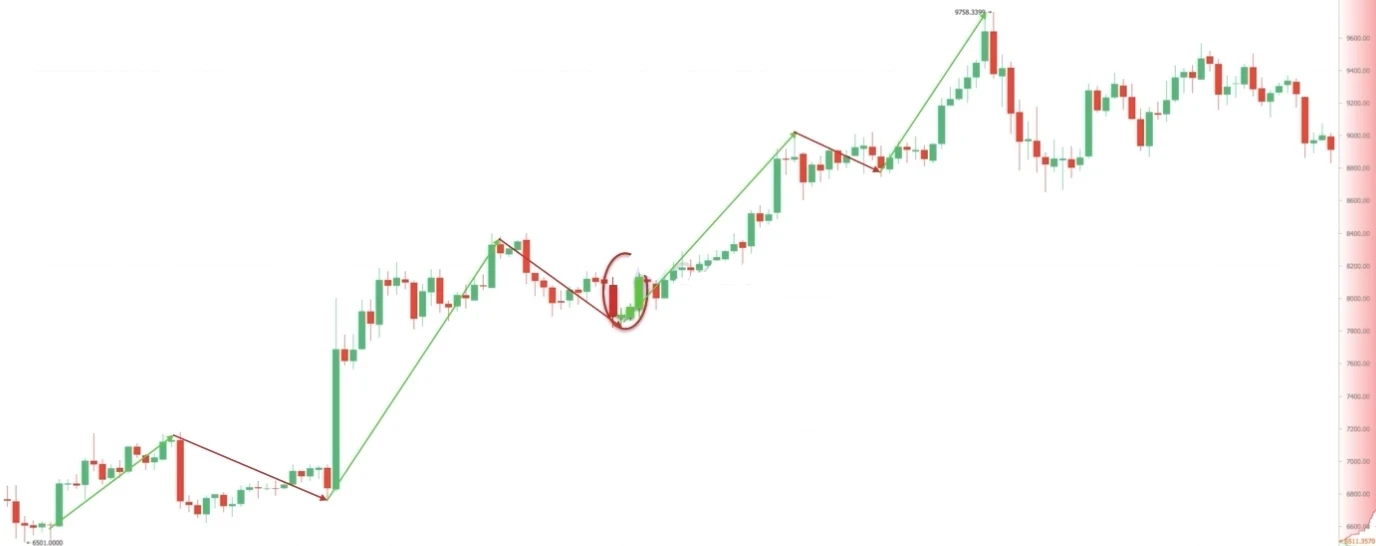
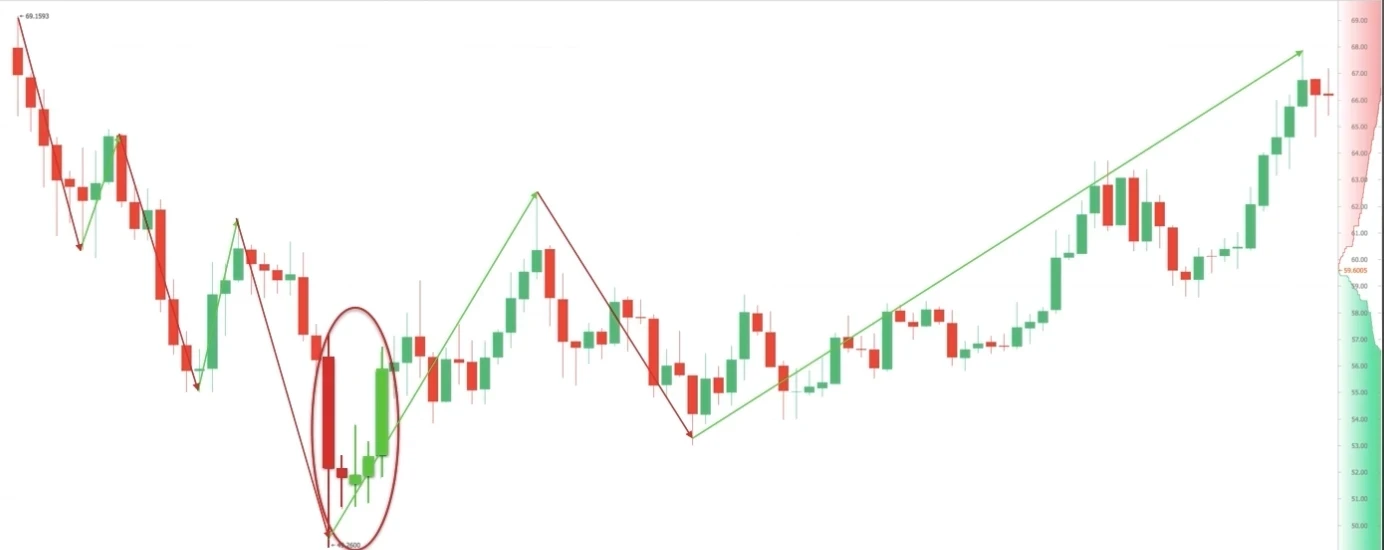
Example 1: After a sharp price drop, a Bullish Engulfing pattern formed. The price later bottomed out and surged significantly.
Example 2: A large bullish candle engulfed two small bearish candles, forming a Bullish Engulfing pattern, followed by another wave of upward movement.
Example 3: The bullish candle engulfed three bearish candles in one sweep, and the price subsequently surged sharply.
III. Bullish K-Line Pattern — Tower Bottom
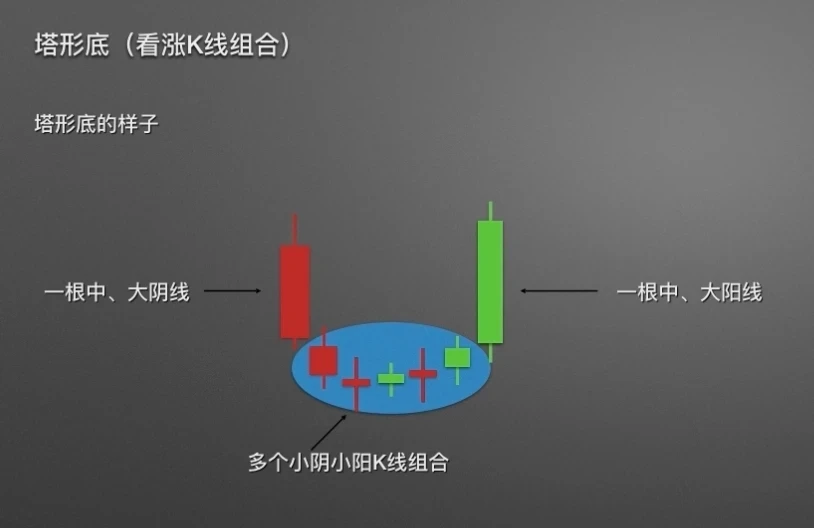
A Tower Bottom has a medium or large bearish candle on the left; the middle consists of several small K-lines, typically five or more; and the right side features a medium or large bullish candle. The overall shape resembles an inverted tower — hence the name "Tower Bottom."
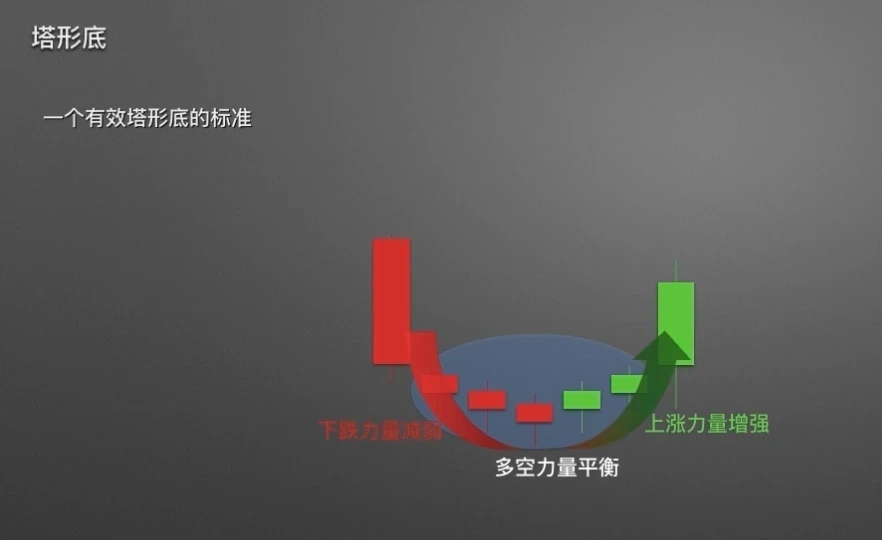
A valid Tower Bottom must meet one criterion: the closing price of the final bullish candle must exceed 50% of the body of the preceding large bearish candle. The Tower Bottom pattern illustrates the gradual weakening of bearish forces in the market, reaching a balance between bulls and bears, and finally gaining upward momentum.
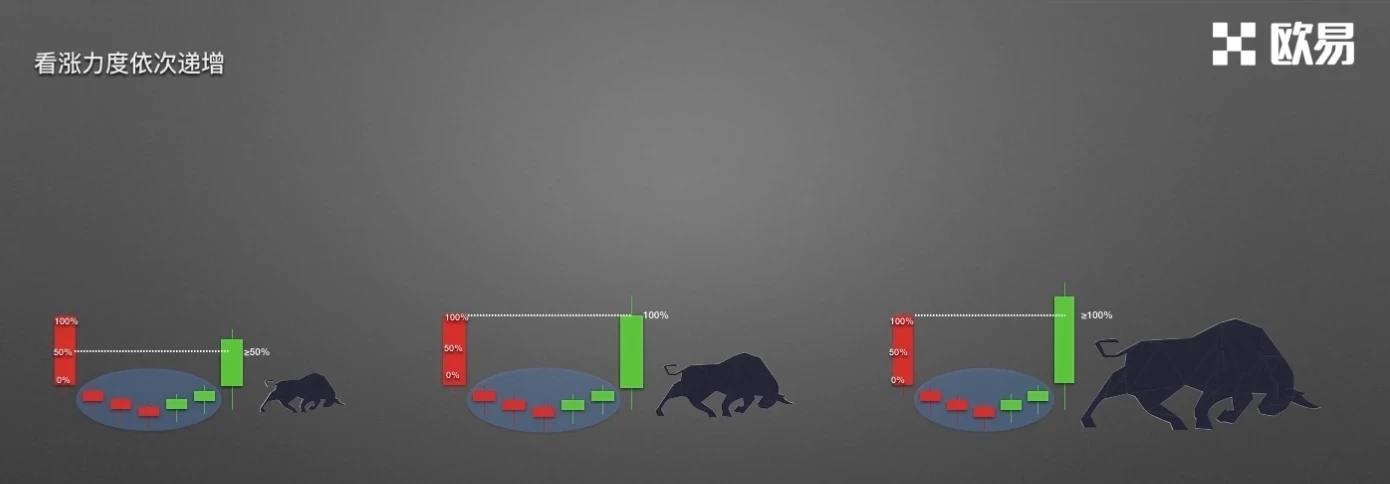
Once a valid Tower Bottom is confirmed, we can also gauge the strength of the bullish momentum by looking at where the final bullish candle closes. As shown in the chart: if the closing price barely clears the 50% passing threshold, the bullish momentum is relatively weak. If the final bullish candle closes at the same level as the preceding bearish candle's opening price, the bullish momentum is considered strong. If the final bullish candle closes significantly above the preceding bearish candle's opening price, the bullish momentum is even stronger.
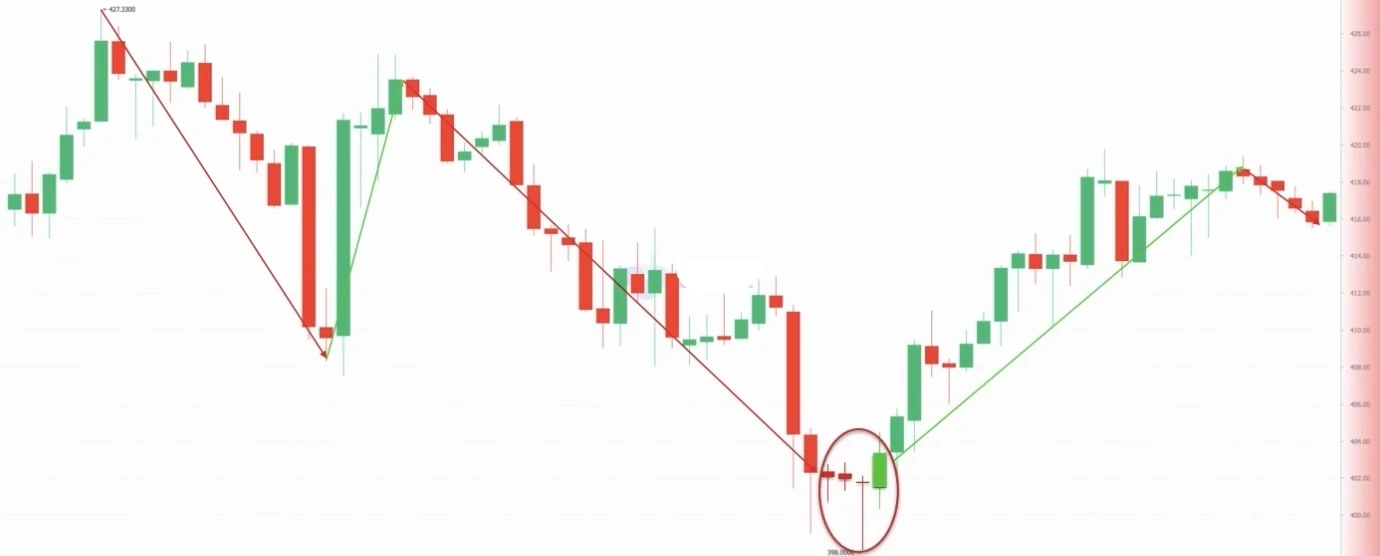
Of course, in actual price movements, a Tower Bottom is rarely as perfect as shown in our illustrative diagrams. Therefore, you must remain flexible. Let's look at what real-market "Tower Bottoms" look like.
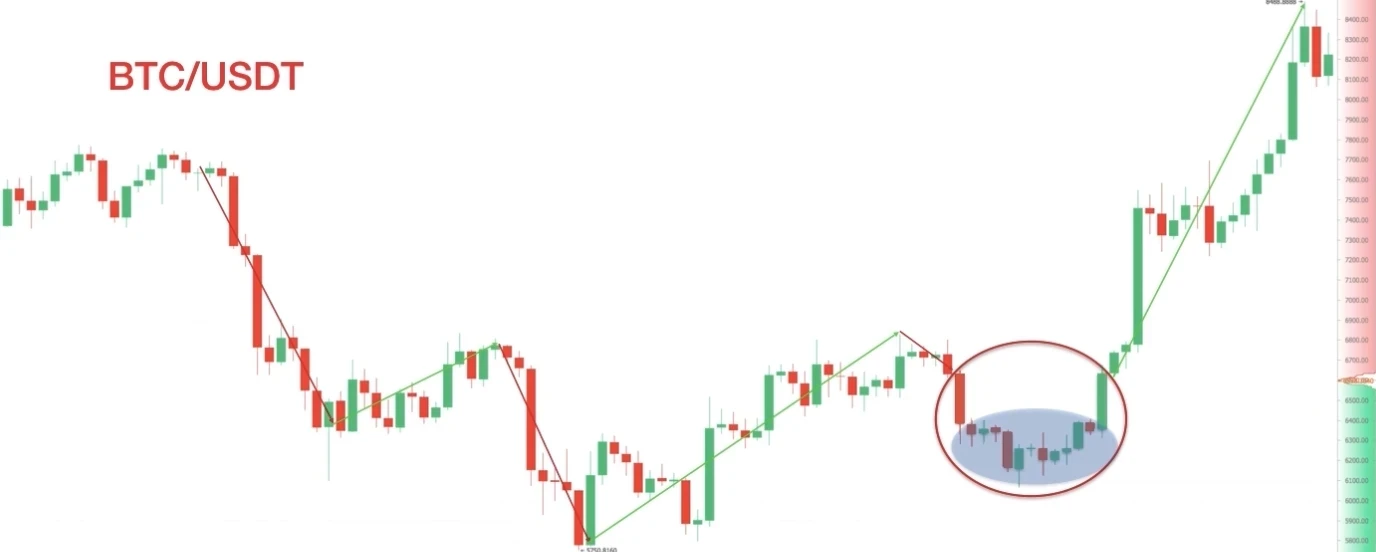
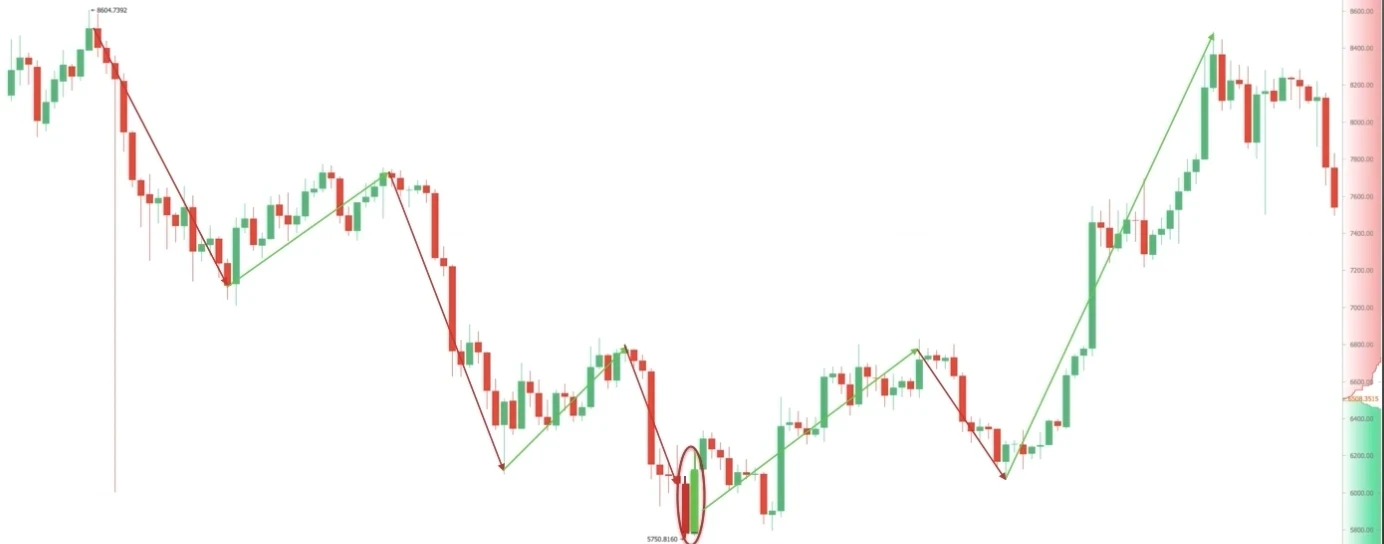
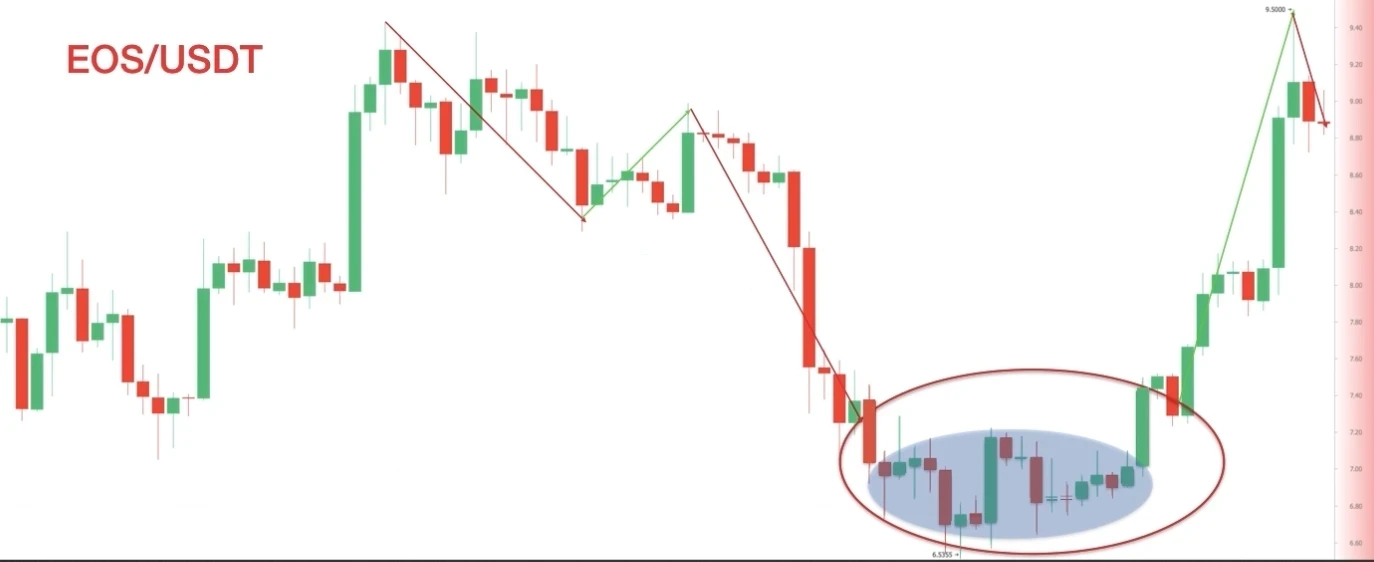
Variation 1: The actual formation closely matches the illustrative diagram. The screenshot is from the OKX spot trading area, the EOS/USDT 6-hour K-line chart. The Tower Bottom appeared within an uptrend, further solidifying the upward advantage, and was followed by a sharp upward move.
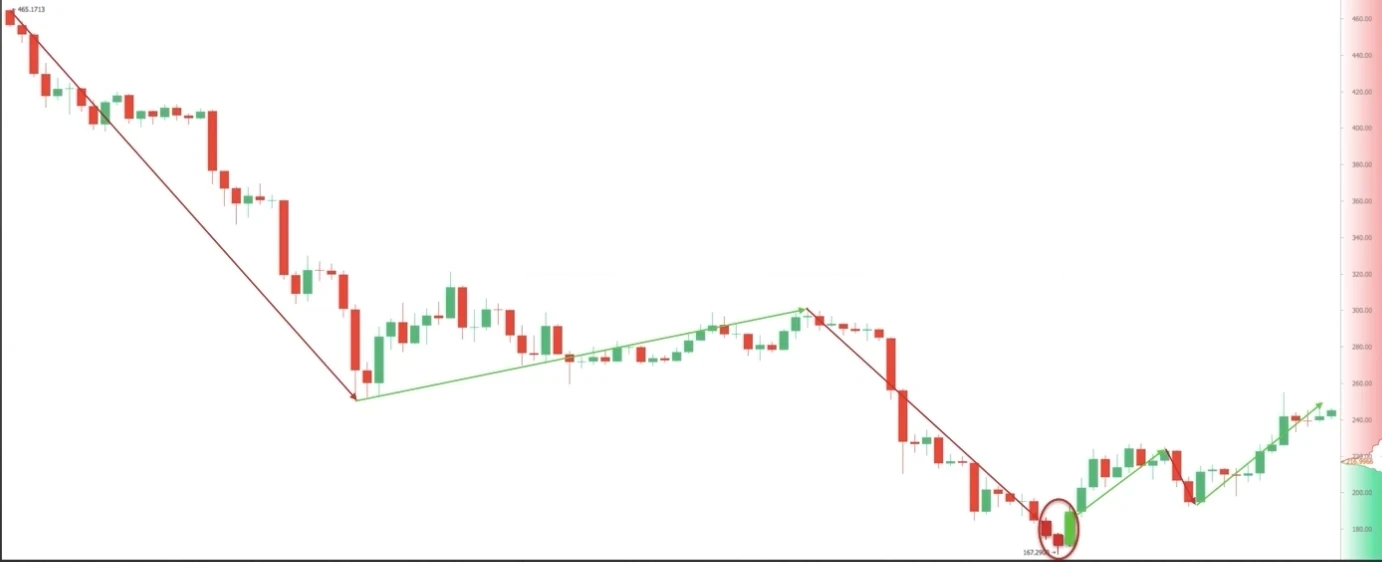
Variation 2: The middle section of the Tower Bottom is not always composed of very small K-lines — the K-line swings can be wider. The screenshot is from the OKX spot trading area, the EOS/USDT 12-hour K-line chart. The price plummeted and formed a Tower Bottom, the price bottomed out and reversed.
Chapter Summary:
Three classic bullish K-line patterns. First, the Morning Star — signaling the dawn of opportunity. Second, the Bullish Engulfing — where bearish forces are swiftly crushed by the bulls. Third, the Tower Bottom — the steady, methodical advance of bullish power.
That concludes this lesson. In the next lesson, we will cover bearish K-line patterns.
Disclaimer
This article may contain product-related content that does not apply to your region. This article is intended solely to provide general information and makes no representation as to any factual errors or omissions. The views expressed herein are solely those of the author and do not represent the views of OKX. This article is not intended to provide any advice, including but not limited to: (i) investment advice or investment recommendations; (ii) offers or solicitations to buy, sell, or hold digital assets; or (iii) financial, accounting, legal, or tax advice. Holdings in digital assets (including stablecoins) involve a high degree of risk and may fluctuate dramatically, or even become worthless. You should carefully consider whether trading or holding digital assets is appropriate for you based on your financial situation. For questions about your specific circumstances, please consult your legal/tax/investment professional. The information contained in this article (including market data and statistics, where applicable) is provided for general reference purposes only. While all reasonable precautions have been taken in preparing these data and charts, we assume no responsibility for any factual errors or omissions expressed herein. © 2025 OKX. This article may be reproduced or distributed in its entirety, or excerpted in portions of 100 words or less, provided that such use is non-commercial in nature. Any reproduction or distribution of the full article must also prominently state: "This article is copyrighted © 2025 OKX, used with permission." Permitted excerpts must cite the article name and include the source, for example: "Article name, [author name (if applicable)], © 2025 OKX". Some content may have been generated or assisted by artificial intelligence (AI) tools. This article is not permitted for derivative works or other uses.
Show More
Recommended Reading

Profit from Bitcoin's Decline? How to Trade Contracts
As the cryptocurrency market, led by Bitcoin, continues to expand in scale, diverse forms of derivatives trading have emerged alongside spot trading as hedging tools. Among them, contract trading has garnered the most attention. What is contract trading? Contracts are the most common trading instrument in the cryptocurrency derivatives market. Digital assets contract trading refers to an agreement between a buyer and a seller to trade a specific asset at a predetermined price at a future time.
January 16, 2026

Easier Than Copying Strategies? One-Click to Copy the Best Traders on OKX — Let Them Make Money for You
Whether in traditional finance or the cryptocurrency market, copy trading is a crucial and integral part of the trading ecosystem. When facing complex trading environments and extreme market conditions, even traders with solid theoretical knowledge and extensive experience can easily miss trading opportunities or make poor decisions driven by emotions. Copy trading is precisely the effective tool that addresses these issues. Now that you have the trading tool, how do you use it?
November 21, 2025

V. Strategic Trading Series — Recurring Buy (DCA)
Introduction: We often wonder: during a bull market, there are many digital assets that surge dramatically. If we could consistently capture coins with large gains — for example, catching one digital asset that doubles every month — after one year, your assets would grow to 2 to the 12th power, which is 4,096 times your initial investment. That is truly staggering, though of course it is nearly impossible to achieve, because it is extremely difficult to consistently catch assets that surge in value. This is a common challenge many users face: during a bull market, although
November 3, 2025

Which Countries/Regions Do Not Support OKX Registration
OKX currently does not provide services to customers from the following regions: certain U.S. territories, such as New York, Texas, Puerto Rico, American Samoa, Guam, the Commonwealth of the Northern Mariana Islands, and the U.S. Virgin Islands (St. Croix, St. John, and St. Thomas); Cuba, Iran, North Korea, Crimea, Malaysia, Syria, Bangladesh, and Bolivia. For more details, please refer to the OKX Terms of Service.
April 25, 2024

Quick Guide to OKX Products and Features
OKX (www. okx. com) is one of the world's leading digital asset service platforms, primarily serving global users by offering spot and derivatives trading services for Bitcoin, Ethereum, and other digital assets, while also exploring the worlds of DeFi, dApp, NFT, and GameFi together with its users. On OKX, you can enjoy a seamless trading experience in spot, contracts, and more, stay updated on tokens in trending sectors/concepts in real time, and
April 25, 2024

Zero Basics to Learn K-Line | 5 The Importance of K-Line Combination Application
Price movements follow trends — learn to read the language of price; trading signals replace guesswork. I. Key Levels for Bullish K-Line Combinations In the first two installments of this chapter, we covered bullish and bearish K-line combination applications. However, these combinations are not effective in every position. In this installment, we explain why the position where a combination appears matters. Where do bullish combinations perform best? The first scenario: late in a pronounced uptrend, the previous
April 25, 2024


