Zero-Based Candlestick Learning | 4 Bearish Candlestick Combinations
Price movements have trends, learn to read the language of price;
Buy and sell signals exist, say goodbye to gut-feeling Trading.
In this section, we continue learning about candlestick combinations—bearish combinations.
1. Bearish Candlestick Combination – Evening Star
The sunset is beautiful, but dusk is approaching. The appearance of the Evening Star indicates that the uptrend has come to an end and a correction is imminent.
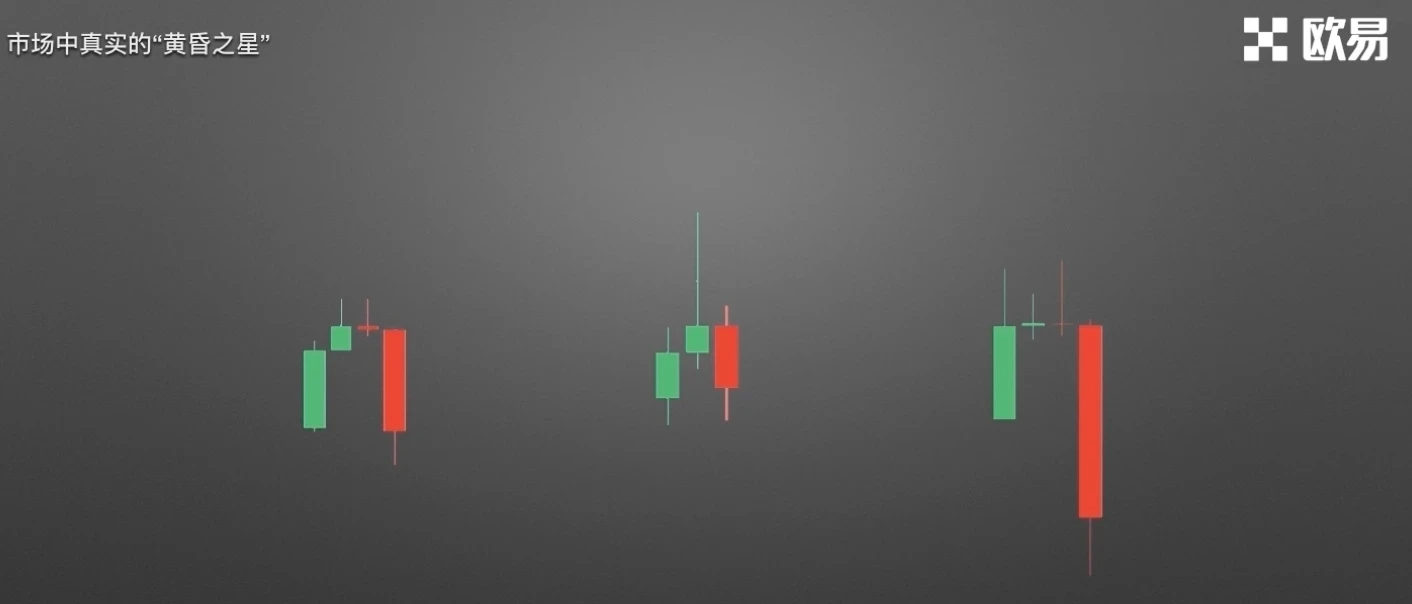
What does the Evening Star candlestick combination look like? As shown in the red circled area.
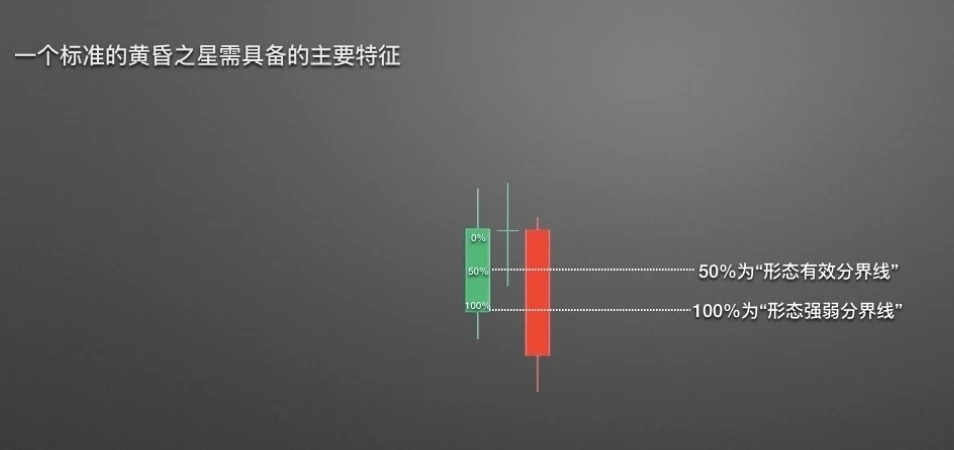
A standard Evening Star consists of three candlesticks: first a large bullish candle, followed by a star-like candle (similar to a doji), and the third candle is a large bearish candle. Whether an Evening Star is valid has clear requirements for the length of the third bearish candle—its closing price must be below 50% of the first bullish candle's body.
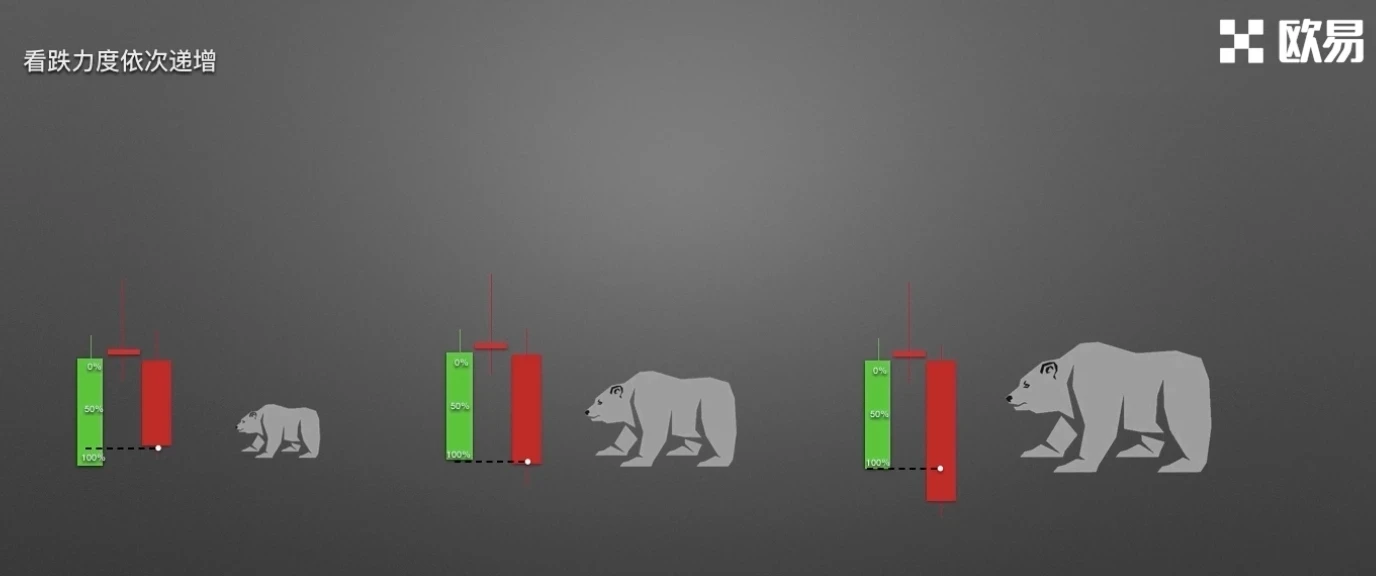
After confirming the Evening Star is valid, we can judge the strength of the bearish outlook by the position of the last bearish candle's closing price. As shown in the example, if the bearish candle's closing price just exceeds the 50% passing line, the bearish strength is relatively weak in this case. If the bearish candle's closing price is level with the previous bullish candle's opening price, the bearish strength is considered strong. If the bearish candle's closing price is significantly below the previous bullish candle's opening price, the bearish strength is considered very strong.
What we just discussed is the most standard Evening Star combination, but in actual market movements, the Evening Star has some variations. So what does a real Evening Star in the market look like?
The video example shows three types of Evening Stars.
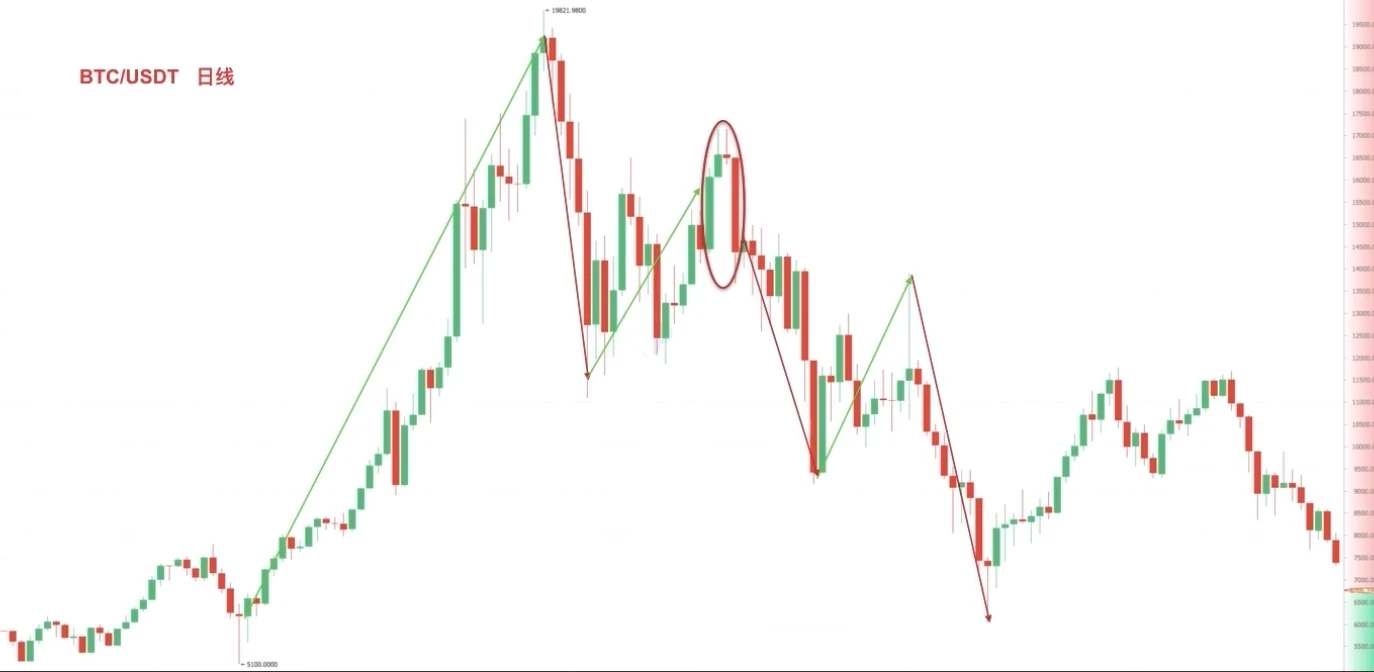
Figure 1: The middle consists of two small candlesticks. Let's restore it to the actual price chart. The Evening Star appears in the high zone after a significant price increase, followed by a substantial correction.
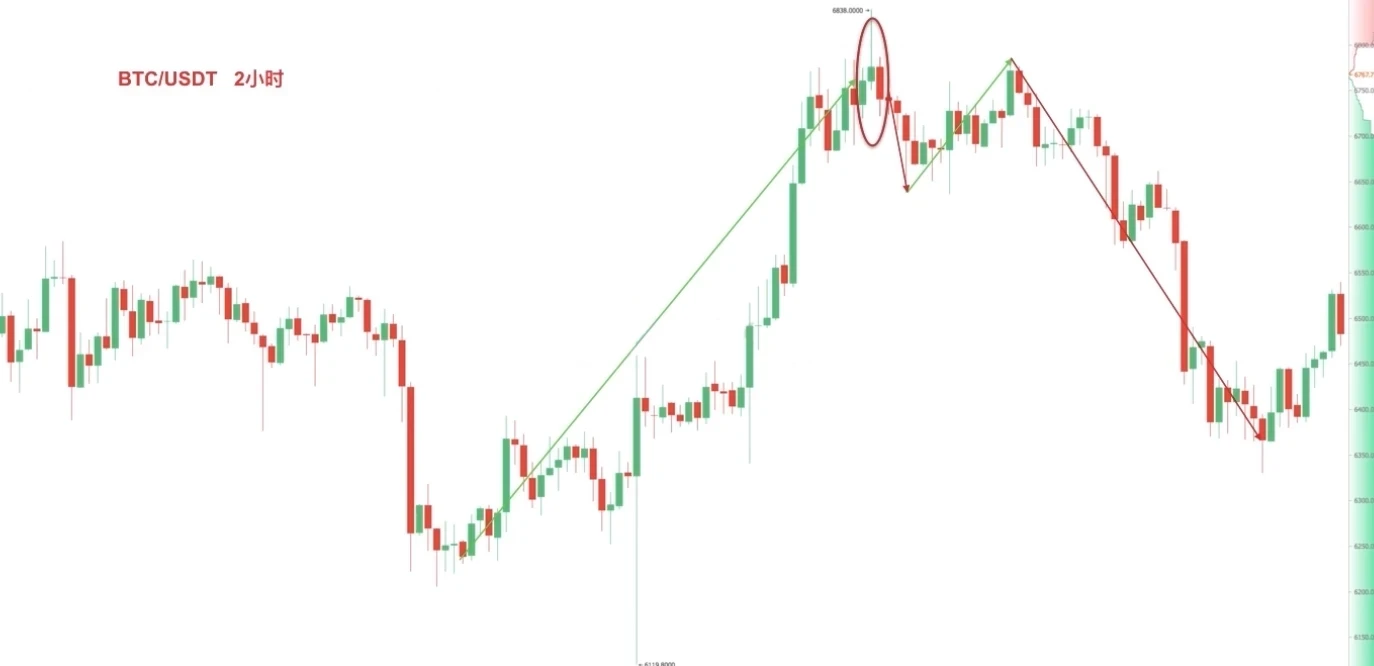
Figure 2: The middle candlestick is not a standard doji, but a small candlestick with a long upper shadow. Screenshot from OKX, BTC/USD 2-hour chart. After the Evening Star appears at the high, price stagnates and falls back.
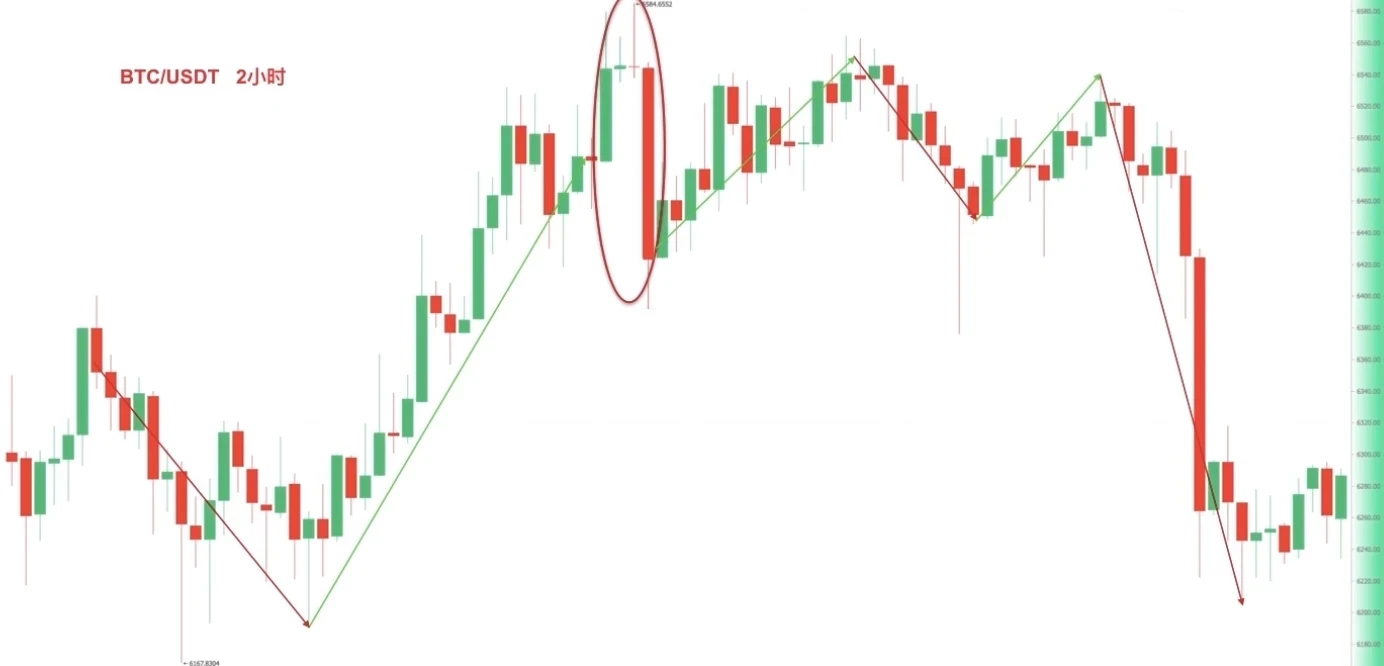
Figure 3: Two doji appear in the middle, and the bearish candle's strength is significantly greater than the bullish candle. After a major increase, a strongly bearish Evening Star appears, and after consolidating at the high, the price eventually plummets. Sometimes the Evening Star can appear twice in a row, or even more. During this BTC/USDT downtrend, Evening Stars appeared at two not-too-distant rally highs, and the price continued to fall.
2. Bearish Candlestick Combination – Bearish Engulfing.
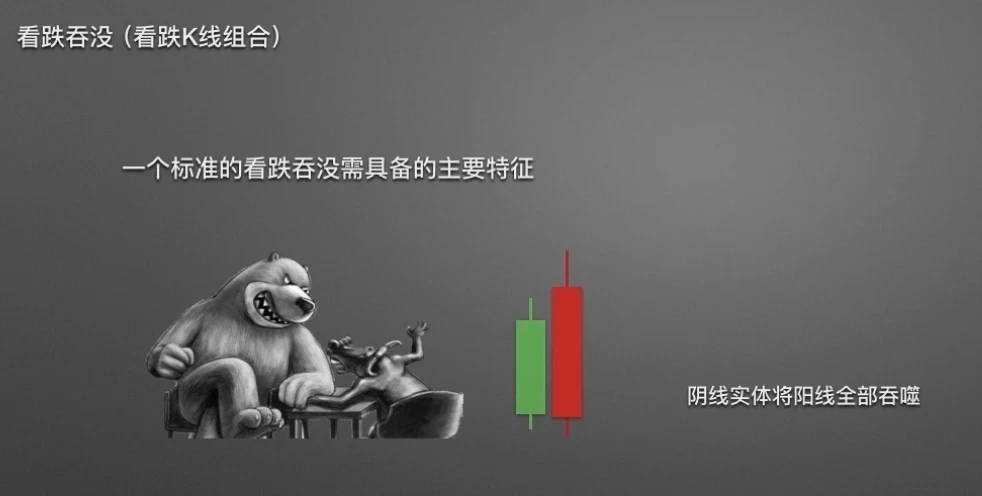
First, let's look at the characteristics of the Bearish Engulfing pattern. The body of the latter bearish candle completely covers the body of the former bullish candle, as if the bullish candle is being swallowed by the bearish candle. This indicates that bearish forces are mounting a major counterattack. Hence the name Bearish Engulfing.
So how to judge the bearish strength?
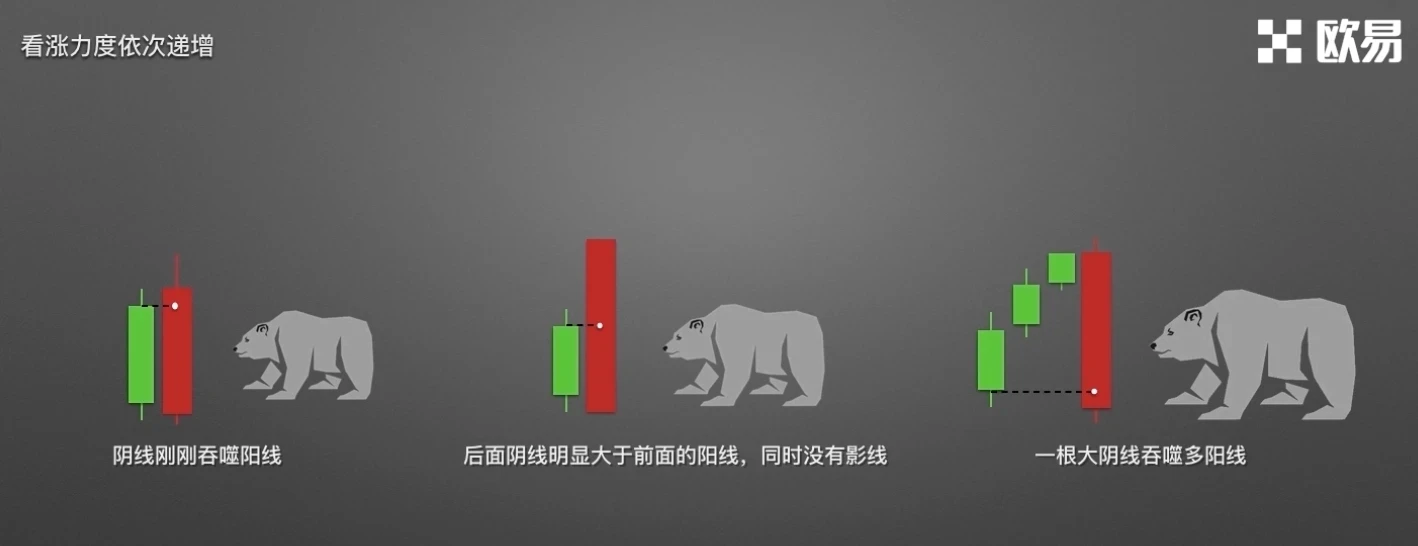
Figure 1: The bearish candle body just barely engulfs the bullish candle body; in this case, the bearish strength is weak. Figure 2: The bearish candle's closing price is significantly below the bullish candle's opening price, and the bearish candle length even reaches twice that of the bullish candle; in this case, the bearish strength is strong. Figure 3: The bearish candle engulfs multiple bullish candles at once; in this case, the bearish strength is very strong.
There are many non-standard Bearish Engulfing combinations in the market. So what do actual Bearish Engulfing combinations look like?
For example, the three variants of Bearish Engulfing combinations shown.
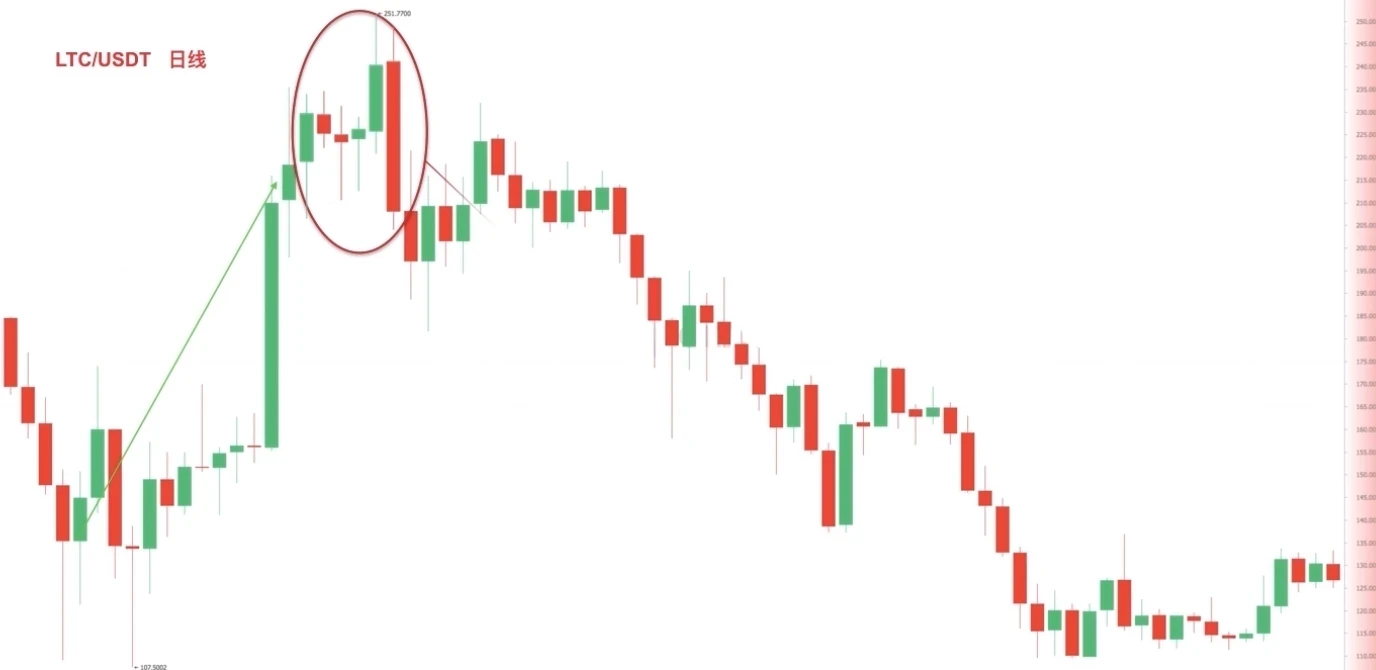
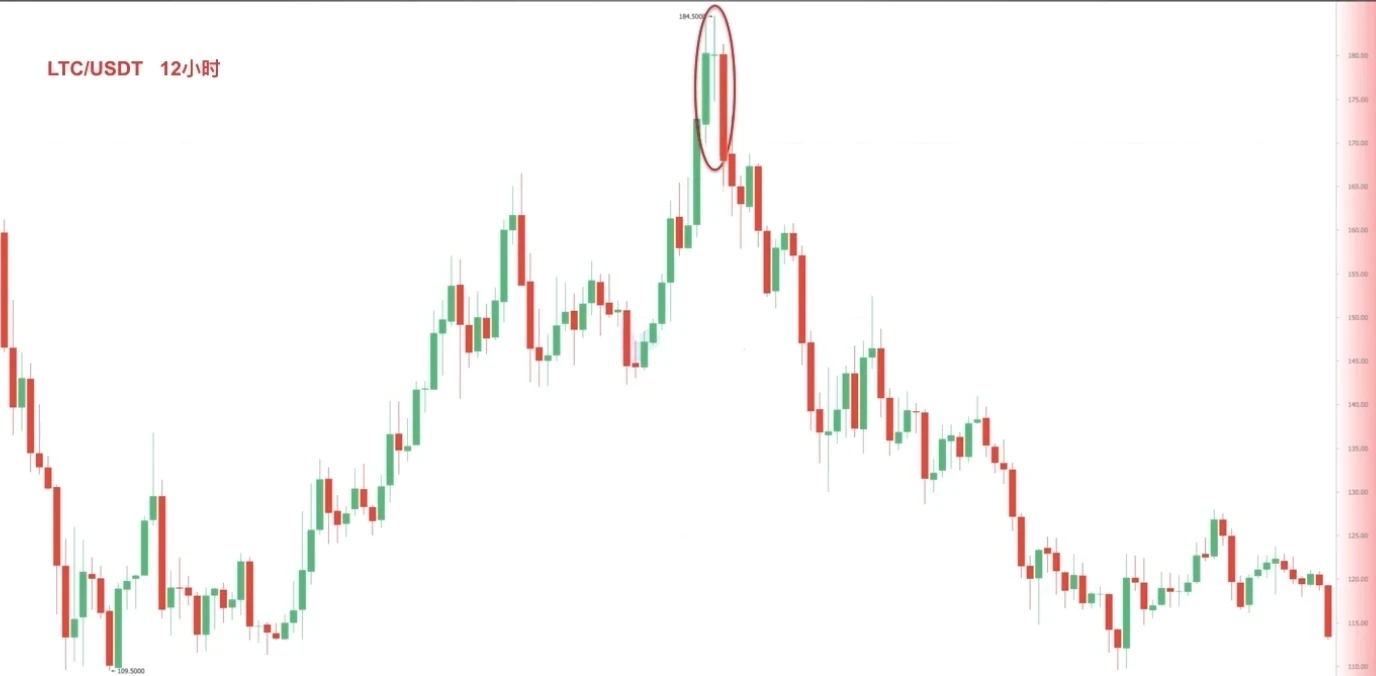
Figure 1 (screenshot from OKX LTC/USDT daily chart): After a significant price increase, a strong bearish engulfing pattern of one bearish candle engulfing multiple bullish candles appeared, followed by a continuous decline.
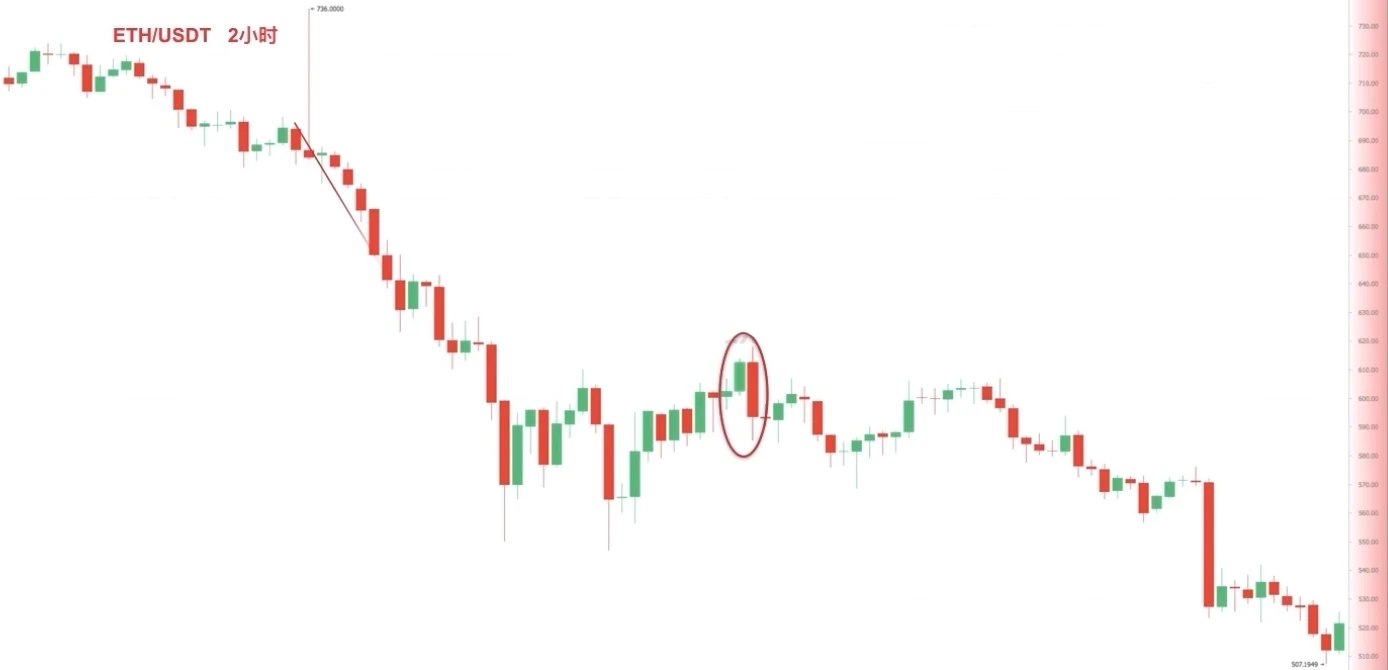
Figure 2 (screenshot from OKX ETH/USDT 2-hour chart): At the rebound high of a downtrend, a bearish engulfing pattern appeared, ending the rebound and continuing the downward movement.
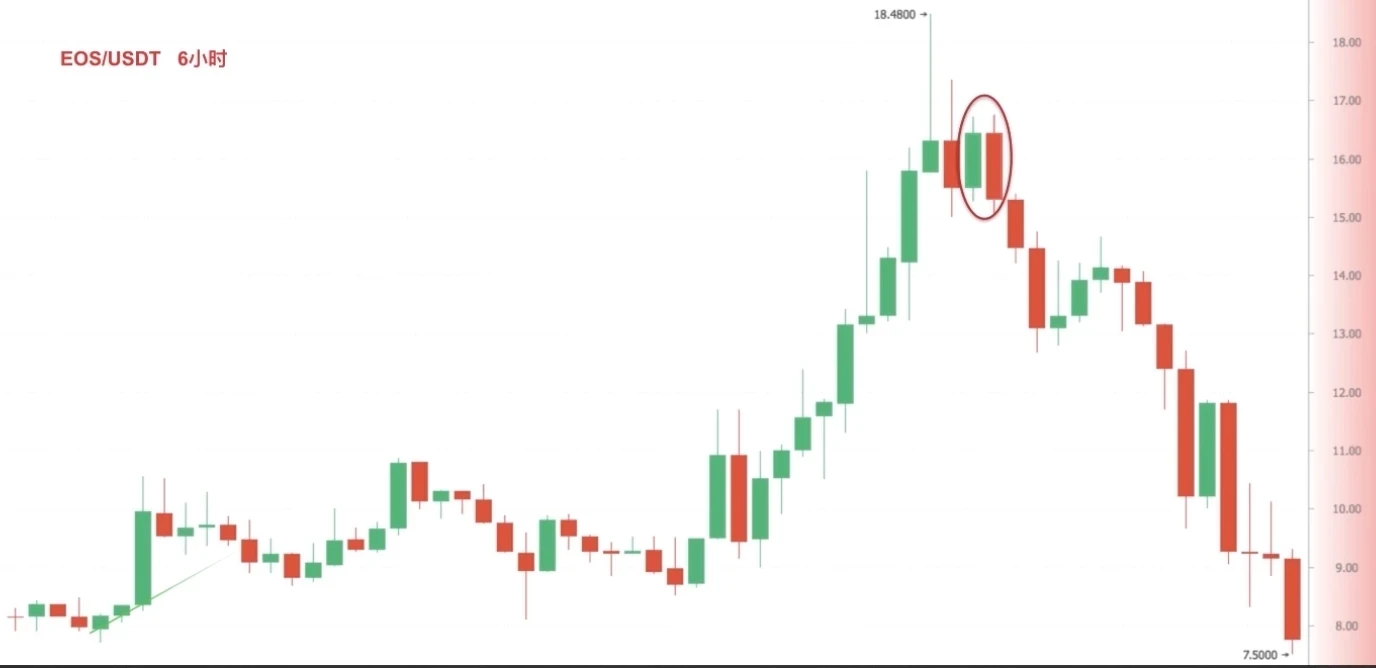
Figure 3 (screenshot from OKX EOS/USDT 6-hour chart): After continuous significant gains, a bearish engulfing pattern appeared, followed by a substantial decline.
3. Bearish Candlestick Combination – Tower Top
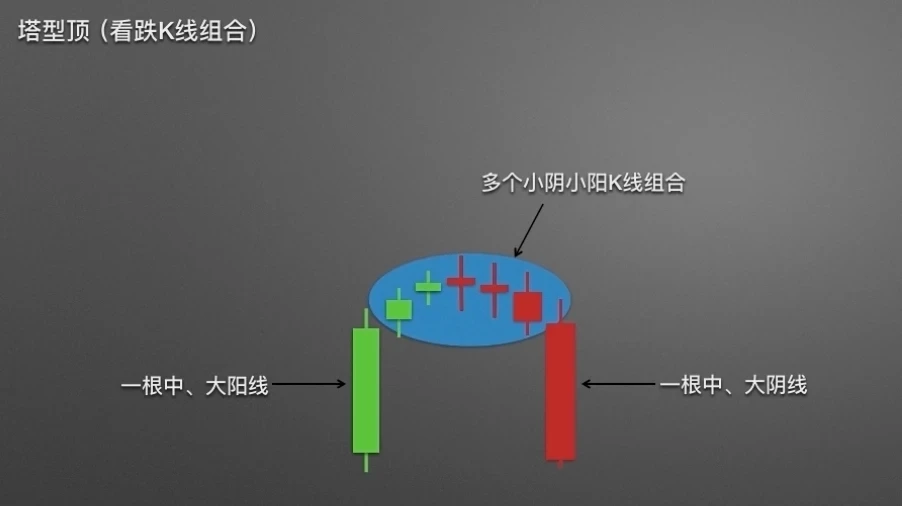
Tower Top: On the left is a medium or large bullish candle; in the middle are several small candlesticks, usually 5 or more; on the right is a medium or large bearish candle. Overall, it looks like a pagoda, hence the name Tower Top.
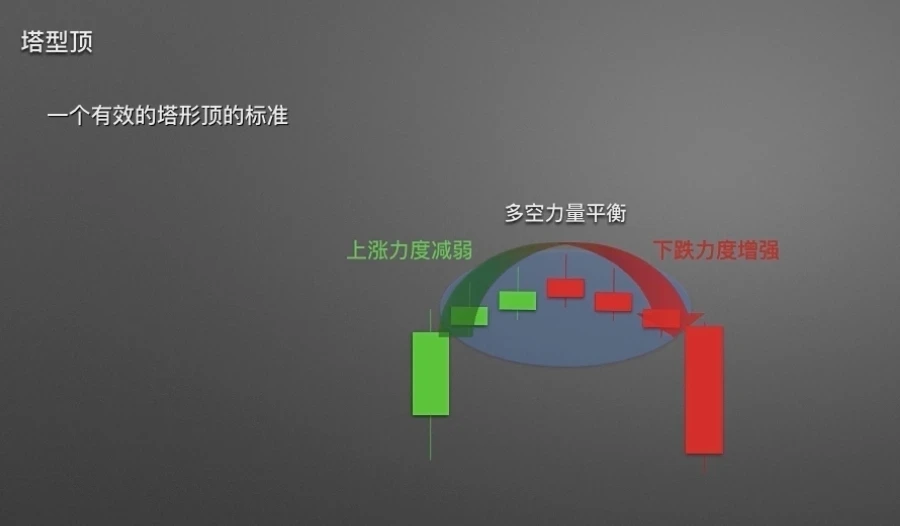
A valid Tower Top must satisfy: the last bearish candle's closing price must be below 50% of the preceding large bullish candle's body. The Tower Top demonstrates: the process where bullish forces in the market gradually weaken, bulls and bears reach balance, and finally downward strength increases.
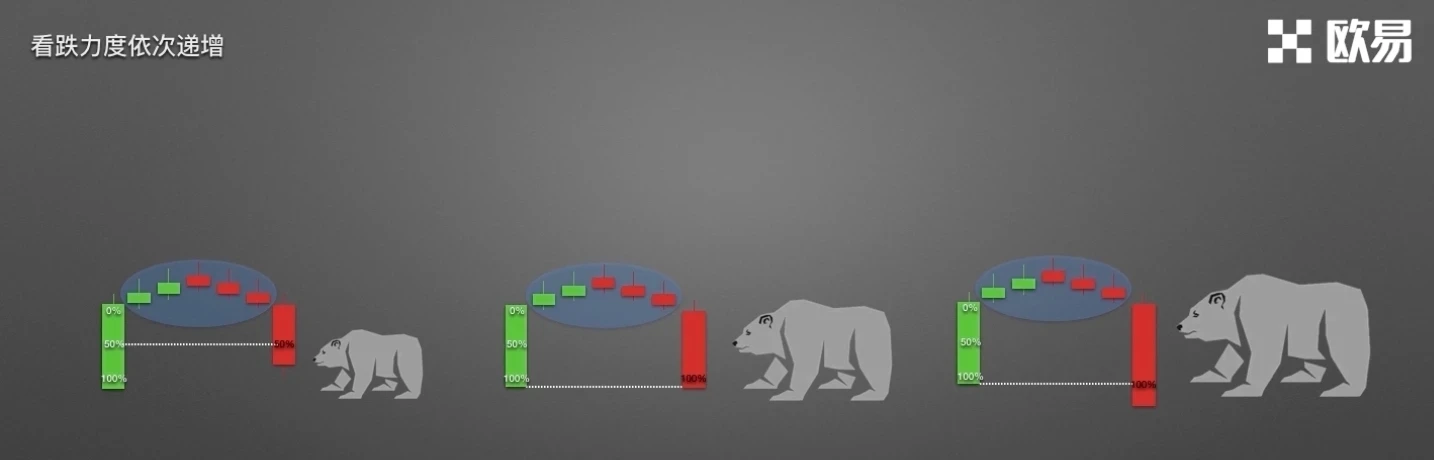
After confirming the Tower Top is valid, we can judge the strength of the bearish outlook by the position of the last bearish candle's closing price. As shown in the figure, if the bearish candle's closing price just exceeds the 50% passing line, the bearish strength is relatively weak in this case; if the bearish candle's closing price is basically level with the previous bullish candle's opening price, the bearish strength is considered strong; if the bearish candle's closing price is significantly below the previous bullish candle's opening price, the bearish strength is quite strong.
Of course, in actual market movements, Tower Tops are not as perfect as shown in our diagrams. You need to apply this knowledge flexibly. Let's look at what actual Tower Tops in the market look like.
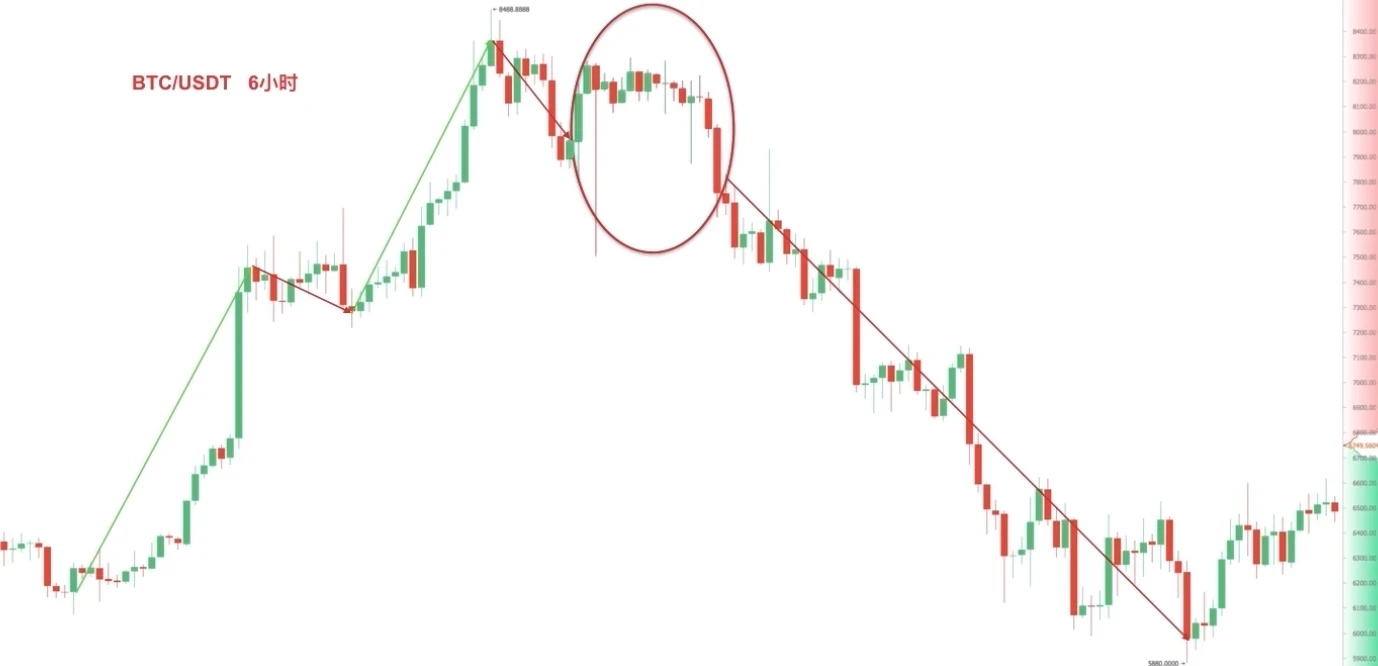
Variation 1: Multiple small candlesticks in the middle have long shadows. Screenshot from OKX BTC/USDT 6-hour chart. After a significant increase, a Tower Top pattern appeared, followed by continuous decline, breaking through previous lows.
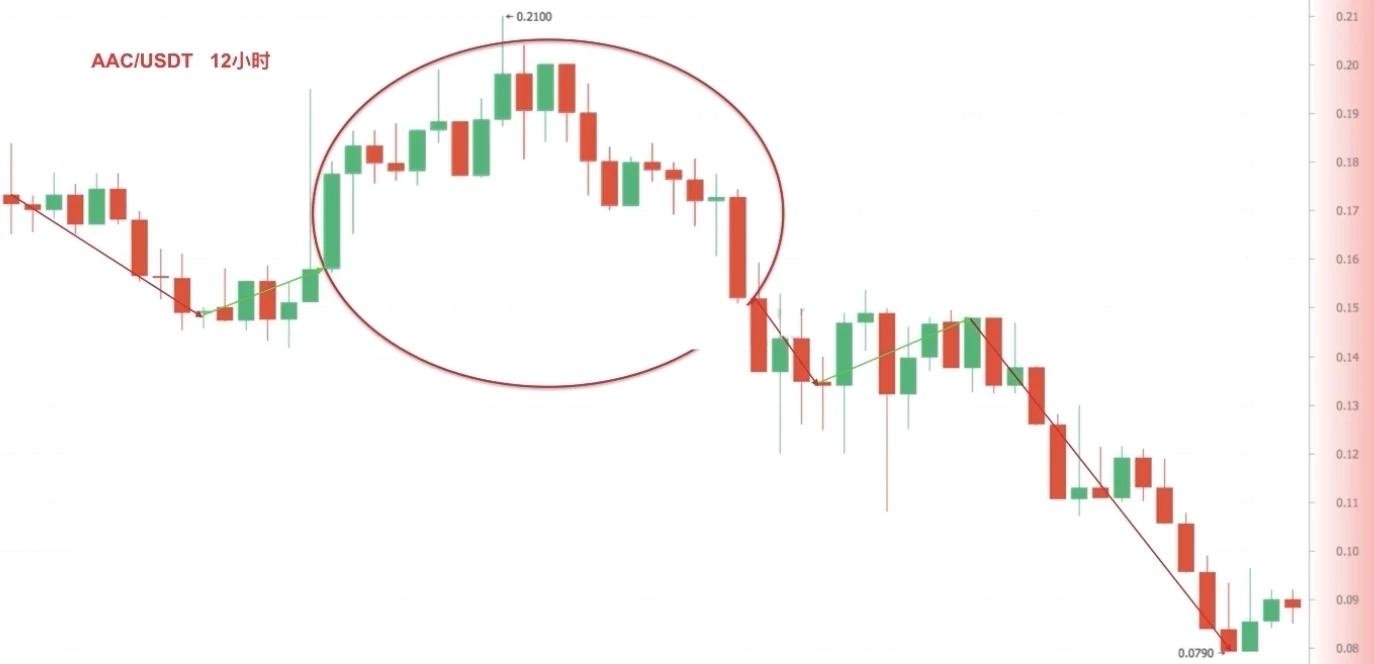
Variation 2: The middle part of the Tower Top is not composed entirely of very small candlesticks; the candlestick oscillation range is relatively large. Screenshot from OKX Spot Trading zone AAC/USDT 12-hour candlestick chart. A Tower Top appeared during a rally, followed by continued substantial decline.
Let's review this session's content:
Three typical bearish combinations. First, the Evening Star, signaling that darkness is about to fall; second, the Bearish Engulfing, with bears turning the tide; third, the Tower Top, with bulls gradually surrendering.
This concludes this lesson. In the next lesson, we will share the importance of candlestick combination positions.
Disclaimer
This article may contain product-related content not applicable to your region. This article is intended to provide general information only and does not accept responsibility for any factual errors or omissions herein. This article represents only the author's personal views and does not represent OKX's views. This article is not intended to provide any recommendations, including but not limited to: (i) investment advice or investment recommendations; (ii) offers or solicitations to buy, sell or hold digital assets; or (iii) financial, accounting, legal or tax advice. Holding digital assets (including stablecoins) involves high risk, may fluctuate significantly, and may even become worthless. You should carefully consider whether trading or holding digital assets is suitable for you based on your financial situation. For questions about your specific situation, please consult your legal/tax/investment professional. The information appearing in this article (including market data and statistics, if any) is for general reference only. Although we have taken all reasonable precautions in preparing these data and charts, we accept no responsibility for any factual errors or omissions expressed herein. © 2025 OKX. This article may be reproduced or distributed in full, or excerpts of 100 words or less from this article may be used, provided such use is non-commercial. Any reproduction or distribution of the entire article must prominently state: "This article © 2025 OKX, used with permission." Permitted excerpts must cite the article name and include attribution, for example "Article Name, [Author Name (if applicable)], © 2025 OKX". Some content may be generated or assisted by artificial intelligence (AI) tools. Derivative works or other uses of this article are not permitted.
Show More
Recommended Reading

Profit from Bitcoin Declines? How to Conduct Contract Trading
As the cryptocurrency market scale represented by Bitcoin continues to expand, various forms of derivatives trading have gradually emerged beyond spot trading as tools to hedge risk, with contract trading receiving the most attention. What is contract trading? Contracts are the most common trading contract form in the cryptocurrency derivatives market. Digital assets contract trading refers to buyers and sellers agreeing to trade certain assets at a specified price at a future time.
January 16, 2026

Simpler Than Copy Strategies? One-Click Follow Top Strategy Traders on OKX, Let Traders Earn Money for You
Whether in traditional finance or the cryptocurrency market, strategy trading is a very important and crucial method in the trading system. When facing complex trading environments and extreme market conditions, even with solid theoretical technical knowledge and rich trading experience, it's easy to miss trading opportunities or make wrong judgments and operations due to emotional influence. Strategy trading is an effective tool that can solve these problems. With trading tools available, how to use them
November 21, 2025

Five, Strategy Trading Series Course – Accumulate
Preface: We often have this speculation: In bull markets, there are many digital assets with significant gains. If you can continuously capture assets with large increases, for example catching a doubling digital asset every month, after one year your assets will become 2 to the power of 12, i.e., 4096 times, which is very amazing. Of course, this is also almost impossible to complete, because it's difficult for us to continuously catch surging assets. This is also a problem many users encounter: In bull markets, although
November 3, 2025

Which Countries/Regions Do Not Support Registration to Use OKX
OKX currently does not provide services to customers in the following regions: certain US territories, such as New York, Texas, Puerto Rico, American Samoa, Guam, Commonwealth of the Northern Mariana Islands, US Virgin Islands (St. Croix, St. John and St. Thomas), Cuba, Iran, North Korea, Crimea, Malaysia, Syria, Bangladesh and Bolivia. For details, please refer to the OKX Terms of Service.
April 25, 2024

Quickly Understand OKX Common Products and Features
OKX (www.okx.com) is one of the world's famous digital asset service platforms, mainly providing global users with Bitcoin, Ethereum and other digital assets' spot and derivatives trading services, while also exploring the world of DeFi, dApps, NFTs and GameFi together with users. On OKX, you can enjoy smooth trading experiences such as spot and contracts, keep up with token information in hot areas/concepts, and also
April 25, 2024

Zero-Based Candlestick Learning | 5 Importance of Candlestick Combination Positions
Price movements have trends, learn to read the language of price; buy and sell signals exist, say goodbye to gut-feeling trading. I. Bullish Candlestick Combinations at Key Positions In the first two sections of this chapter, we explained applications of bullish and bearish candlestick combinations, but these combinations are not effective when appearing at any position. In this section, we'll explain the importance of where combinations appear. At which positions can bullish combinations better play their role? First situation: In a clear uptrend, near the previous
April 25, 2024


