Zero Basics to Learn K-line | 6 Trend Recognition and Classification
Trends determine rise and fall; master the language of price;
Signals guide your trades; quit trading on gut feelingTrading.
Hello everyone, in this section we will learn about trends and how they manifest.
1. What is a Trend?
First, let's think: what is a trend?
Simply put, a trend is the direction in which the market is heading. It can be upward, downward, or sideways.
To illustrate, the trend of market prices is like the flow of water. Due to differences in elevation, gravity causes water to flow downward; in capital markets, because an investment's price diverges from its value, prices tend to revert toward value. Just as mountains and plains shape water's form—creating waterfalls or rivers—decisions to buy or sell in capital markets shape the form of trends.
Trading legend Jesse Livermore said, "Markets rise and fall in the direction of least resistance."
If the resistance to the upside is less than the resistance to the downside, prices will rise; otherwise, prices will fall. Finding a trend means finding the path of least resistance.
The path of least resistance doesn't mean a straight line. Rivers flow to the sea via countless twists and bends. Trends manifest in diverse forms as well.
Trends, much like the motion of waves, don't travel in a straight line. The trajectory of trend movement is winding, resembling successive waves with clear peaks and troughs. Remember these two elements—peaks and troughs—like 0 and 1 in computer programming, they are the building blocks of different trends.
Based on the relative positions of peaks and troughs, trends are classified into uptrends, downtrends, and range-bound trends.
Next, let's examine a set of real price charts to compare and understand these three trend types.
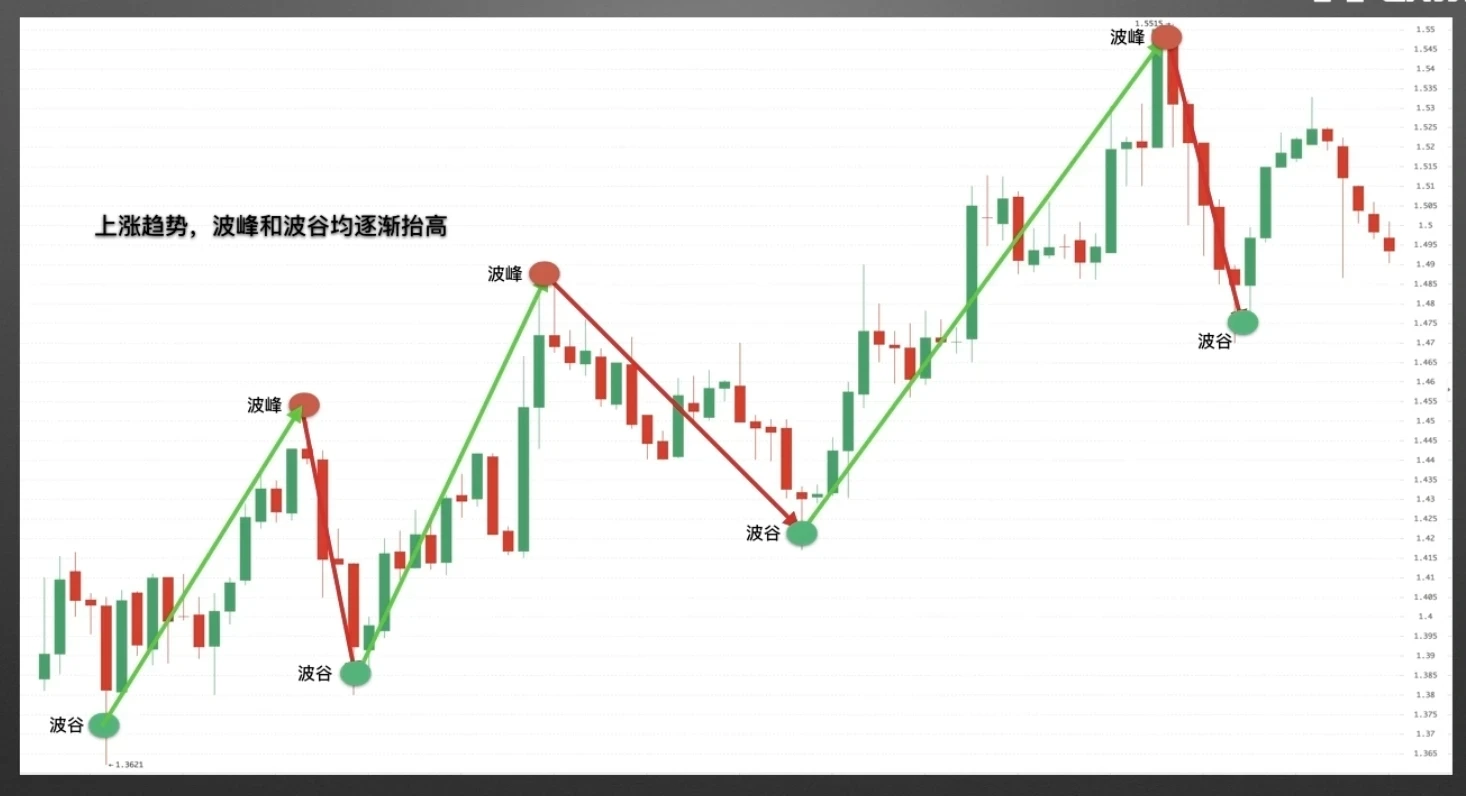
The chart shows an uptrend. We can clearly see that in an uptrend, both the peaks and troughs progressively rise.
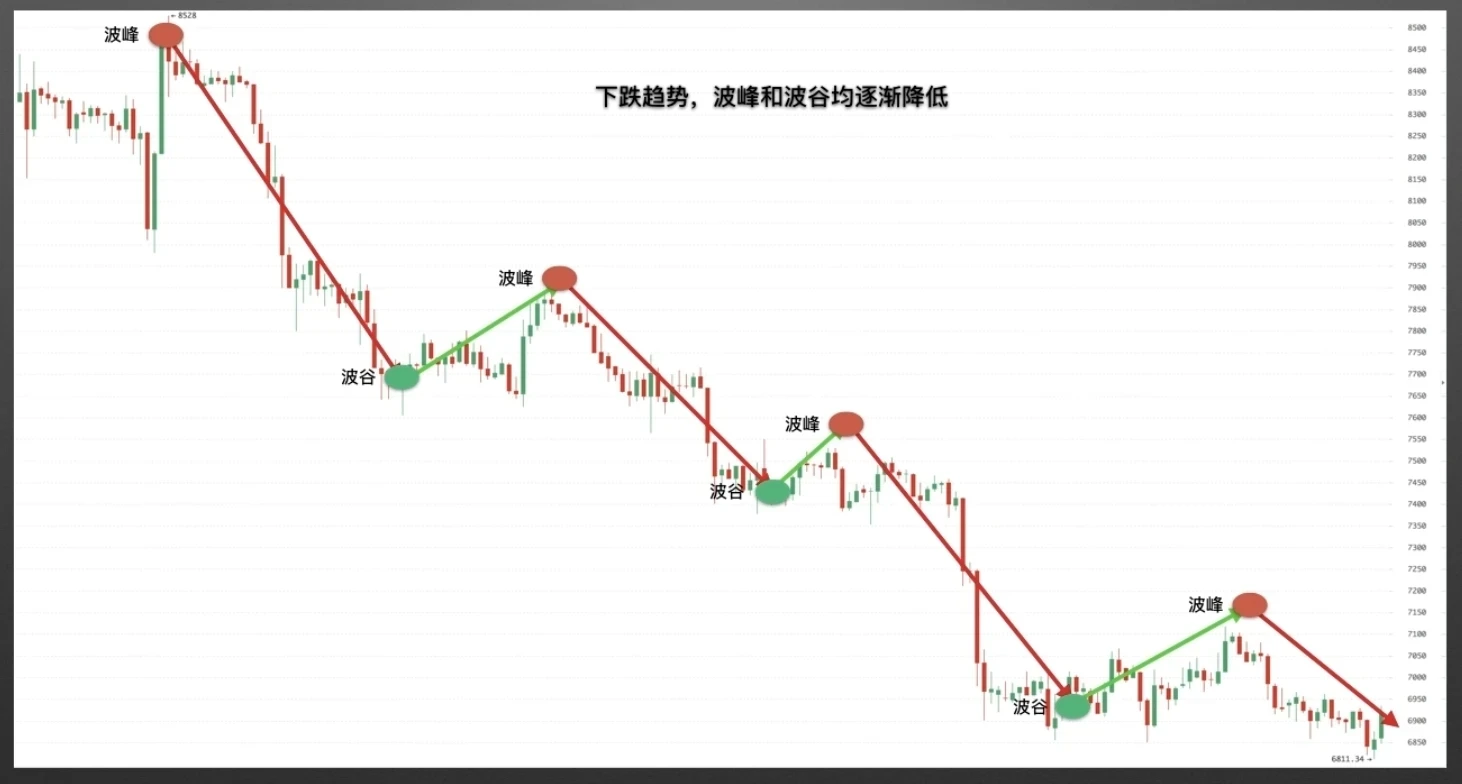
The chart shows a downtrend. As we can see, in a downtrend, both the peaks and troughs progressively decline.
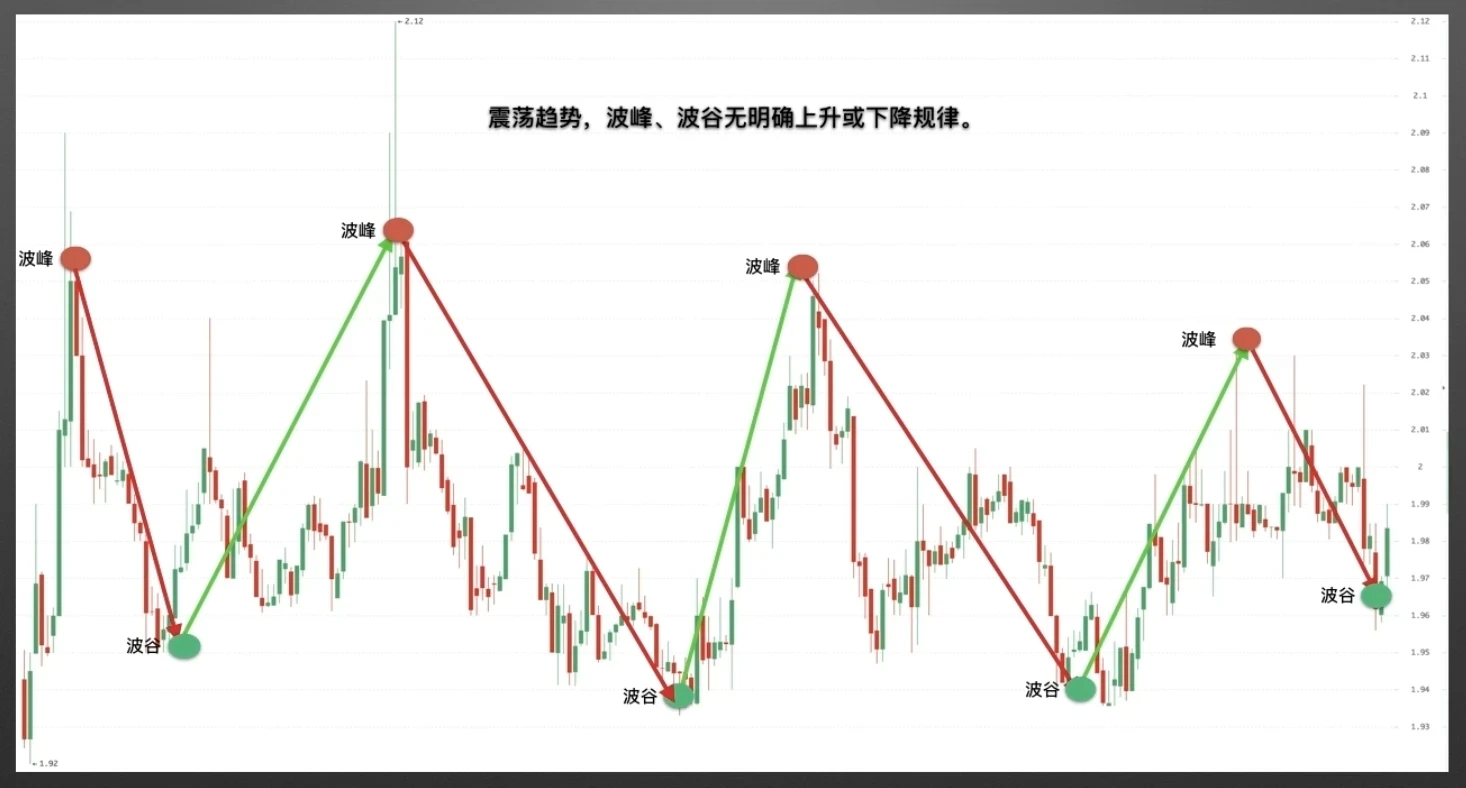
The chart shows a common range-bound trend. The upper peaks don't show a regular pattern of rising; the lower troughs don't show a regular pattern of declining. Therefore, the defining characteristic of a range-bound trend is that peaks and troughs lack a clear upward or downward pattern. In certain special cases, the peaks or troughs may align at the same level. We will cover this formation later.
2. What is a Trendline?
Through the different positions of peaks and troughs, we can now identify uptrends, downtrends, and range-bound trends. How can we make trends more visual? We can use a magical straight line—the trendline.
How do you draw a trendline? Connect the peaks and troughs formed by market movement to obtain the trendline.
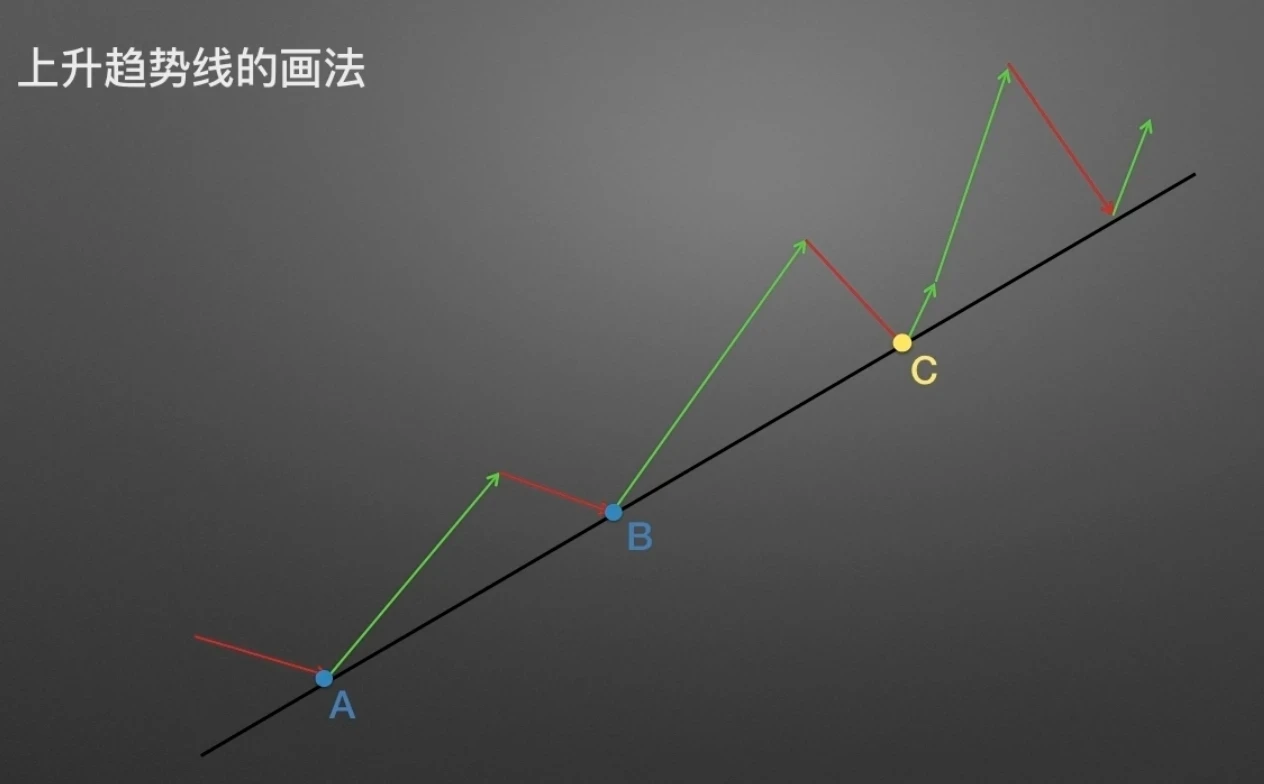
As shown, connecting two troughs A and B yields an upward-sloping line (technically called an uptrend line). Two troughs alone aren't enough to confirm the validity of a trendline. A third trough C is needed for confirmation.
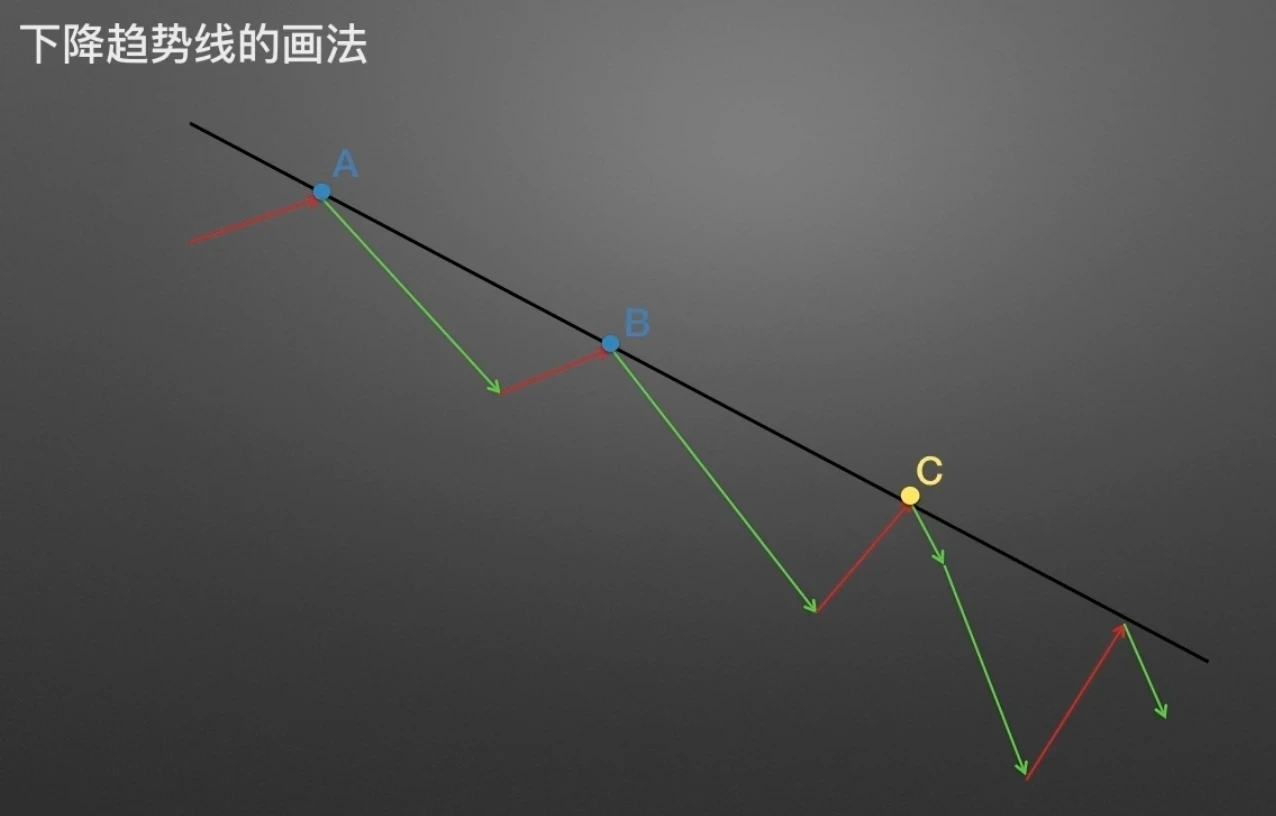
The chart illustrates how to draw a downtrend line. First locate two peaks A and B, draw a line through the two points; peak C falls exactly on the line, confirming the downtrend line is valid. Trendlines are primarily shaped by investors' collective psychology, creating support and resistance effects, and the same "turkey fallacy" applies here. After a third point confirms the trendline, a fourth or fifth point may follow, but it's not guaranteed. Moreover, the support or resistance effect of a trendline will eventually be broken.
How do you determine the strength and sustainability of a trend? Let me introduce you to trendline angle!
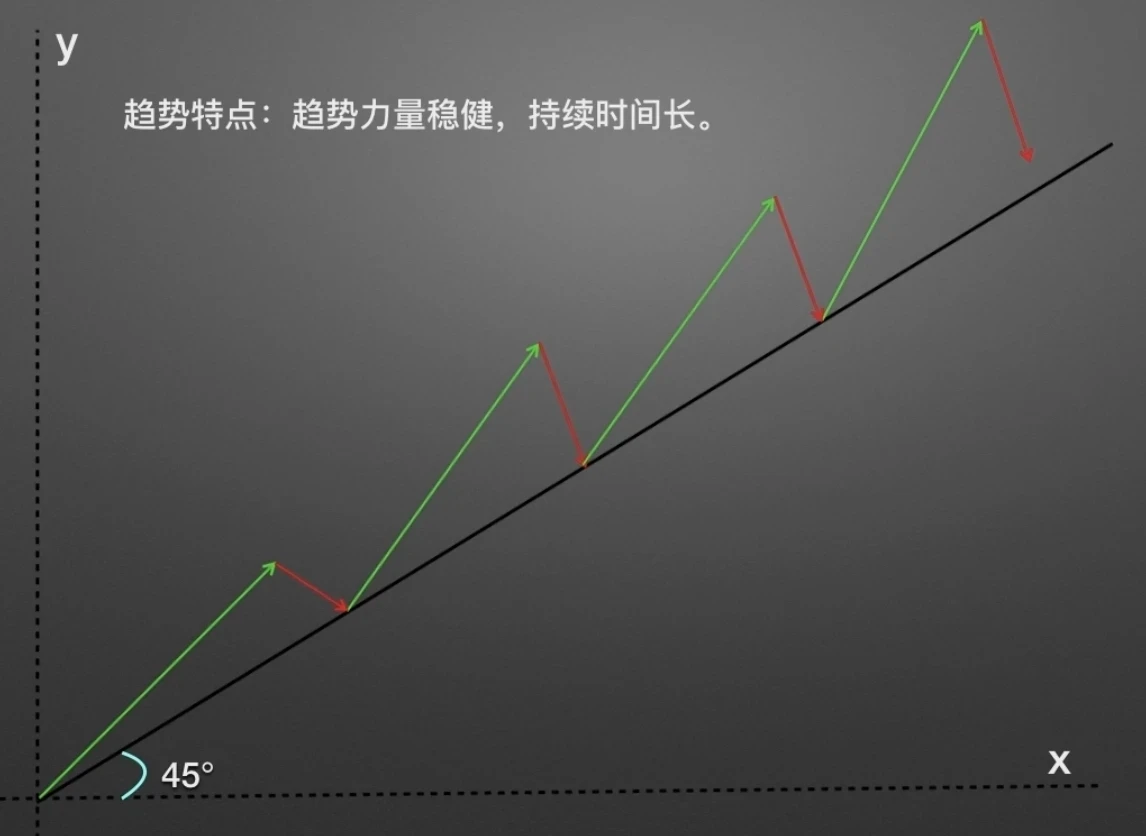
The chart shows a simplified uptrend line at a 45-degree angle. This trend is steady and powerful. The actual price action contains more candlesticks, meaning a 45-degree trend tends to last longer.
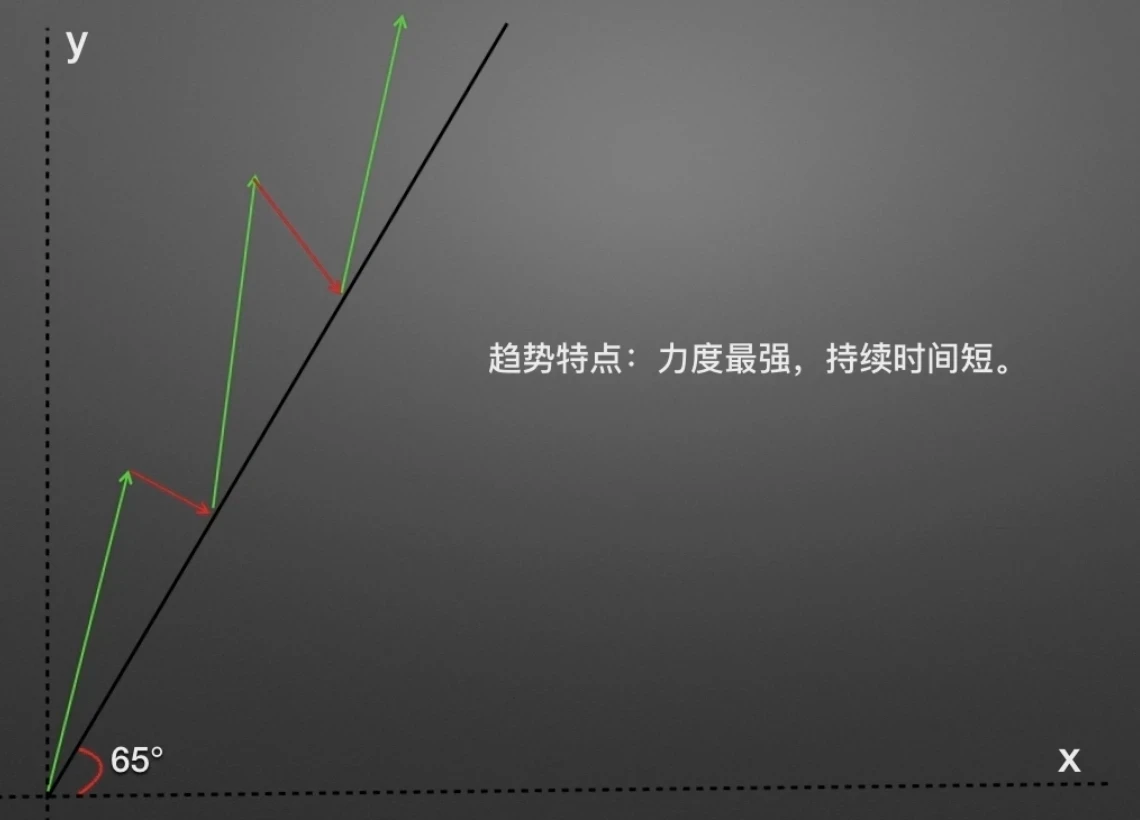
When the trend angle shifts from 45 degrees to 65 degrees, we observe stronger upward momentum, but the number of candlesticks forming the trend is notably fewer than the 45-degree trendline. In other words, while steeper trendlines carry stronger momentum, their duration tends to be shorter. Such trends can be sharp and sudden when reversing, so avoid chasing rallies and panic selling.
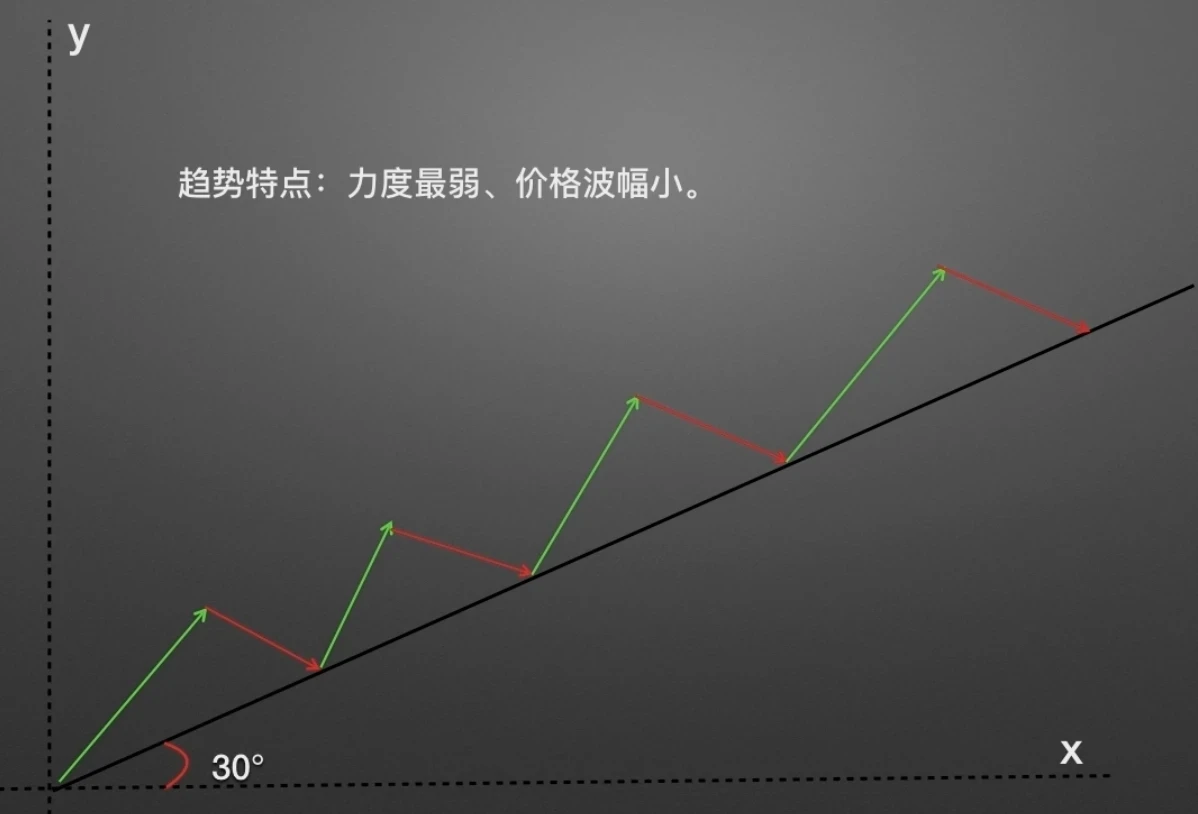
Next we have an uptrend line at a 30-degree angle. Compared to the 45-degree and 65-degree uptrend lines, the 30-degree trend has the weakest upward momentum and smaller price swings.
Finally, let's share a special type of trendline—the trend channel. In some cases, price trends are entirely confined between two parallel lines—one being the basic trendline and the other being the channel line.
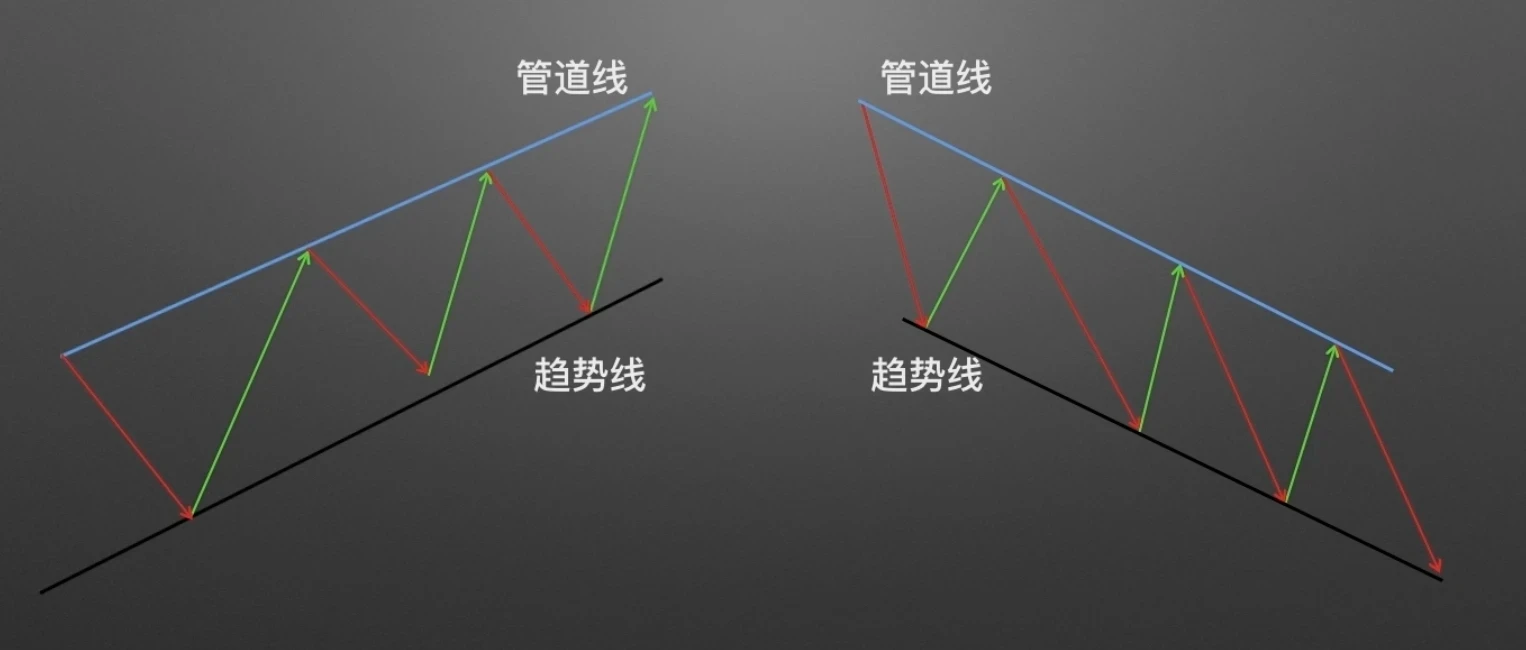
As shown, the lower black line is the trendline we discussed earlier; the upper blue line is the channel line. The left side is a simplified up-channel, and the right side is a simplified down-channel.
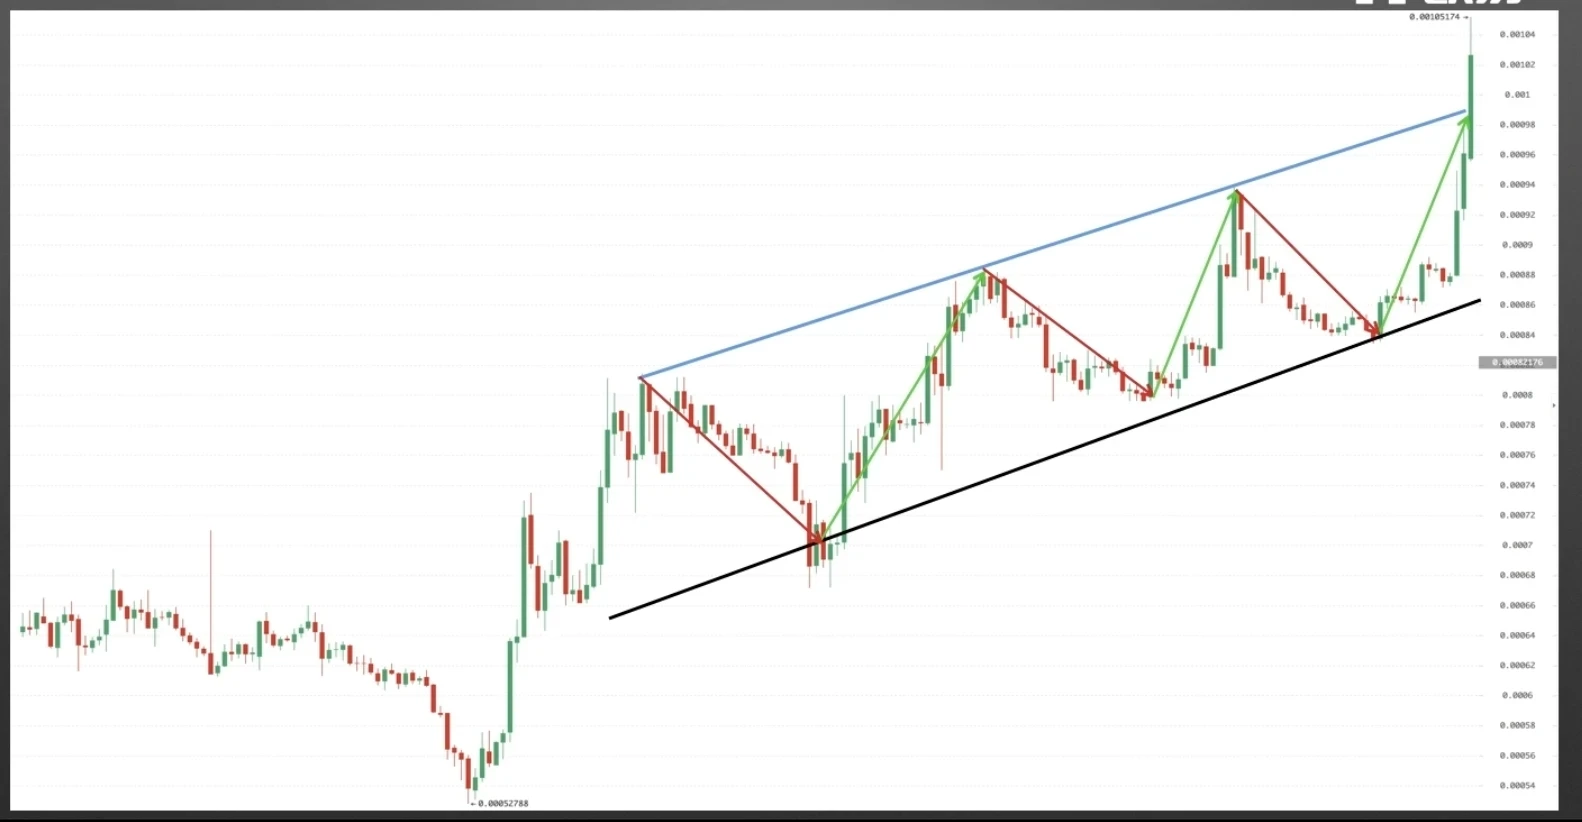
Let's look at a real case. Important note: when the candlestick breaks above the channel line, it signals the trend is accelerating and strengthening; when the candlestick breaks below the channel line, it signals the trend is weakening or reversing.
This concludes our lesson on "Understanding Trends." Next, we will cover "Trends and Time Cycles."
Disclaimer
This article may contain product-related content not applicable to your region. This article is intended solely to provide general information and makes no representation as to the accuracy or completeness of any facts presented. The views expressed herein are solely those of the author and do not represent the views of OKX. This article is not intended to provide, and should not be construed as, any recommendation, including but not limited to: (i) investment advice or investment recommendations; (ii) offers or solicitations to buy, sell, or hold digital assets; or (iii) financial, accounting, legal, or tax advice. Holding digital assets (including stablecoins) involves a high degree of risk and may be subject to significant price volatility, and could even become worthless. You should carefully consider whether trading or holding digital assets is appropriate for you based on your financial situation. For questions about your specific circumstances, please consult your legal/tax/investment professional. Any information contained herein (including market data and statistics, if applicable) is provided for general reference purposes only. While all reasonable precautions have been taken in preparing such data and charts, we make no representations as to the accuracy or completeness of any facts expressed herein, and accept no liability therefor. © 2025 OKX. This article may be reproduced or distributed in its entirety, or excerpts of 100 words or less may be used, provided such use is non-commercial. Any reproduction or distribution of the full article must prominently state: "This article is copyrighted © 2025 OKX, used under permission." Permitted excerpts must cite the article title and include attribution, e.g., "Article Title, [Author Name (if applicable)], © 2025 OKX." Some content may have been generated or assisted by artificial intelligence (AI) tools. Derivative works and other uses of this article are not permitted.
Show More
Recommended Reading

Can You Profit from Bitcoin's Decline? How to Trade Contracts
As the cryptocurrency market represented by Bitcoin continues to expand, derivatives trading has emerged in various forms beyond spot trading, serving as a risk hedging tool. Among them, contract trading has garnered the most attention. What are contracts? Contracts are the most common form of trading in the cryptocurrency derivatives market. Digital assets contract trading refers to an agreement between buyer and seller to trade a specific asset at a predetermined price at a future date.
January 16, 2026

Simpler Than Copying Strategies? Follow Top Traders in One Click on OKX and Let Them Earn for You
Whether in traditional finance or the cryptocurrency market, strategic trading is a crucial component of the trading system. When facing complex trading conditions and extreme market conditions, even with solid theoretical knowledge and extensive trading experience, it's easy to miss trading opportunities or make poor decisions influenced by emotions. Strategic trading is an effective tool to address these challenges. Now that you have your trading tools, how do you
November 21, 2025

5, Strategic Trading Series—Dollar-Cost Averaging (DCA)
Preface: We often wonder: during a bull market, there are many digital assets that surge. If we could consistently capture coins with significant gains, for example catching one that doubles every month, after a year your assets would grow to 2 to the 12th power—that's 4,096 times the original! That's staggering, though virtually impossible to achieve because it's nearly impossible to consistently catch surging coins. This is a common problem many users face: during a bull market, although
November 3, 2025

Which Countries/Regions Do Not Support OKX Registration
OKX currently does not provide services to customers in the following regions: certain U.S. territories such as New York, Texas, Puerto Rico, American Samoa, Guam, the Commonwealth of the Northern Mariana Islands, the U.S. Virgin Islands (St. Croix, St. John, and St. Thomas), Cuba, Iran, North Korea, Crimea, Malaysia, Syria, Bangladesh, and Bolivia. For more details, please refer to the OKX Terms of Service.
April 25, 2024

Quick Guide to OKX Products and Features
OKX (www. okx. com) is one of the world's leading digital assets service platforms, primarily serving global users with Bitcoin, Ethereum and other digital assets spot and derivatives trading services, while also exploring the world of DeFi, dApp, NFT and GameFi with our users. On OKX, you can enjoy seamless spot and contract trading experiences, stay updated on tokens in trending sectors/concepts, and much more.
April 25, 2024

Zero Basics to Learn K-line | 5 Importance of Candlestick Pattern Combinations
Trends determine rise and fall; master the language of price; signals guide your trades; quit trading on gut feeling. 1, Bullish Candlestick Combinations at Key Levels In the previous two chapters of this section, we covered bullish and bearish candlestick combinations. However, these combinations aren't effective in just any position. In this lesson, we will explain why the position where a combination appears matters. Where can bullish combinations be most effective? First scenario: in a clear uptrend, the immediately preceding
April 25, 2024


