
K线 from Zero: Lesson 7 | Trends and Time Frames
Trends drive prices — learn to read their language;
Signals guide trades — move beyond guesswork Trading.
Hello everyone. Today we cover Section 2 of the Trends series — Trends and Time Frames.
1. Trend Time Frames
Have you ever been puzzled when one time frame shows a bullish trend while another shows a bearish trend?
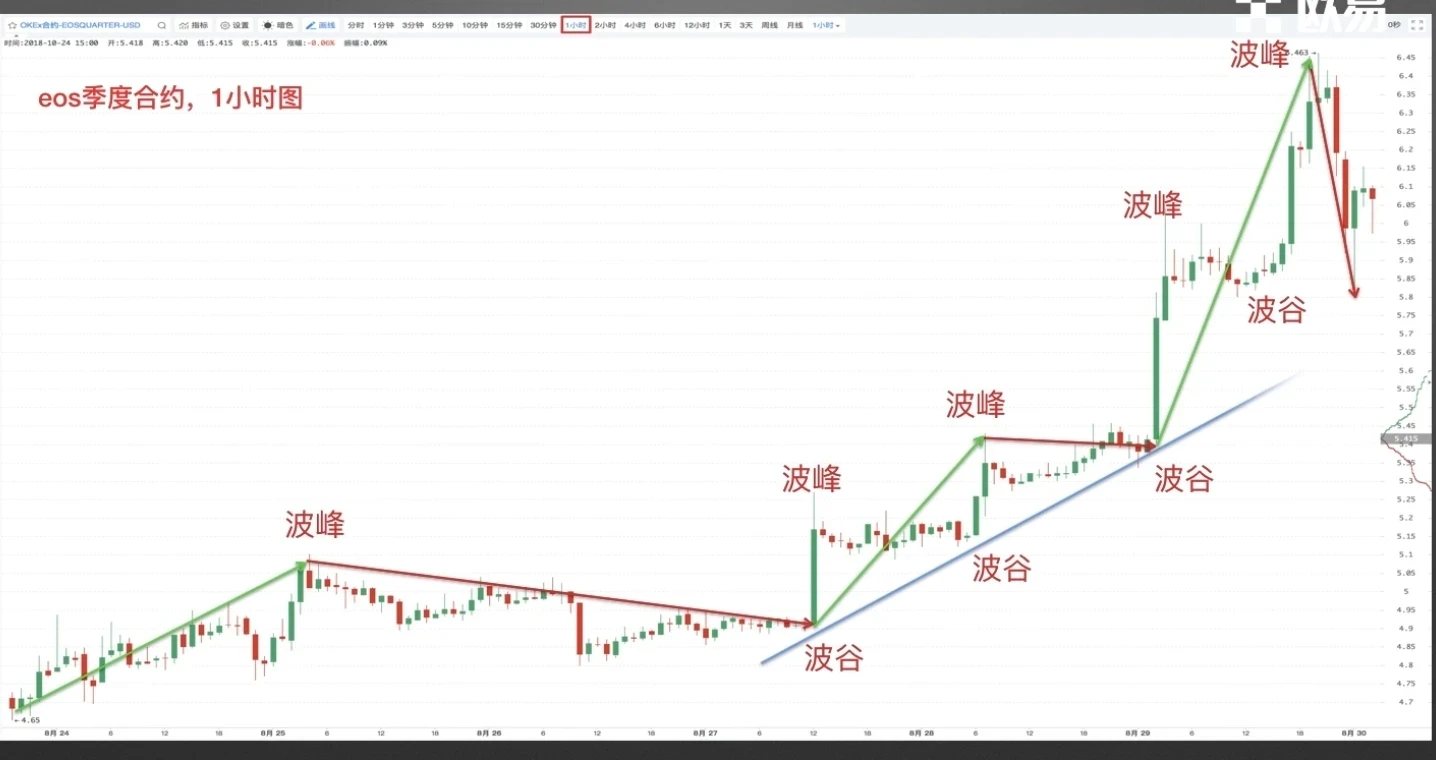
As shown: the OKX Futures section EOS Quarterly contract 1-hour chart. Peaks and troughs are progressively higher, forming a clear uptrend.
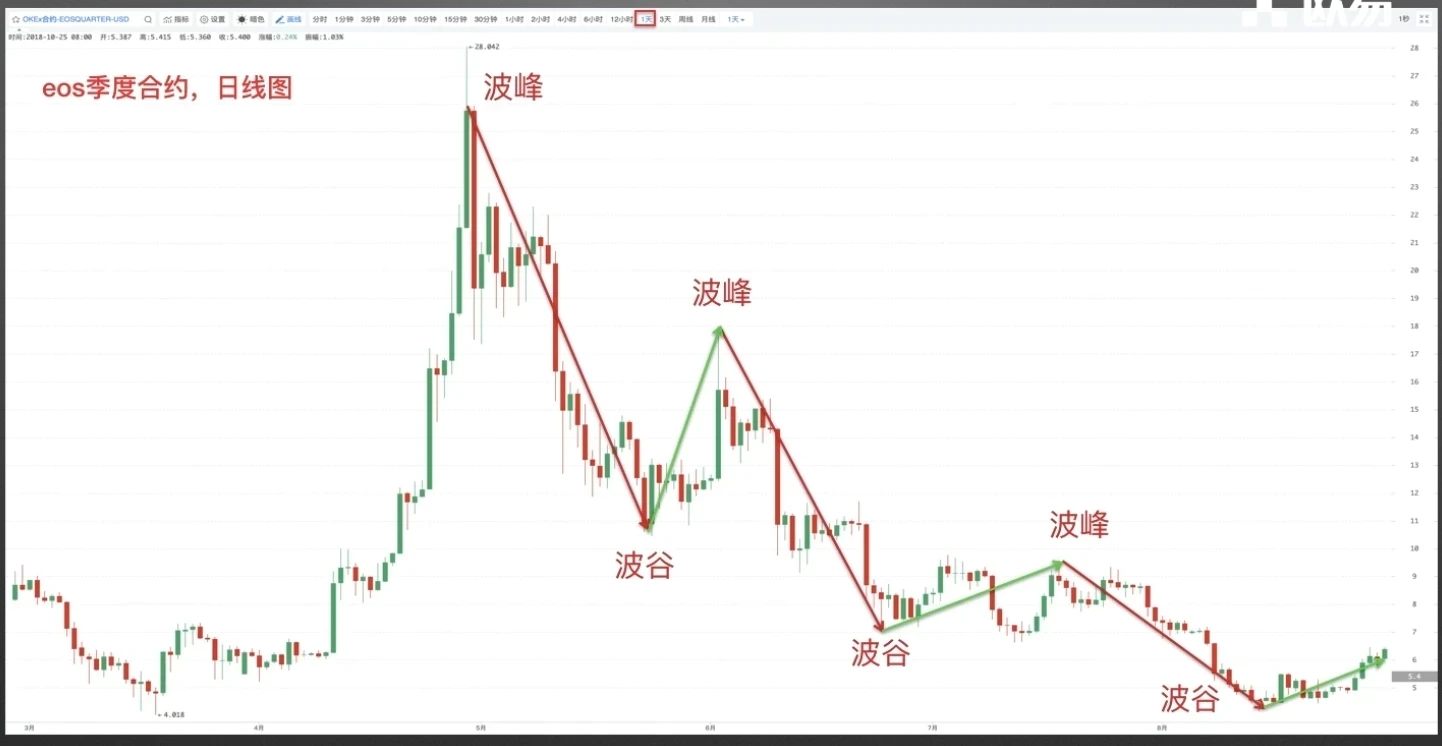
However, when the 1-hour chart is switched to the Daily chart, peaks and troughs are progressively lower, forming a downtrend.
You must be wondering — should I go long or short? The answer lies in the trend's time frame.
① In the crypto market, trends lasting a few hours are generally referred to as short-term trends, the primary reference for short-term Trading; ② Trends spanning a few hours to a few days are medium-term trends, the primary reference for medium-term Trading; ③ Trends lasting days, weeks, or longer are long-term trends, the primary reference for long-term Trading.
Upon closer inspection, the wave-like trends reveal that a long-term trend is actually composed of multiple medium-term trends, and a medium-term trend is composed of multiple short-term trends.
Looking at the trend evolution chart,
assuming this is a 1-hour candlestick chart, then switching to the longer-period Daily chart.
We find that the short-term uptrend becomes part of a medium-term downtrend.
Switching to an even larger Weekly or Yearly chart, we find that both short-term and medium-term trends are part of a long-term trend.
What investors typically refer to as a bull or bear market is generally the long-term trend spanning months or years.
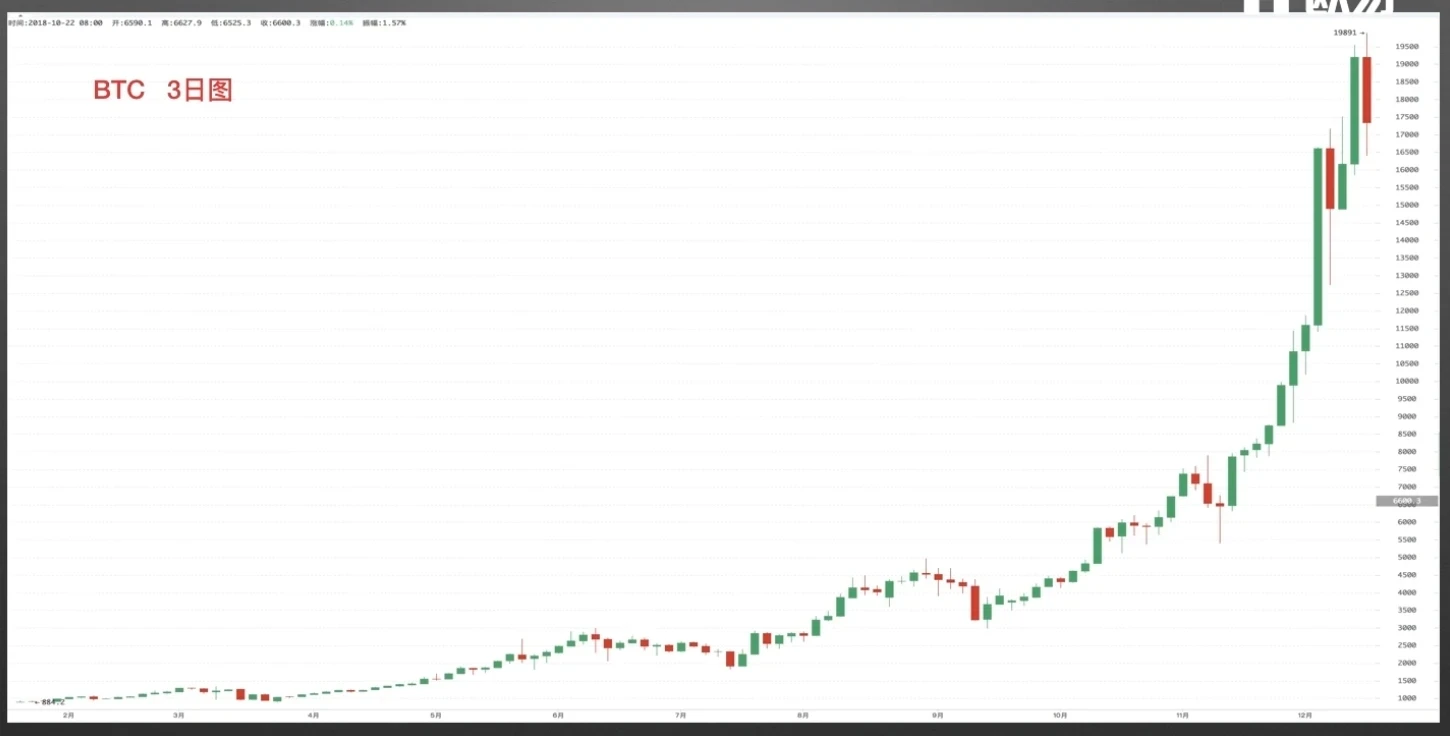
The chart shows the BTC 3-Day chart, where each candlestick represents three days. As the chart shows, this major Bitcoin bull run actually began in mid-2015 and continued until the end of 2017 — a super bull market lasting approximately two and a half years.
2. Trends — Primary vs. Secondary
In addition to classifying trends by duration into short, medium, and long-term, Dow Theory further categorizes trends into: primary trends, secondary trends, and minor trends.
Primary trend: A comprehensive and broad rise or fall in market prices, with the longest time span and the largest price movements. A primary trend requires more time and greater fund博弈 to form, so trends shown on larger time frames are more reliable — for example, trends on the daily or weekly chart are extremely difficult for traders to manipulate over the long term.
Secondary trend: Operating within the primary trend, it adjusts or corrects the market's upward or downward movement. Put simply, a secondary trend is relative to the primary trend. If the primary trend is a major bull market, the secondary trend is the pullback during the upswing; if the primary trend is a bear market, the secondary trend is the rally during the decline. A secondary trend typically retraces between one-third and two-thirds of the primary trend.
Minor trend: Intraday or even smaller-cycle fluctuations, a component of the secondary trend, and the easiest to manipulate.
Due to their short duration and susceptibility to manipulation, minor trends are not recommended for regular investors to trade.
A major trend is composed of minor trends; minor trends tend to服从于 the major trend. When a reversal occurs, minor trends are more sensitive than the larger cycles.
Having understood the nested structure of trends, we know that no trend lasts forever — like life, they follow a cycle from birth to decline. How do we determine when a trend has ended? In an uptrend, when a pullback low falls below the most recent starting point of the upswing, the uptrend ends. In a downtrend, when a rally high rises above the most recent starting point of the decline, the downtrend ends.

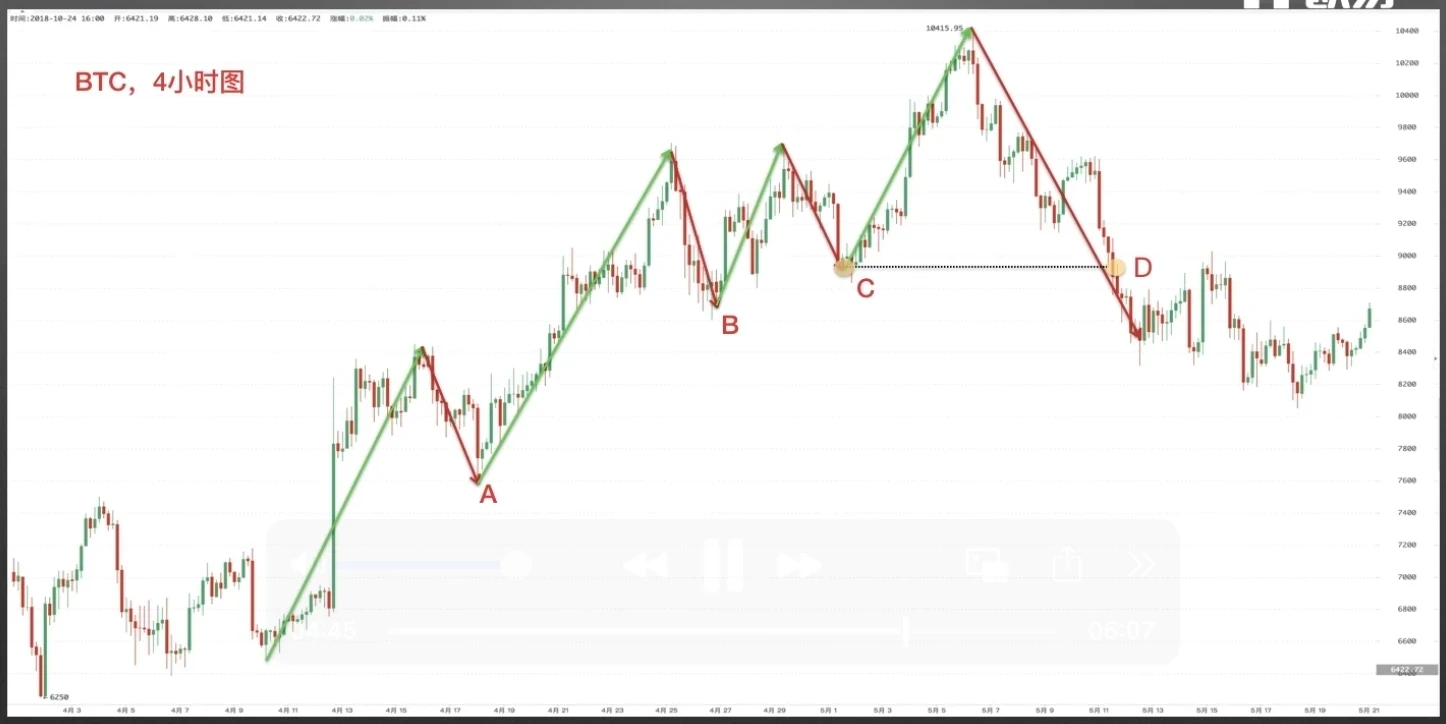
Screenshot from OKX Spot Trading section BTC/USDT 4-hour chart. Points A, B, and C show progressively higher troughs, forming an uptrend. When the price pulls back to point D, which falls below the most recent starting point C, the uptrend is confirmed to have ended.
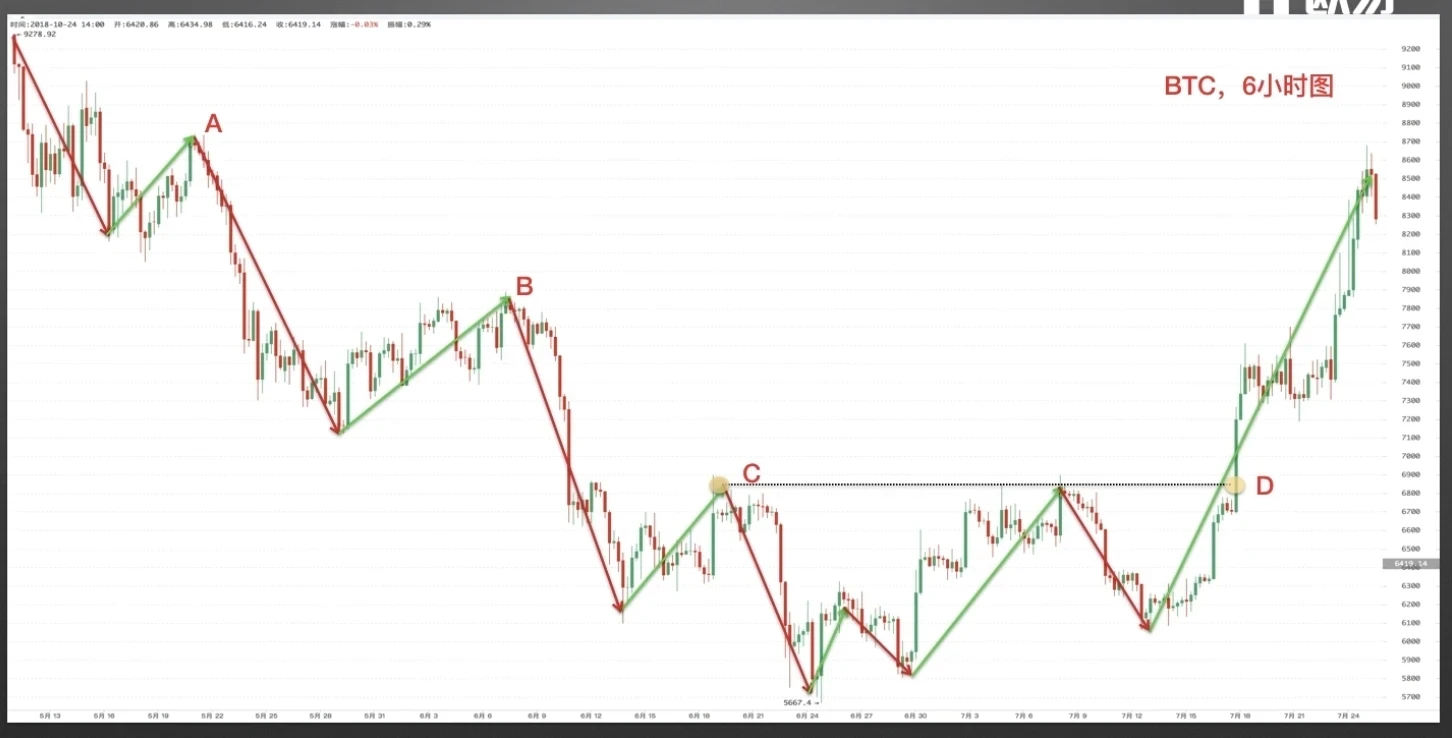
Screenshot from OKX Spot Trading section BTC/USDT 6-hour chart. Points A, B, and C show progressively lower peaks, forming a downtrend. When the price rallies to point D, which rises above the most recent starting point C, the downtrend is confirmed to have ended.
Long-term investors focus most on the primary trend; their single trade positions may last for months or even one to two years, and their primary charts are daily, weekly, or monthly. Short-term investors pay more attention to secondary and minor trends, as these offer substantial short-term profits.
Crypto enthusiasts often say: "One day in crypto is a year in the real world." This is because the crypto market never sleeps and has no price涨跌 limits, so its pace is much faster than other markets.
Back to the original question — one time frame shows bullish while another shows bearish. How should you trade? Whatever type of investor you are, use the trend type that matches your trading style.
Disclaimer
This article may contain product-related content not applicable to your region. This article is provided for general informational purposes only and we make no representation as to the accuracy, completeness, or appropriateness of any information provided. The views expressed in this article are those of the author alone and do not necessarily reflect the views of OKX. This article is not intended to provide, and should not be relied upon as, (i) investment advice or investment recommendations; (ii) an offer or solicitation to buy, sell, or hold digital assets; or (iii) financial, accounting, legal, or tax advice. Holdings in digital assets (including stablecoins) involve a high degree of risk and may fluctuate dramatically, or even become worthless. You should carefully consider whether trading or holding digital assets is suitable for you given your financial situation. Please consult your legal/tax/investment professional for questions regarding your specific circumstances. Any information herein (including market data and statistics, if applicable) is provided for general reference purposes only. While we have taken all reasonable steps in preparing such data and charts, we make no representation as to the accuracy or completeness of any facts expressed herein and accept no liability therefor. © 2025 OKX. This article may be reproduced or distributed in full, and may be used in excerpts of 100 words or less, provided that such use is non-commercial in nature. Any reproduction or distribution of the full article must also include the following attribution: "This article is copyrighted © 2025 OKX, used under permission." Permitted excerpts must cite the article name and include the source, for example: "Article name, [author name (if applicable)], © 2025 OKX". Some content may have been generated or assisted by artificial intelligence (AI) tools. Derivative works and other uses of this article are not permitted.
Show More
Recommended Reading

Earn Profit Even When Bitcoin Drops? How to Trade Futures Contracts
As the cryptocurrency market represented by Bitcoin continues to expand, derivatives trading has emerged in various forms beyond spot trading, serving as a risk-hedging tool. Among them, futures trading has attracted the most attention. What is futures trading? Futures contracts are the most common form of trading contract in the cryptocurrency derivatives market. Digital assets futures trading refers to an agreement between buyers and sellers to trade a specific asset at a predetermined price at a future date.
January 16, 2026

Simpler Than Copying Strategies? Copy Top Traders on OKX With One Click and Let Them Earn for You
Whether in traditional finance or the cryptocurrency market, copy trading is a crucial component of the trading ecosystem. When facing complex trading conditions and extreme market volatility, even those with solid theoretical knowledge and extensive trading experience can easily miss trading opportunities or make poor decisions driven by emotion. Copy trading is an effective tool that addresses these challenges. Now that you have the trading tools, how do you put them to use?
November 21, 2025

5. Strategic Trading Series — DCA Bot
Preface: We often wonder: in a bull market, there are many digital assets that surge in value. If you could consistently capture coins with large gains — say, one that doubles every month — your assets would grow by 2 to the 12th power in a year, a staggering 4,096x. Of course, this is nearly impossible because it's difficult to continuously catch assets that make big moves. This is a common challenge many users face: during a bull market, although there are many assets rising,
November 3, 2025

Countries/Regions Where OKX Registration Is Not Supported
OKX currently does not provide services to customers in the following regions: certain U.S. territories, including New York, Texas, Puerto Rico, American Samoa, Guam, the Northern Mariana Islands, the U.S. Virgin Islands (St. Croix, St. John, and St. Thomas), Cuba, Iran, North Korea, Crimea, Malaysia, Syria, Bangladesh, and Bolivia. For more details, please refer to OKX's Terms of Service.
April 25, 2024

Quick Guide to OKX Products and Features
OKX (www.okx.com) is one of the world's leading digital asset service platforms, primarily offering spot and derivatives trading services in Bitcoin, Ethereum, and other digital assets to users worldwide, while also exploring the world of DeFi, dApps, NFTs, and GameFi together with its users. On OKX, you can enjoy seamless spot and futures trading experiences, stay updated on tokens from trending sectors/concepts in real time, and much more.
April 25, 2024

K线 from Zero: Lesson 5 | The Importance of Candlestick Pattern Applications
Trends drive prices — learn to read their language; signals guide trades — move beyond guesswork trading. 1. Bullish Candlestick Patterns at Key Levels In the previous two chapters of this series, we covered bullish and bearish candlestick pattern applications, but these patterns are not effective at every location. In this section, we explain why the position where patterns appear matters. Where do bullish patterns work best? First scenario: within a clear uptrend, when appearing near a
April 25, 2024


