Learn K-Line Patterns from Scratch | 9 Bottom-Picking Patterns—Inverse Head and Shoulders
Price movements have trends; understand the language of prices;
Buy and sell signals exist; say goodbye to emotional trading.
Investors often ask: when can you buy the dip? Especially in long bear markets, this topic comes up frequently. In this lesson, we'll learn together about one of the bottom-picking patterns: the inverse head and shoulders pattern.
1. The Inverse Head and Shoulders Pattern
The name sounds a bit strange—what does the inverse head and shoulders pattern look like? Let's unveil it together and look at a real Bitcoin price chart to find the inverse head and shoulders pattern.
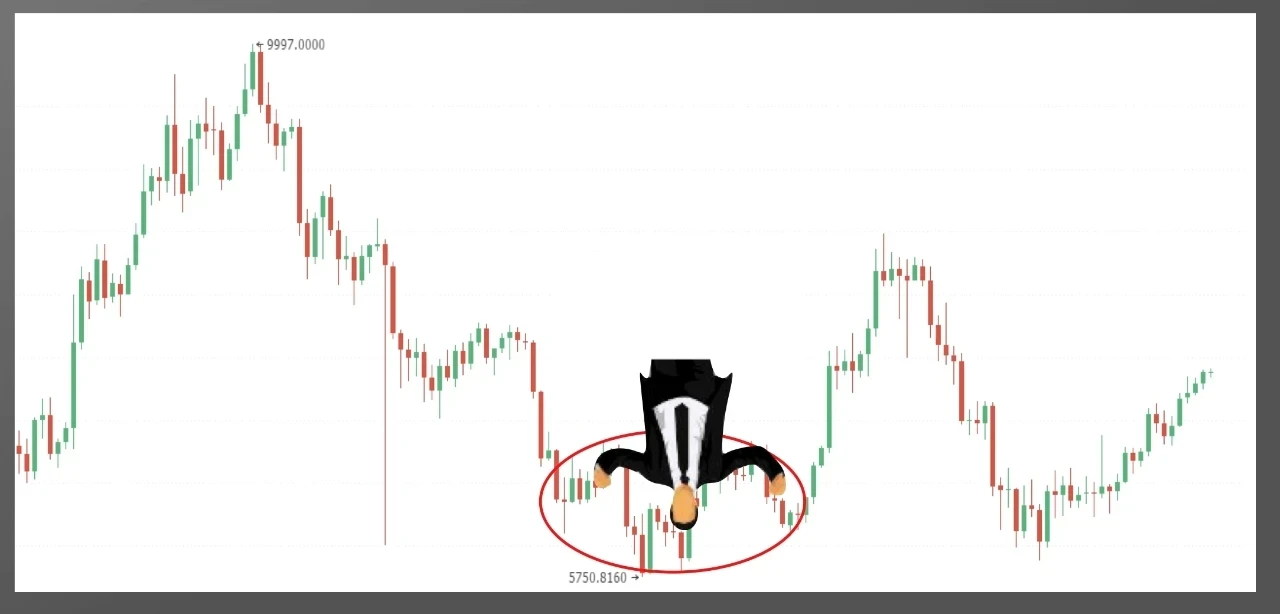
As shown in the figure, Bitcoin's price trend in the first half of 2018. The upward rally marked by the green arrow left a deep impression on many, but how many successfully bought the dip? The red line marks the inverse head and shoulders pattern. Named for its resemblance to a human figure, it's a typical bottoming pattern, hence the name "inverse head and shoulders pattern."
Through technical analysis, we simplify the complex candlestick chart.
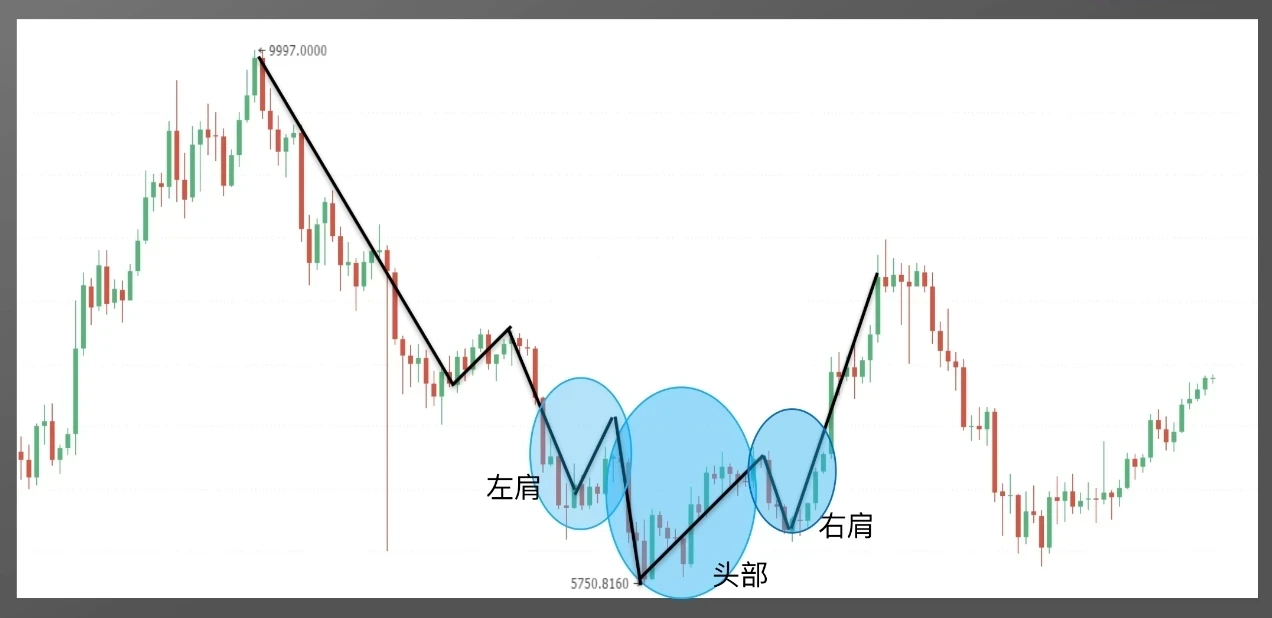
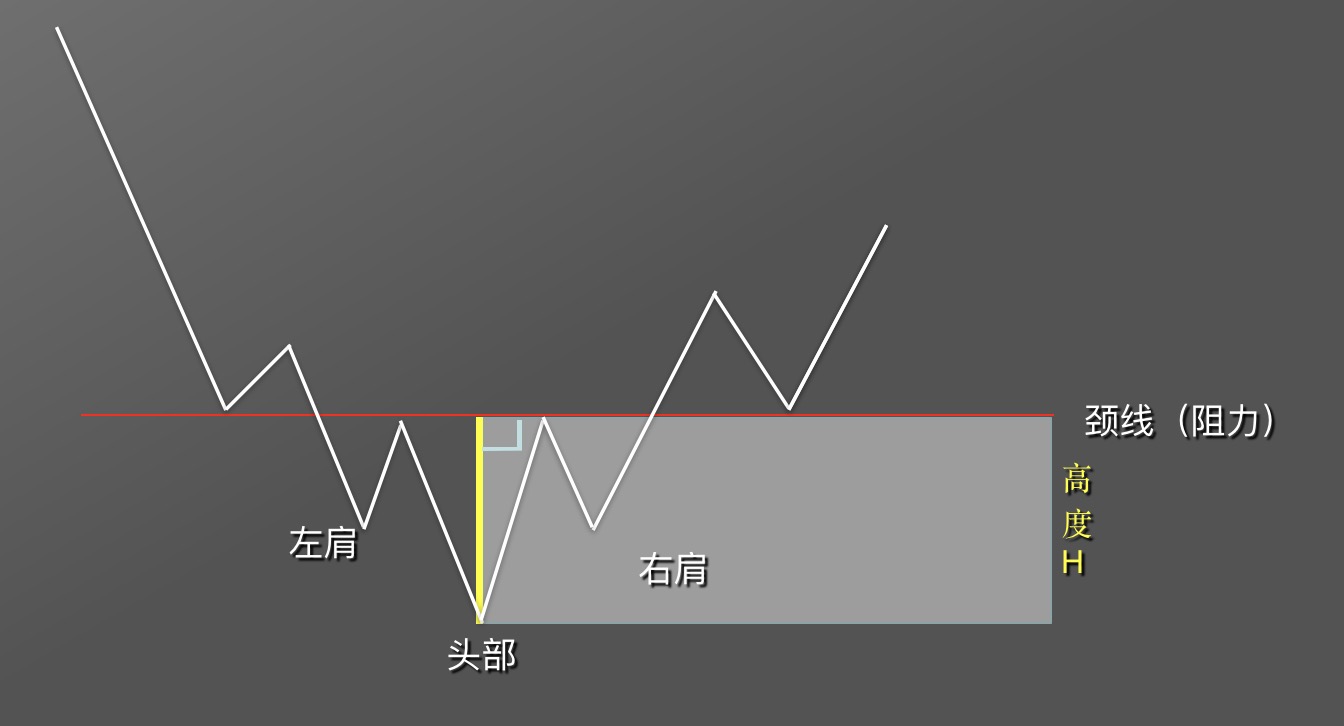
We get the left shoulder, head, and right shoulder. In this historical trend, we can clearly see that the original downtrend reversed into an uptrend after the inverse head and shoulders appeared.
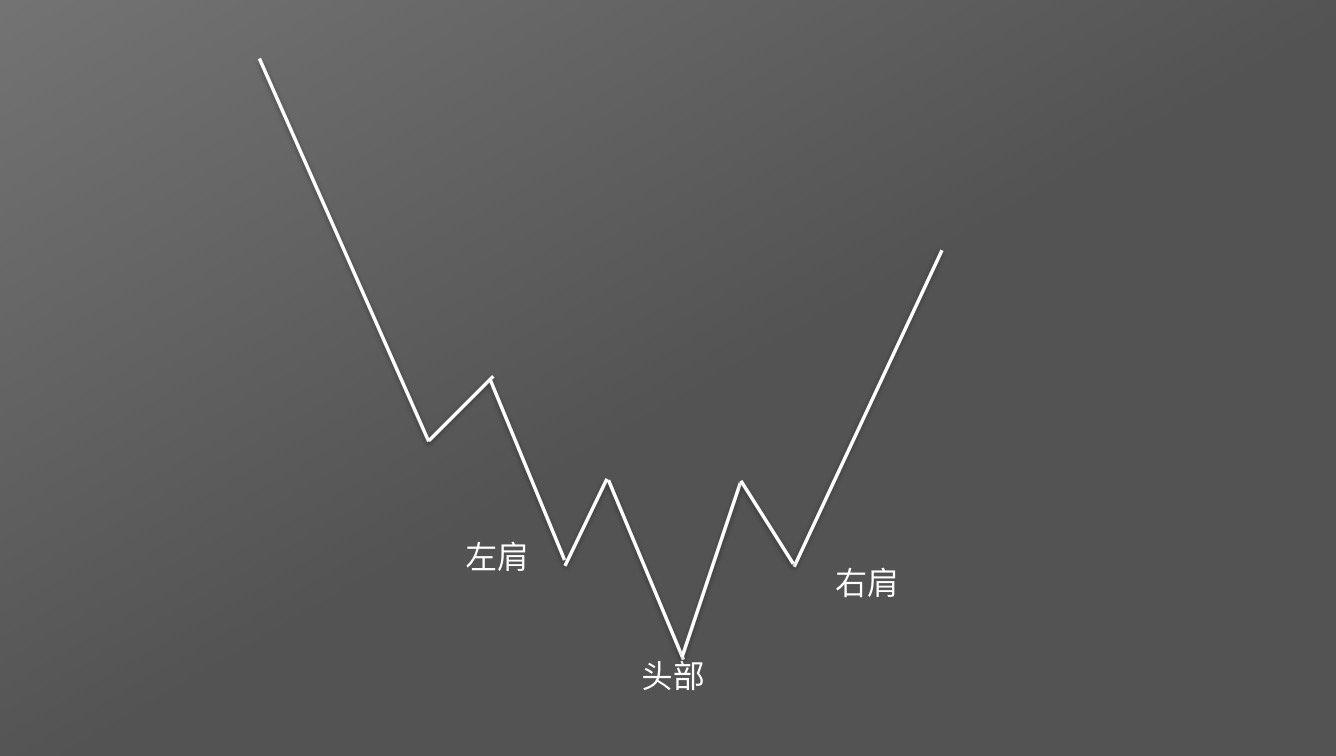
Let's extract the simplified inverse head and shoulders pattern to make its structure clearer and more concise.
2. Application Rules for Inverse Head and Shoulders—Buying
Now, we have a preliminary understanding of the inverse head and shoulders pattern. How can we predict the future and find buying opportunities before a big rally? To predict the future, we need a magical line. How do we draw this boundary line between bulls and bears?
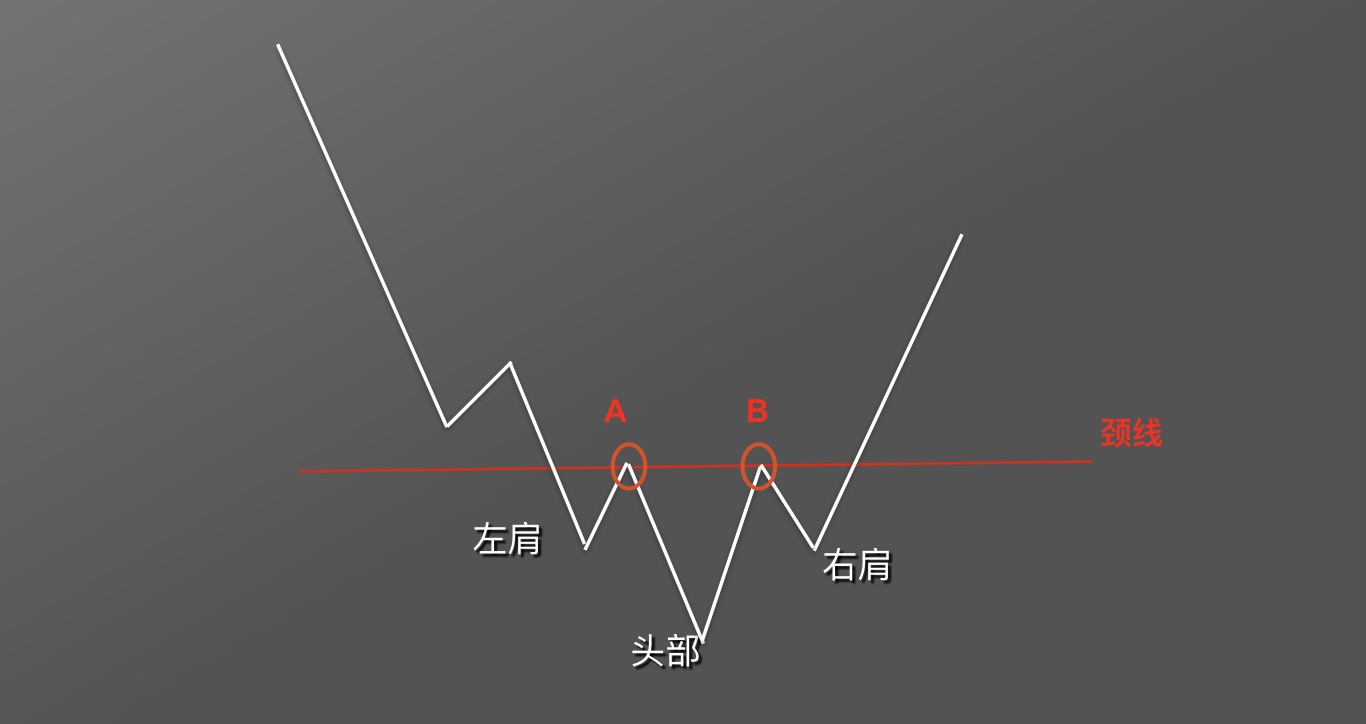
Math teachers teach us: two points determine a line. First, find point A, then point B. Using points A and B as reference, draw a straight line—this line is called the neckline.
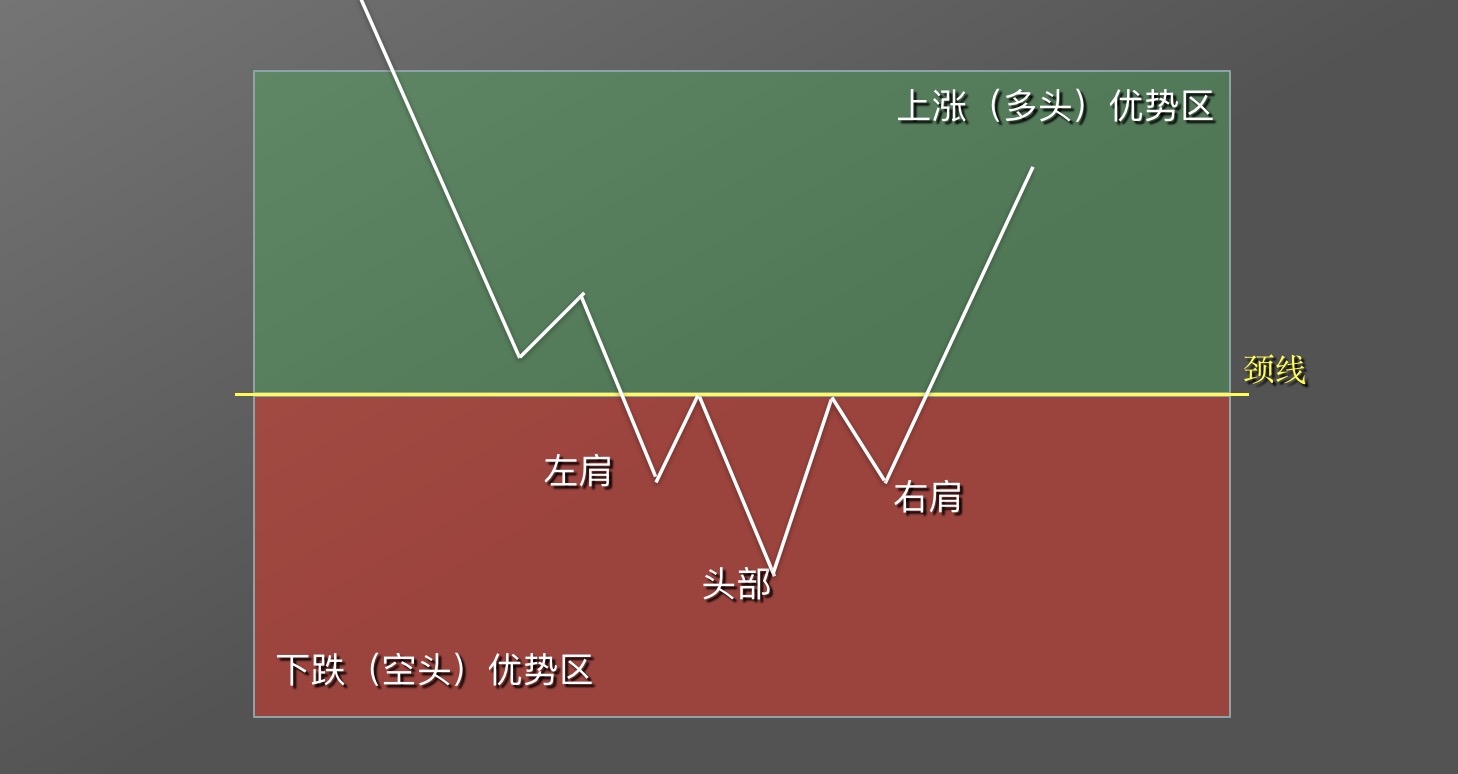
Above the neckline is the bullish advantage zone; in this range, it's suitable to go long, not short. Below the neckline is the bearish advantage zone; in this range, it's suitable to go short, not long.
When price is below the neckline, the neckline acts as resistance. Market behavior shows: near the neckline price, the number of investors willing to buy is significantly less than those willing to sell, creating upward resistance. With no new buyers entering the market, price naturally cannot break through the resistance line and follows the downward trend. Thus, the inverse head and shoulders pattern fails to form.
When price is near the neckline, investors buying at market price continuously enter, causing the number of willing buyers to finally exceed willing sellers, and price breaks through the resistance line in one move, forming a breakout uptrend. When important resistance is broken, investors who were watching gain confidence in future price increases and buy the coin, further driving price up. Of course, this inevitably includes the dying struggle of persistent bears, causing price to pull back to neckline support.
Future rises and falls are known—how to seize the best buying and selling opportunities?
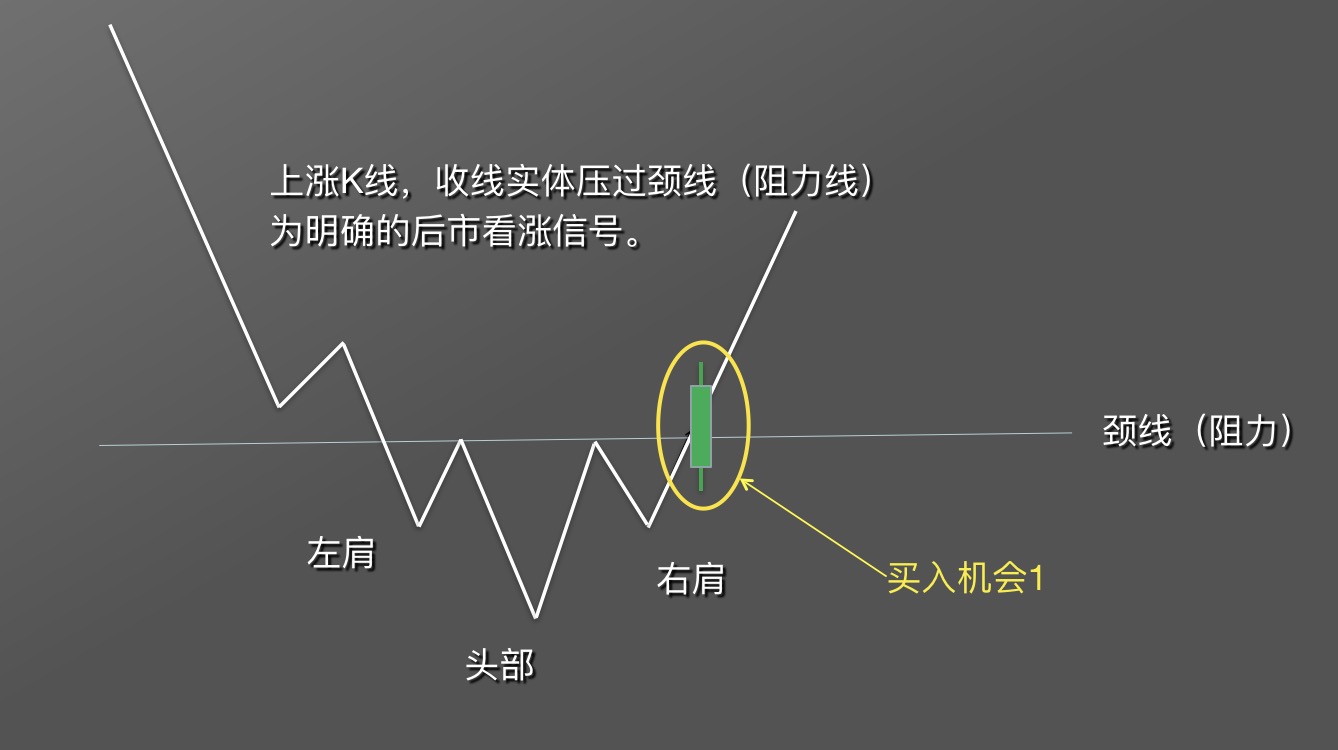
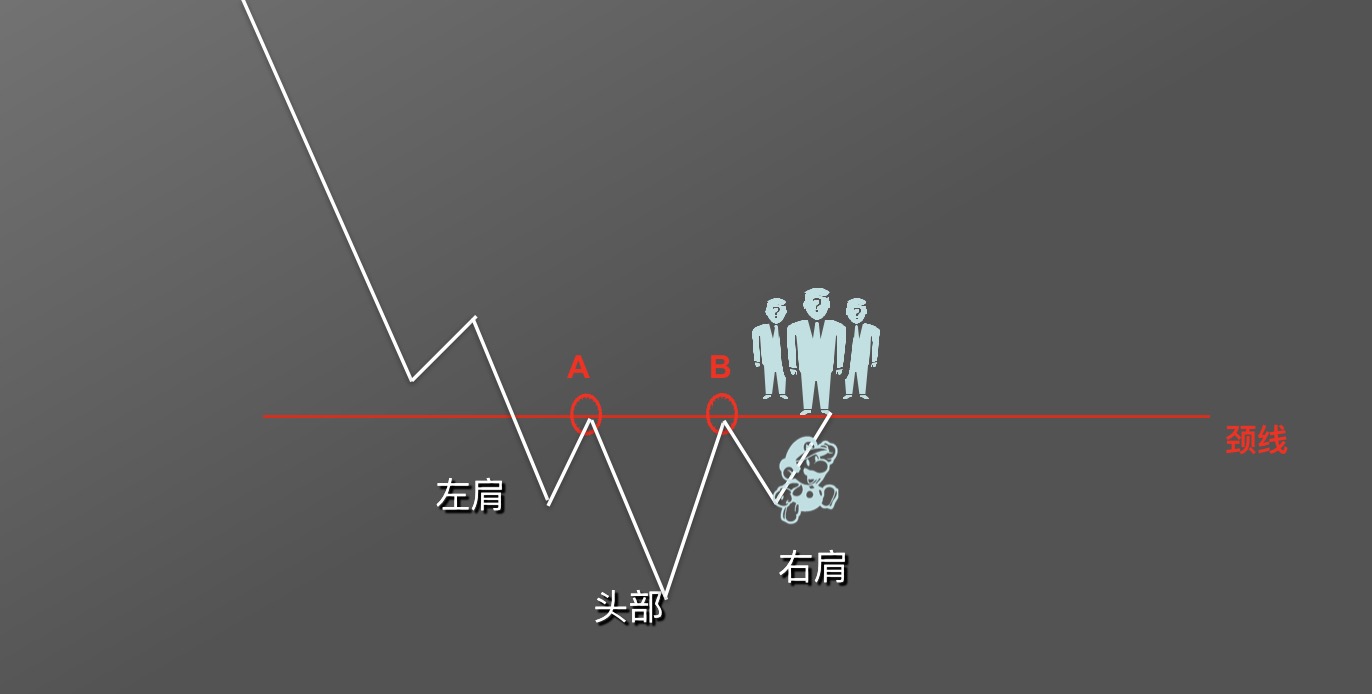
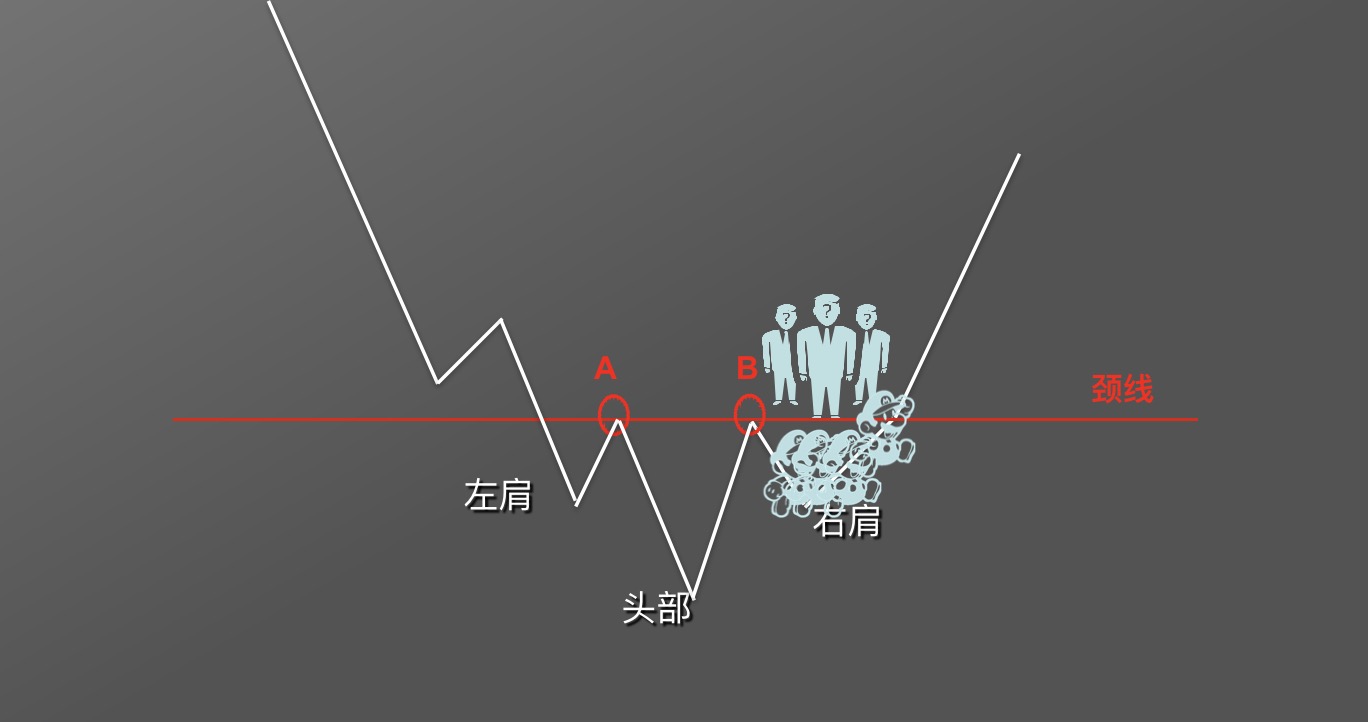
When an inverse head and shoulders pattern forms within a candlestick period, and the candlestick that breaks through the neckline is as shown in the figure—a green bullish candle with its body crossing the neckline—this is a clear bullish signal, forming the first buying opportunity. Once this pattern forms, the market will likely rise.
Since the market is always in a state of tug-of-war between bulls and bears, even when price forms an inverse head and shoulders pattern, there are still many sellers suppressing price increases.
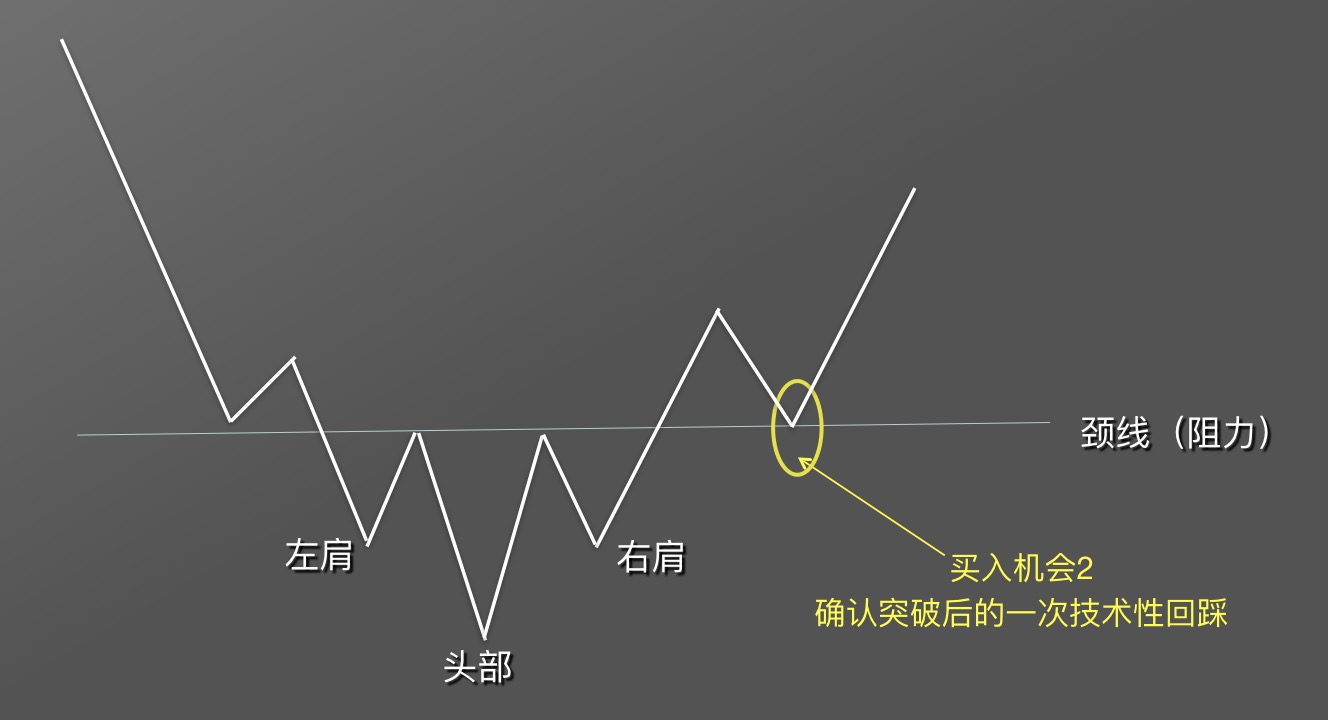
The figure shows price breaking through neckline, then forming a small decline, pulling back near the neckline price before rising again. We call this price movement pullback to confirm support. Pulling back to the neckline creates buying opportunity 2.
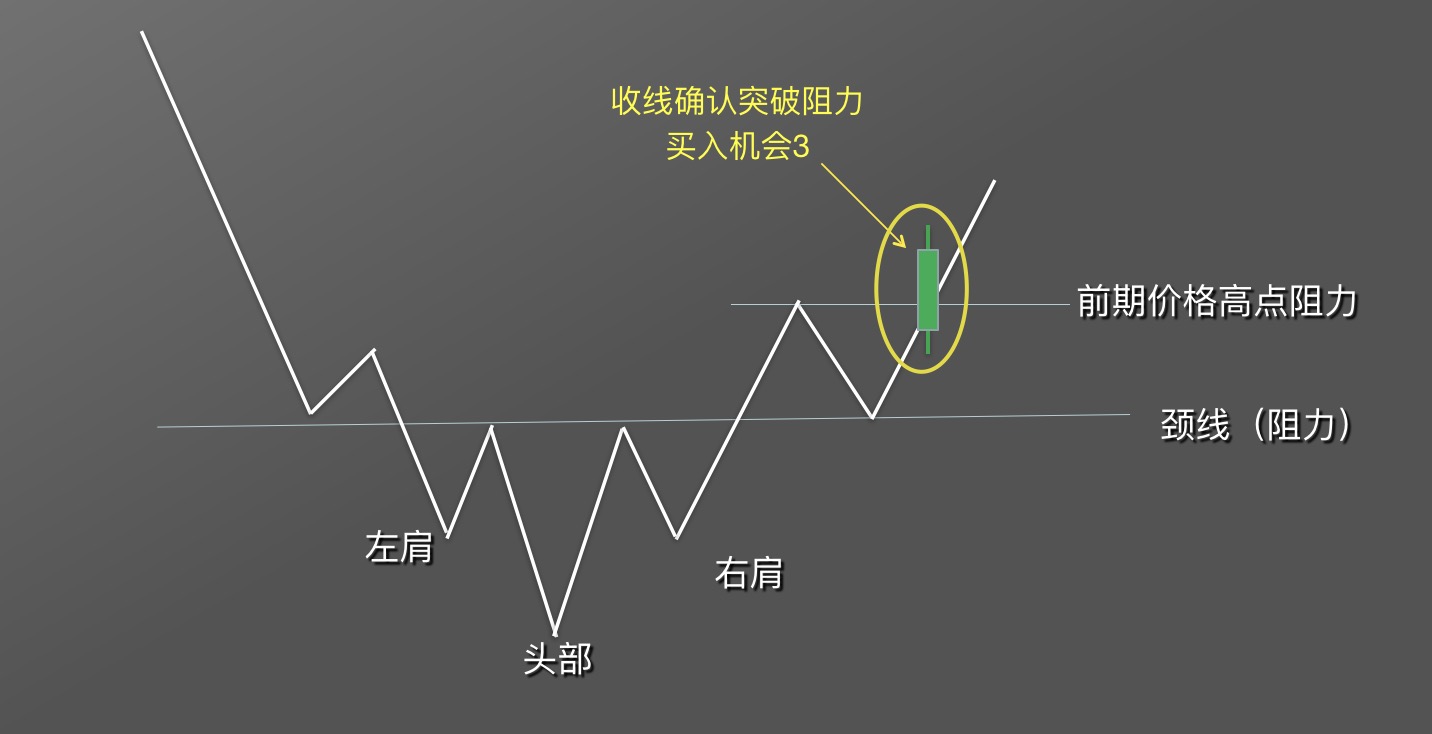
Buying opportunity 3 appears when price, after pulling back to the neckline, rises again to break the previous price high. The method to confirm the breakout is the same as before: look at the candlestick closing result within the period—whether the bullish candle body crosses the resistance line.
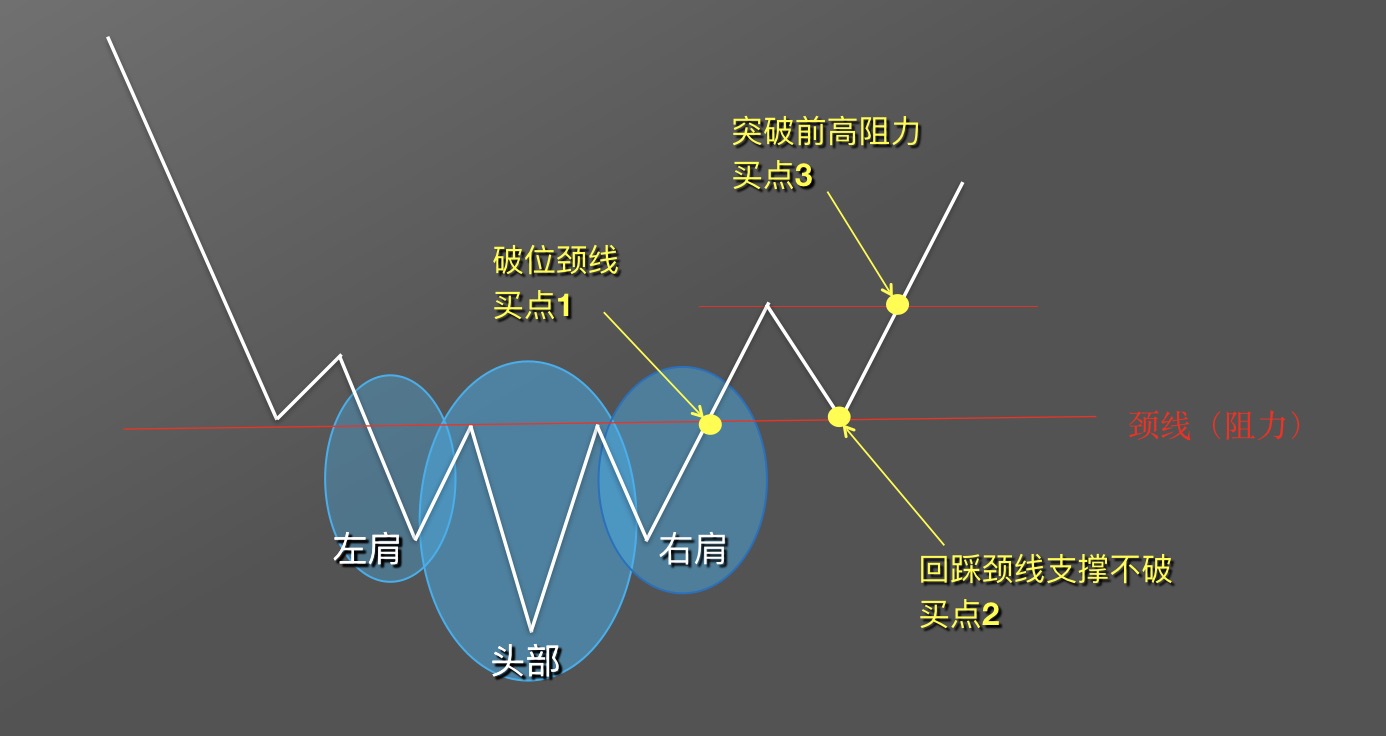
Let's summarize the application rules for the inverse head and shoulders pattern. First, confirm the three important components of the pattern: left shoulder, head, and right shoulder, and draw the important bull-bear reference line—the neckline.
As the market continues to change, we find three buying opportunities: breaking the neckline—buying opportunity 1, pulling back to neckline—buying opportunity 2, breaking previous high—buying opportunity 3.
Of course, no one can control the market. So not every inverse head and shoulders pattern appears textbook-perfect. It might surge straight up, or have sloping shoulders.
Investing requires knowing not just how to buy, but also how to sell. Don't just think about profits—understand how to manage risk.
3. Application Rules for Inverse Head and Shoulders—Selling
Earlier we learned how to identify buying opportunities through the inverse head and shoulders pattern. Now let's learn how to find selling opportunities. Use the inverse head and shoulders pattern to predict future upside targets.
First, draw a perpendicular line from the head's vertex to the neckline and set its height as H.
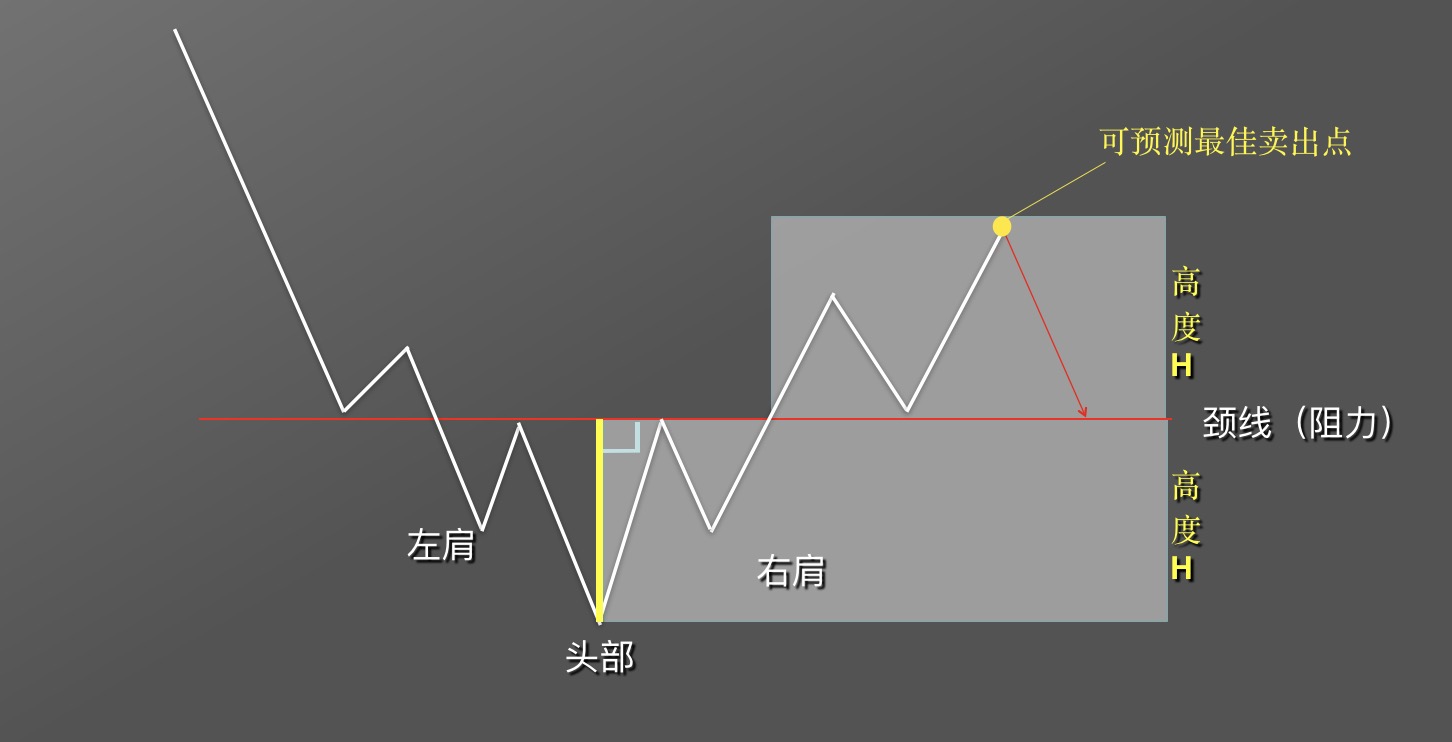
Move this perpendicular line as shown above the neckline. When future price rises to height H, it forms the best selling point within the predictable range. The market will likely form a decline afterwards. Of course, if the uptrend is strong, the rise may last longer and go higher. The excess is all beyond the predictable range.
Let's review a few real cases.
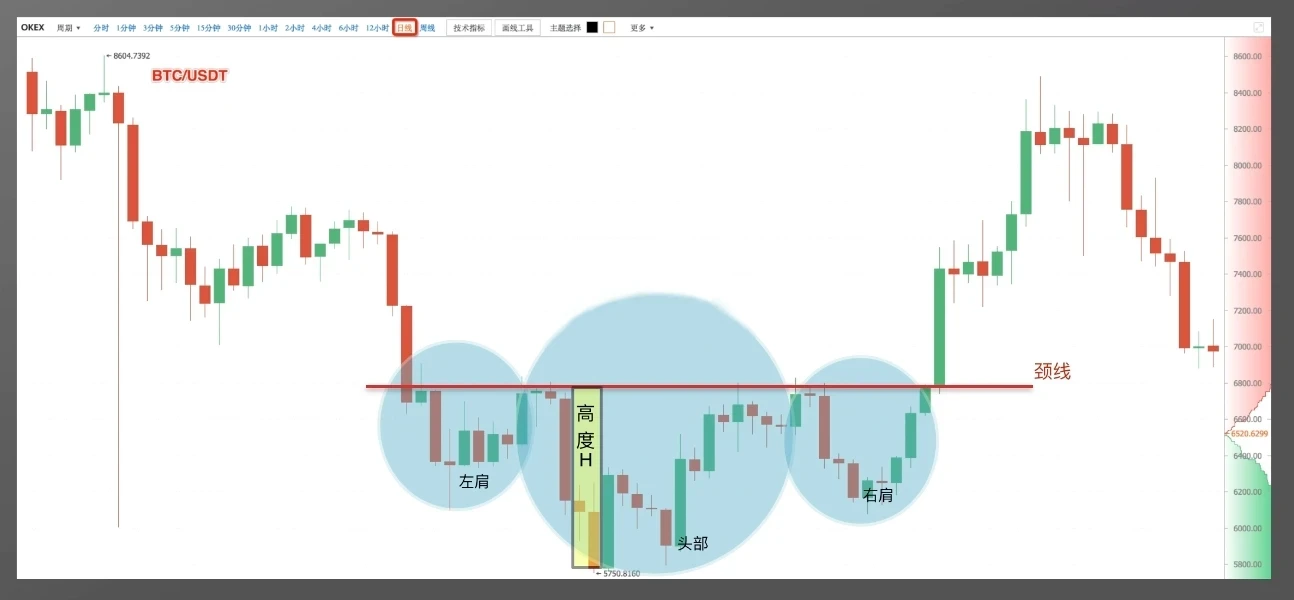
As shown, Bitcoin/USDT daily chart. The inverse head and shoulders pattern formed this time is relatively standard. After breaking the neckline, price rose rapidly, with only one buying opportunity.
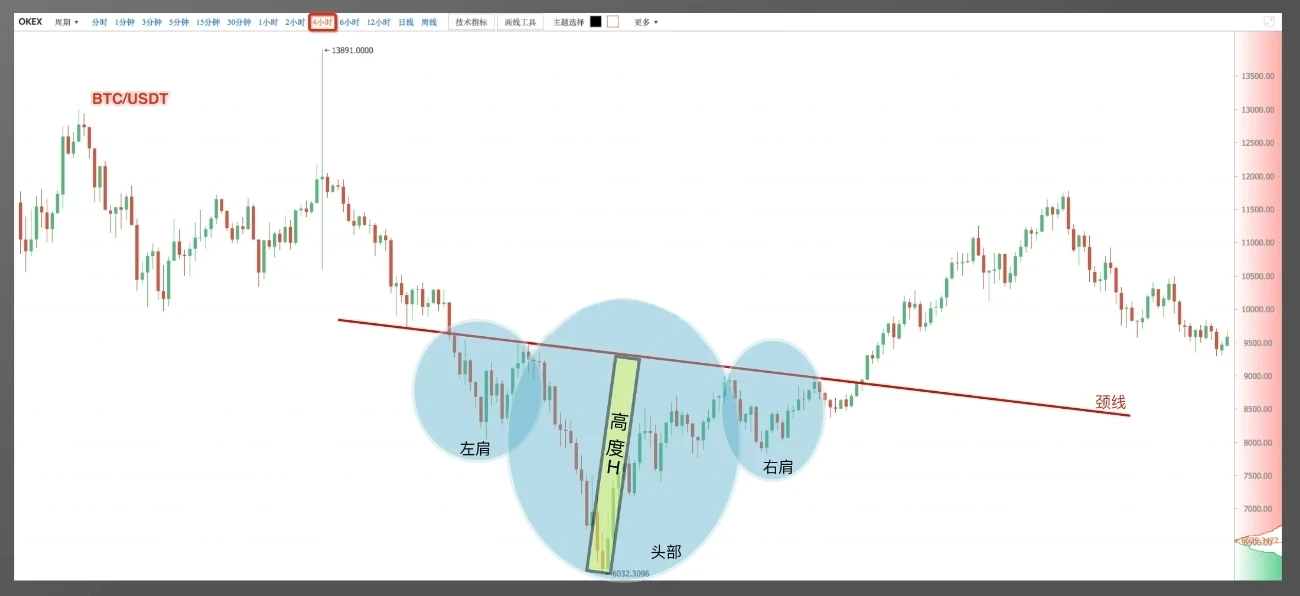
The second case shows Bitcoin/USDT 4-hour chart. The inverse head and shoulders pattern formed this time looks tilted. After price broke through the pattern, the uptrend was obvious, still giving only one buying opportunity.
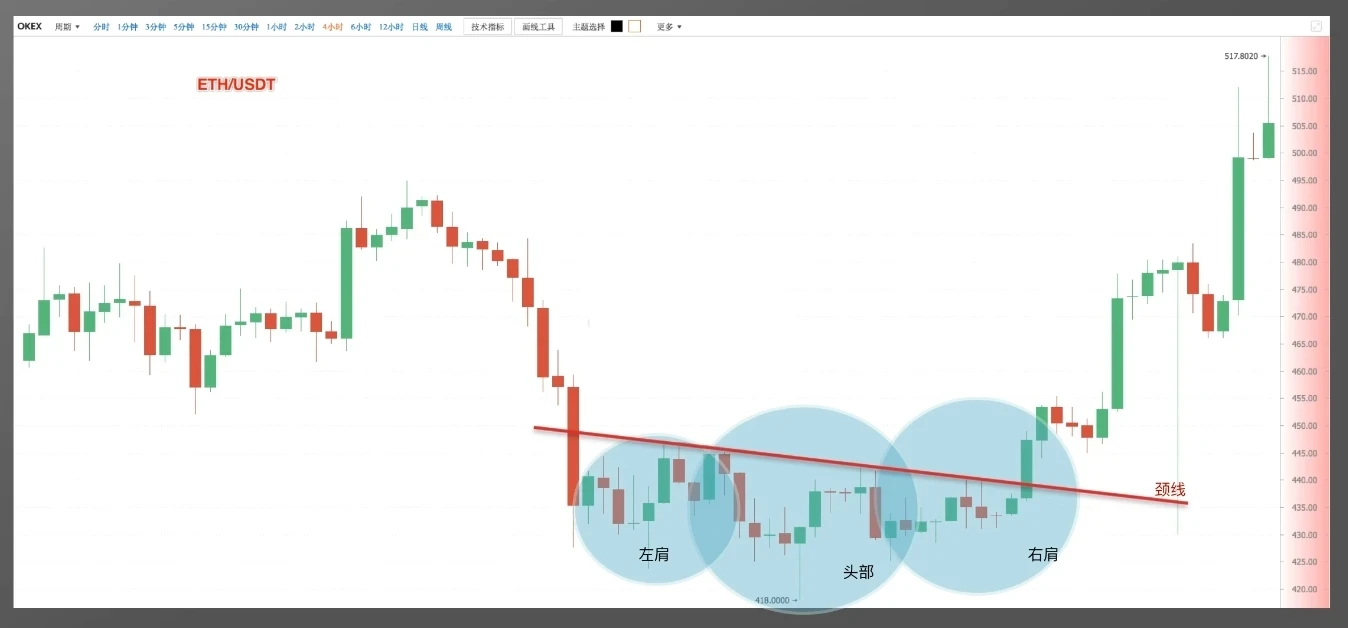
Case three: Ethereum/USDT 4-hour chart. The inverse head and shoulders pattern also appears tilted. After the pattern formed, price built a bottom, the original downtrend was reversed, and price rose all the way.
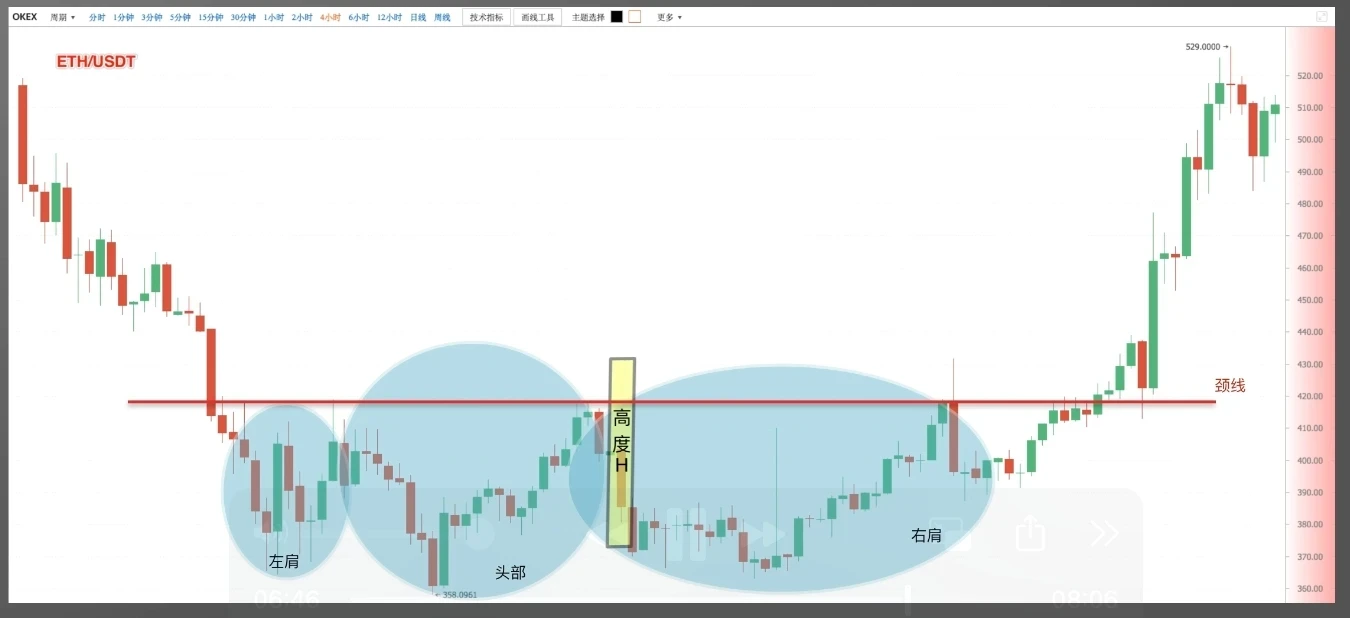
The last case: Ethereum/USDT 4-hour chart. The market took a long time to build this textbook-perfect inverse head and shoulders pattern. After price broke through the neckline, it formed pullback support. The entire rise process gave three buying opportunities.
The market changes instantly, like unpredictable weather. How to predict danger and avoid storms? The ancients said: when mountain rain is about to come, wind fills the building. Before big declines, the market often gives some signals.
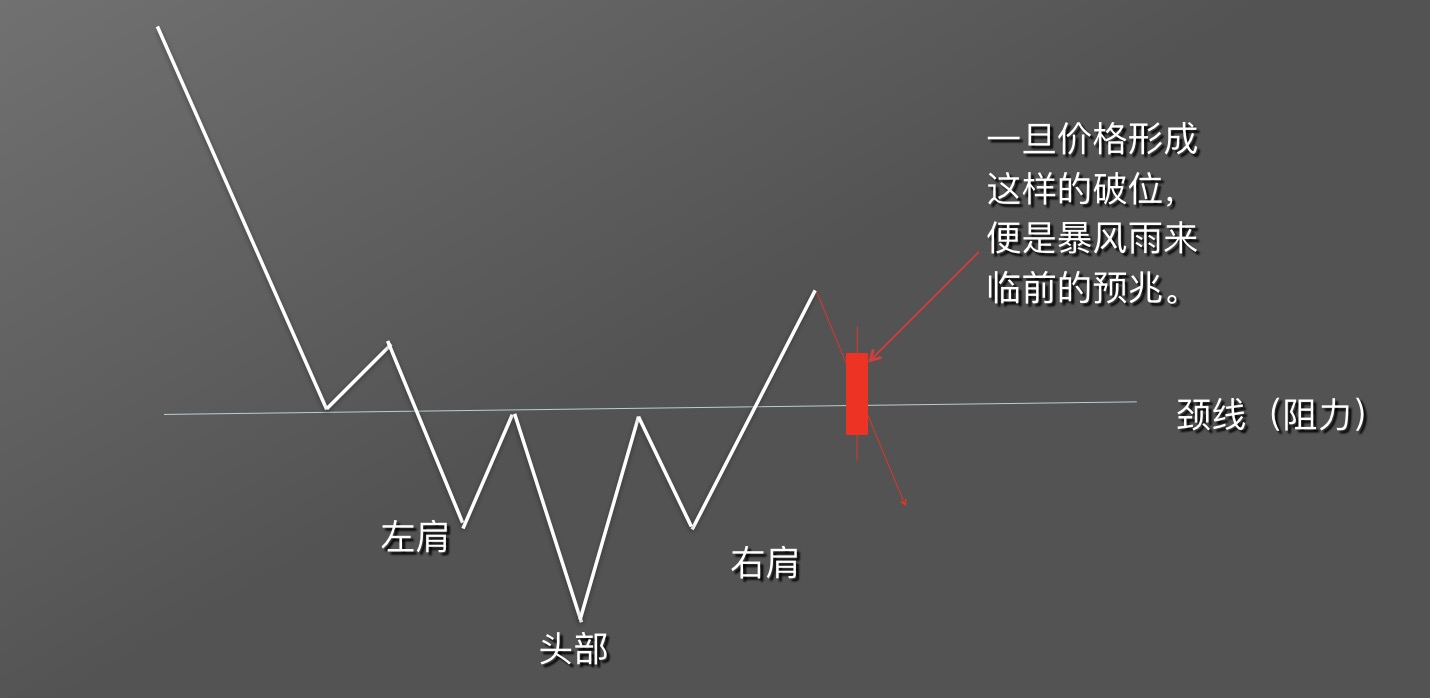
Even if price breaks through neckline resistance and forms an inverse head and shoulders, there's no guarantee the rise will be foolproof.
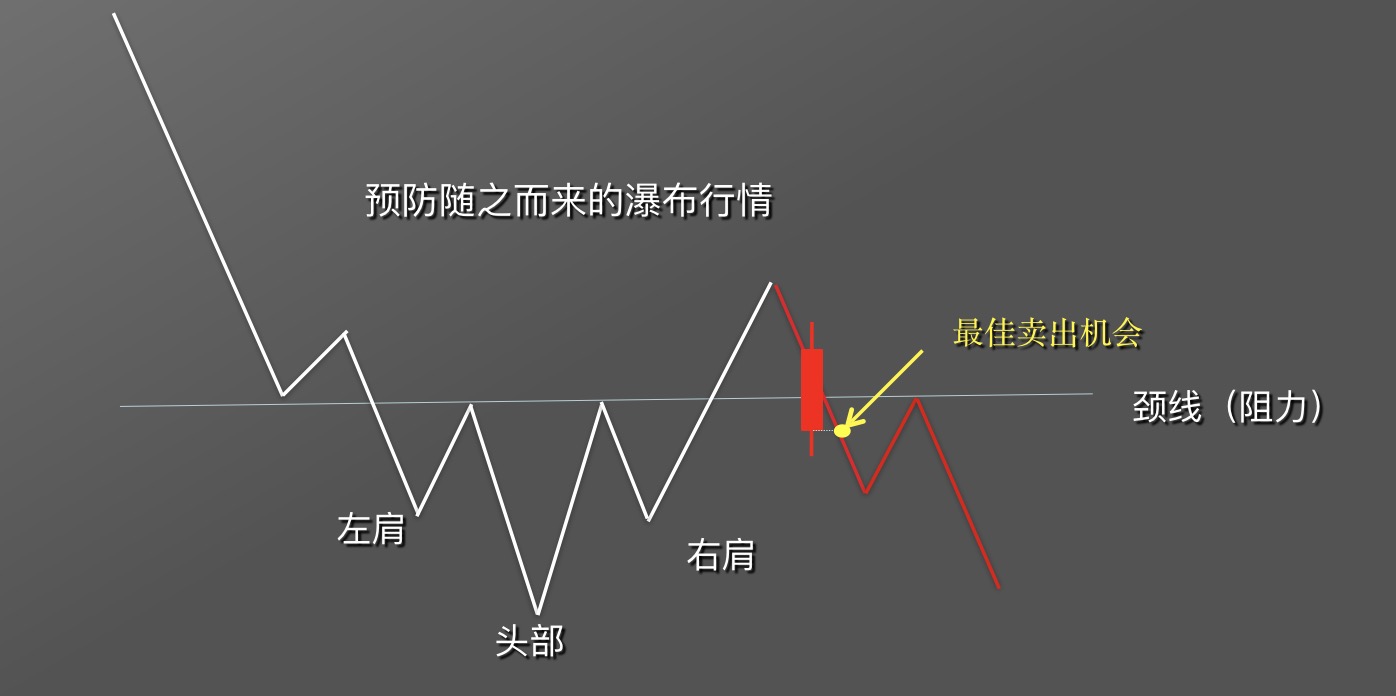
Once price pulls back to neckline support and forms the declining candlestick shown, with the body breaking through the neckline, it's a sign the storm is coming. When support is broken, it's the best selling opportunity. Otherwise, the coming storm will leave you thoroughly chilled.
Excellent investors not only sell positions when making profit to maximize gains within knowable ranges; they also sell positions when losing money to minimize losses to controllable levels.
Disclaimer
This article may contain product-related content not applicable to your region. This article is intended only to provide general information and assumes no responsibility for any factual errors or omissions herein. This article represents only the author's personal views and does not represent OKX's views. This article is not intended to provide any recommendations, including but not limited to: (i) investment advice or investment recommendations; (ii) offers or solicitations to buy, sell, or hold digital assets; or (iii) financial, accounting, legal, or tax advice. Holding digital assets (including stablecoins) involves high risk, may fluctuate significantly, and even become worthless. You should carefully consider whether trading or holding digital assets suits your financial situation. For questions about your specific situation, please consult your legal/tax/investment professional. Information appearing in this article (including market data and statistics, if any) is for general reference only. While we have taken all reasonable care in preparing these data and charts, we assume no responsibility for any factual errors or omissions expressed herein. © 2025 OKX. This article may be reproduced or distributed in full, or excerpts of 100 words or less from this article may be used, provided such use is non-commercial. Any reproduction or distribution of the entire article must also prominently state: "Copyright © 2025 OKX. Used with permission." Permitted excerpts must cite the article title and include attribution, such as "Article Title, [Author Name (if applicable)], © 2025 OKX". Some content may be generated or assisted by artificial intelligence (AI) tools. Derivative works or other uses of this article are not permitted.
Show More
Recommended Reading

Profit Even When Bitcoin Falls? How to Trade Contracts
As the cryptocurrency market represented by Bitcoin continues to expand, diverse derivative trading forms have gradually emerged beyond spot trading as hedging tools. The most attention-grabbing is contract trading. What is contract trading? Contracts are the most common trading form in the cryptocurrency derivatives market. Digital asset contract trading refers to buyers and sellers agreeing to trade certain assets at a specified price at a future time.
January 16, 2026

Simpler Than Copy Strategies? One-Click Copy Top Traders on OKX, Let Traders Earn for You
Whether in traditional finance or the cryptocurrency market, strategy trading is a very important and critical method in the trading system. When facing complex trading environments and extreme market conditions, even with solid theoretical knowledge and rich trading experience, it's easy to miss trading opportunities or make wrong judgments and operations due to emotional influence. Strategy trading is precisely an effective tool to solve these problems. With trading tools available, how to use
November 21, 2025

Five, Strategy Trading Series—Savings
Preface: We often have this speculation: in bull markets there are many digital assets with big gains. If you could continuously capture coins with large increases, for example catching one doubling digital asset per month, after one year your assets would become 2 to the 12th power, i.e., 4096 times. This is very amazing, of course, and also almost impossible to complete, because we rarely can continuously catch big-gaining coins. This is also a problem many users encounter: in bull markets, although
November 3, 2025

Which Countries/Regions Do Not Support Registration to Use OKX
OKX currently does not provide services to customers in the following regions: certain US territories, such as New York, Texas, Puerto Rico, American Samoa, Guam, Commonwealth of the Northern Mariana Islands, US Virgin Islands (St. Croix, St. John, and St. Thomas), Cuba, Iran, North Korea, Crimea, Malaysia, Syria, Bangladesh, and Bolivia. For details, please refer to the OKX Terms of Service.
April 25, 2024

Quickly Understand OKX Common Products and Features
OKX (www.okx.com) is one of the world's famous digital asset service platforms, mainly providing global users with Bitcoin, Ethereum, and other digital asset spot and derivative trading services, while also exploring the world of DeFi, dApps, NFTs, and GameFi with users. On OKX, you can enjoy smooth trading experiences such as spot and contract trading, keep up with token information in hot areas/concepts, and also
April 25, 2024

Learn K-Line Patterns from Scratch | 5 Importance of Candlestick Combinations
Price movements have trends; understand the language of prices; buy and sell signals exist; say goodbye to emotional trading. 1. Bullish Candlestick Combinations at Key Positions In the first two sections of this chapter, we explained applications of bullish and bearish candlestick combinations, but these combinations are not effective in all positions. In this section, we'll explain the importance of where combinations appear. Where can bullish combinations work better? The first situation: in an obvious uptrend, near the previous
April 25, 2024


