
Learn K-Line Patterns from Scratch | 12 Top-Exit Patterns — Head and Shoulders Top
Prices move in trends; understand the language of price;
Trading has signals; say goodbye to emotional trading.
I. The Head and Shoulders Top Pattern
Investment means buying and selling — you need to know not only when to buy, but also when to sell. Buying without selling means profits don't make it into your pocket.
In this lesson, let's learn about top-exit pattern #1: Head and Shoulders Top.
What does the Head and Shoulders Top pattern look like? As someone who keeps learning, you might have already guessed its appearance just from hearing its name.
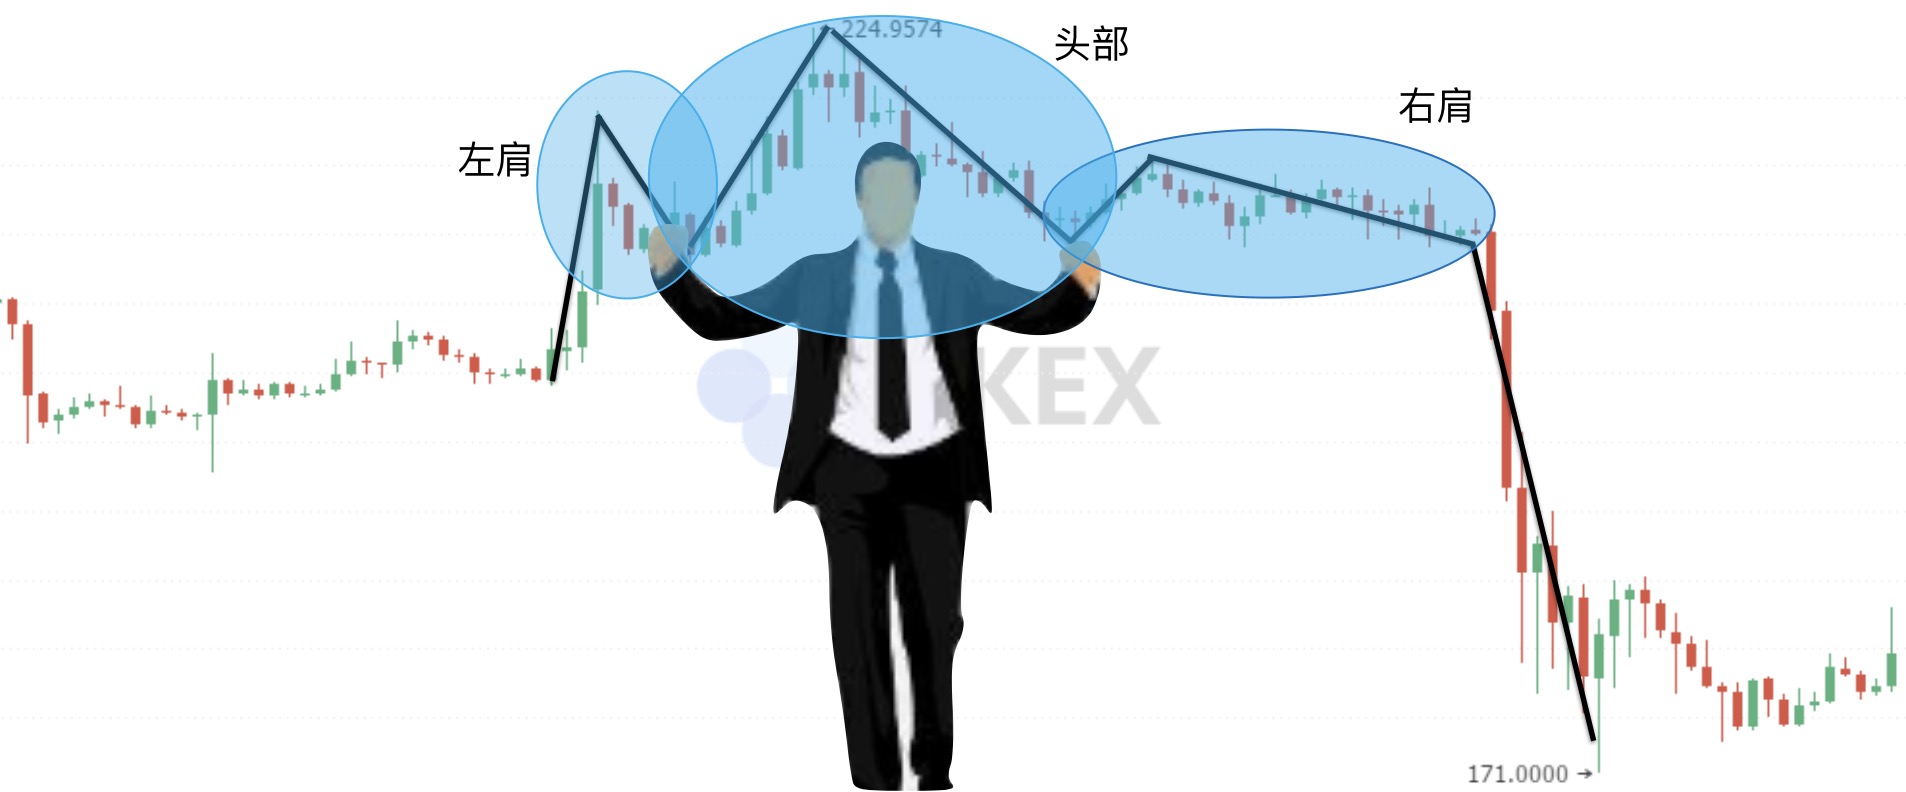
As shown in the figure, using technical analysis methods on the Ethereum/USDT price chart, we simplify the complex candlestick structure to get the drawn structure in the diagram. Because its structure resembles a standing person, it's called the Head and Shoulders Top pattern.
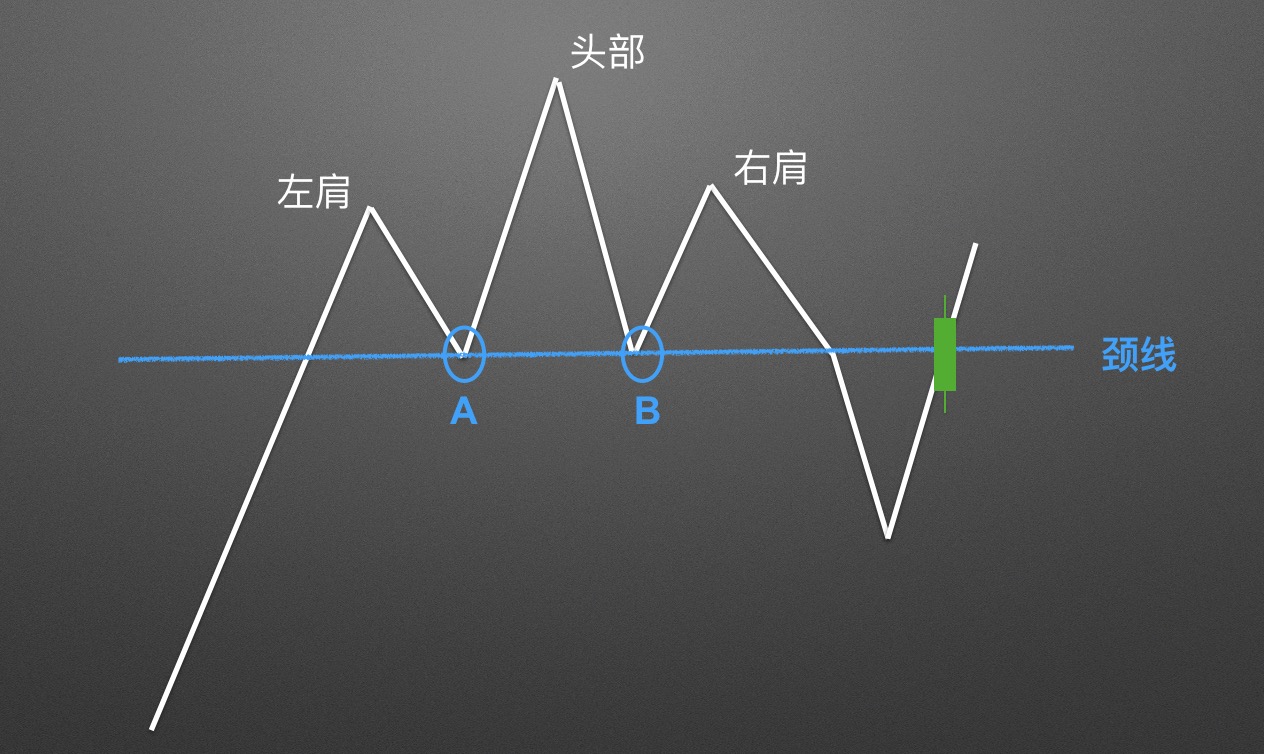
Let's extract the simplified diagram of the Head and Shoulders Top pattern to make its structure appear cleaner and clearer. And we'll draw an important bull-bear dividing reference line — the neckline. How do you draw the neckline?
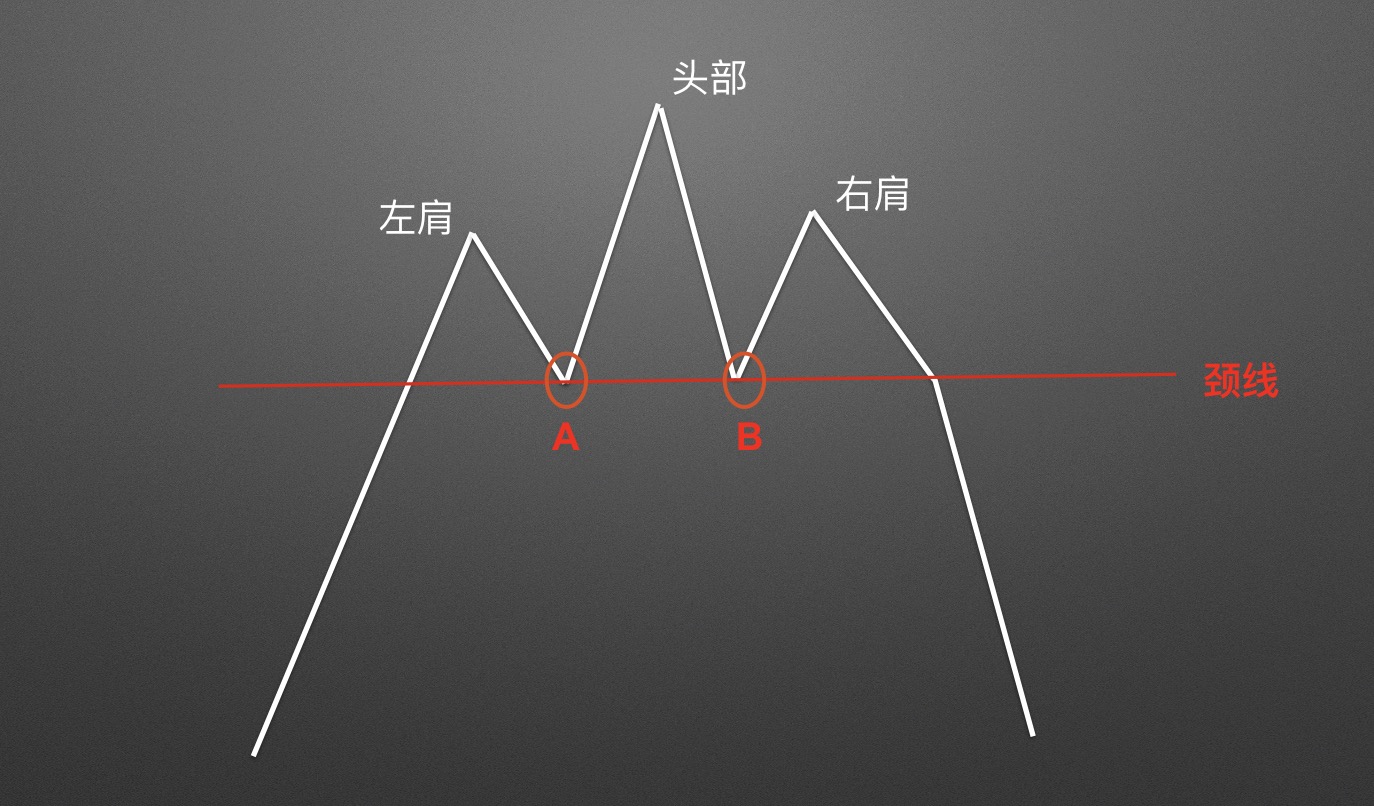
First, find the lowest point A between the left shoulder and the head, then find the lowest point B between the right shoulder and the head. Two points determine a straight line, giving us the neckline.
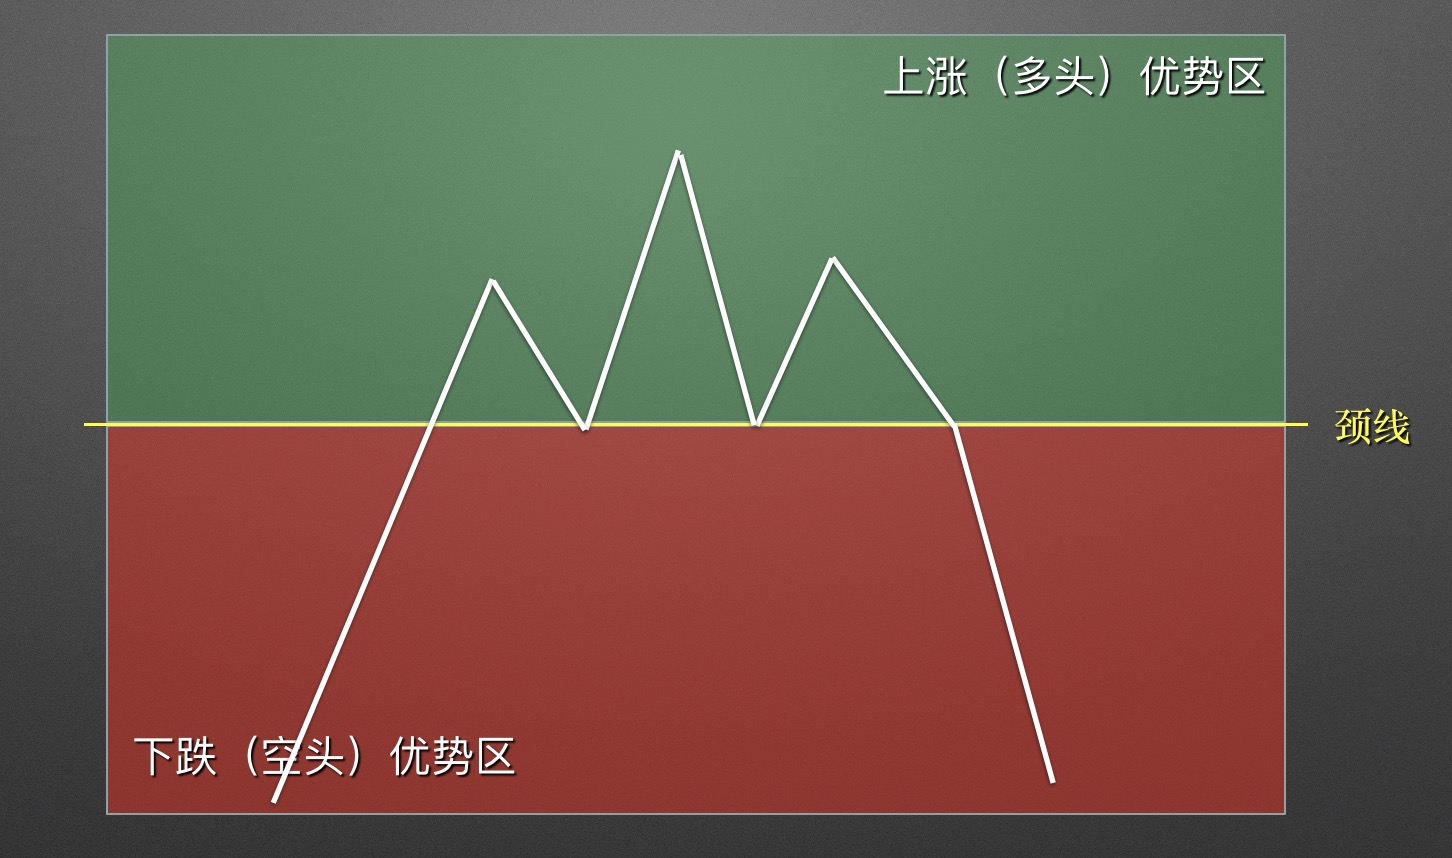
Above the neckline is the bullish advantage zone, where going long is appropriate and shorting is not. Below the neckline is the bearish advantage zone, where shorting is appropriate and going long is not.
II. Application Rules for Head and Shoulders Top
How can you predict the future and find good selling opportunities before a major drop?
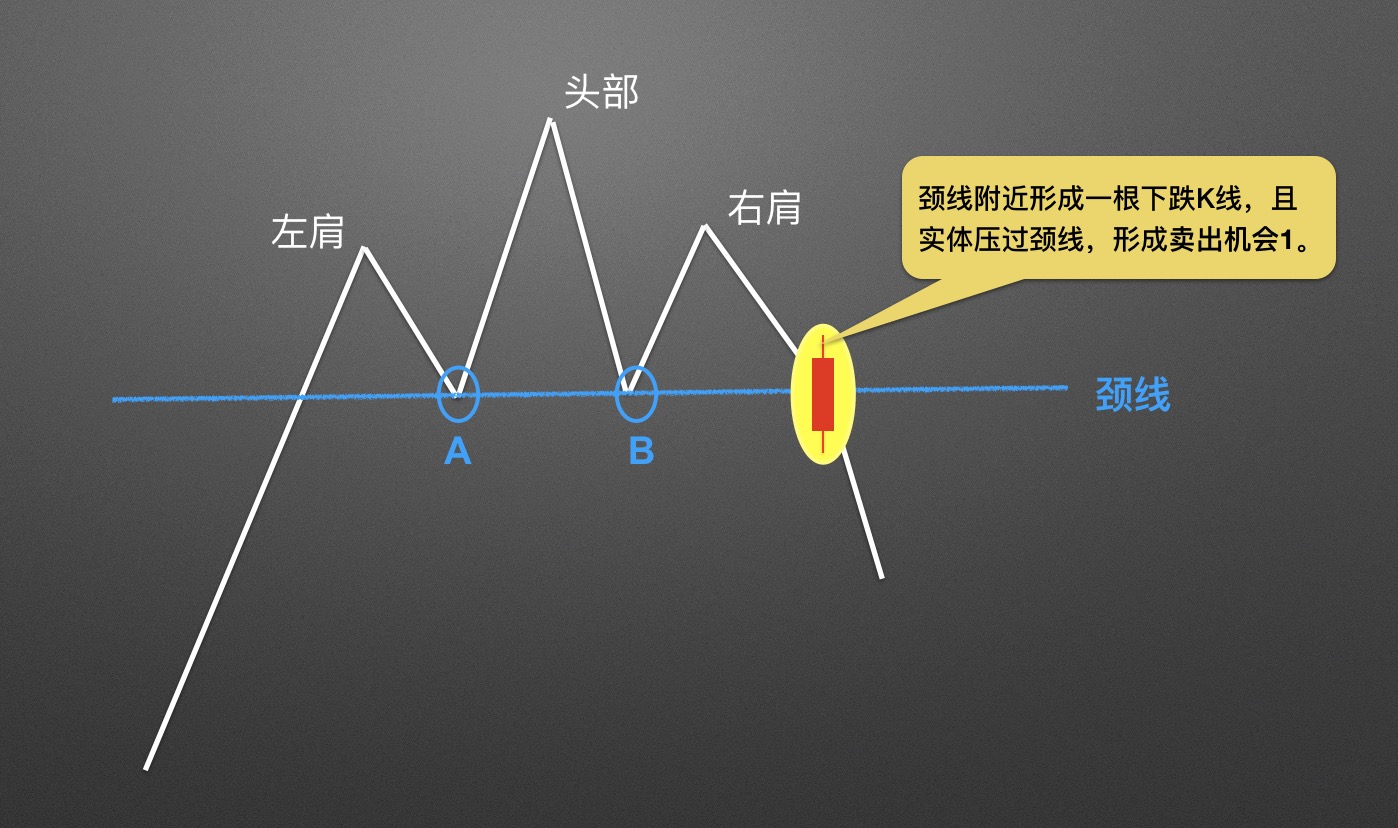
When a Head and Shoulders Top pattern forms within a certain candlestick period, and the candlestick that breaks through the neckline is as shown in the figure — a red bearish candlestick whose body passes through the neckline — this is a clear bearish signal. This position forms the first selling opportunity. Once this phenomenon appears, the market is highly likely to fall in the future.
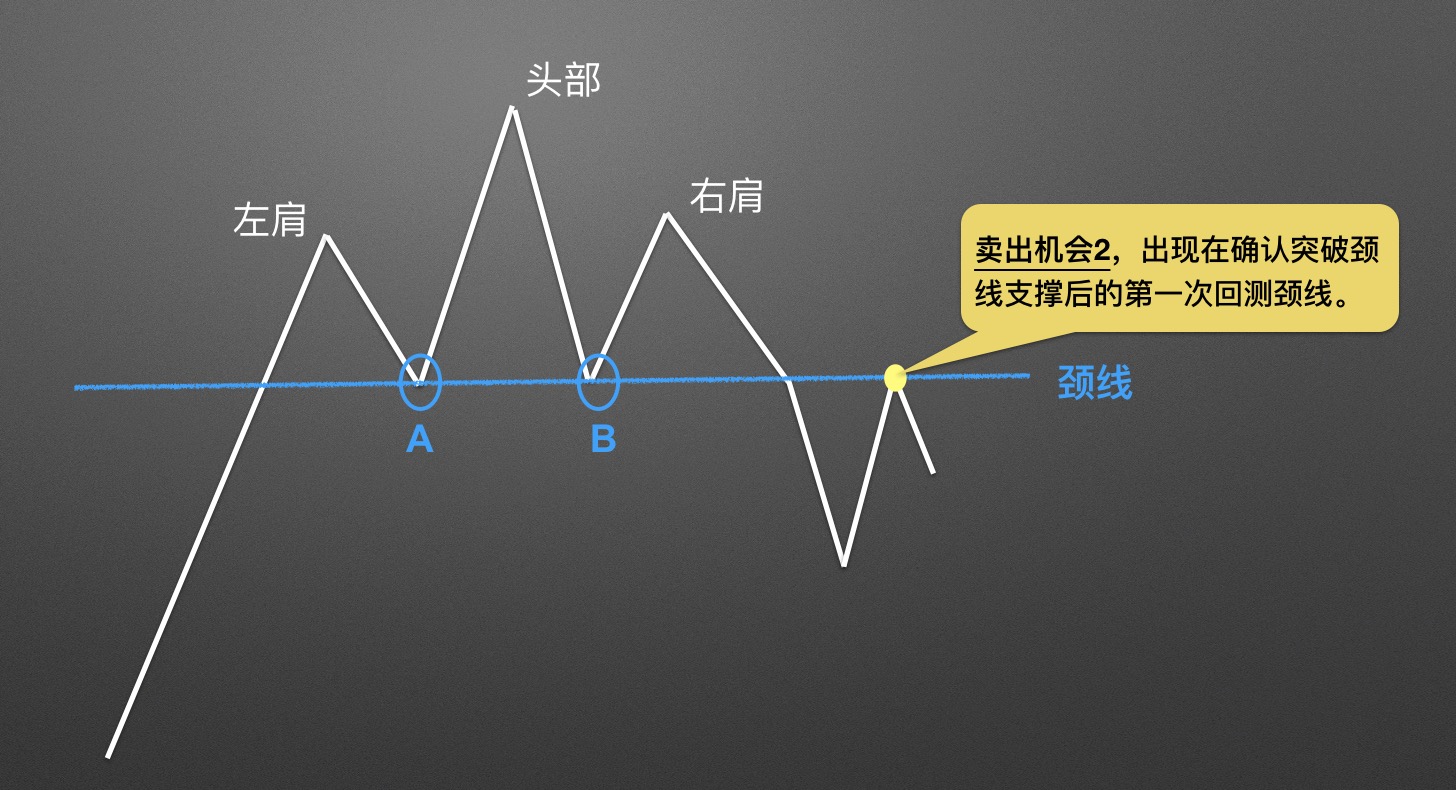
After the price breaks below the neckline, it may form a small upward uptrend, pulling back to near the neckline before turning downward again. This constitutes selling opportunity #2. It's best to use this in combination with the content from lessons four and five for higher accuracy.
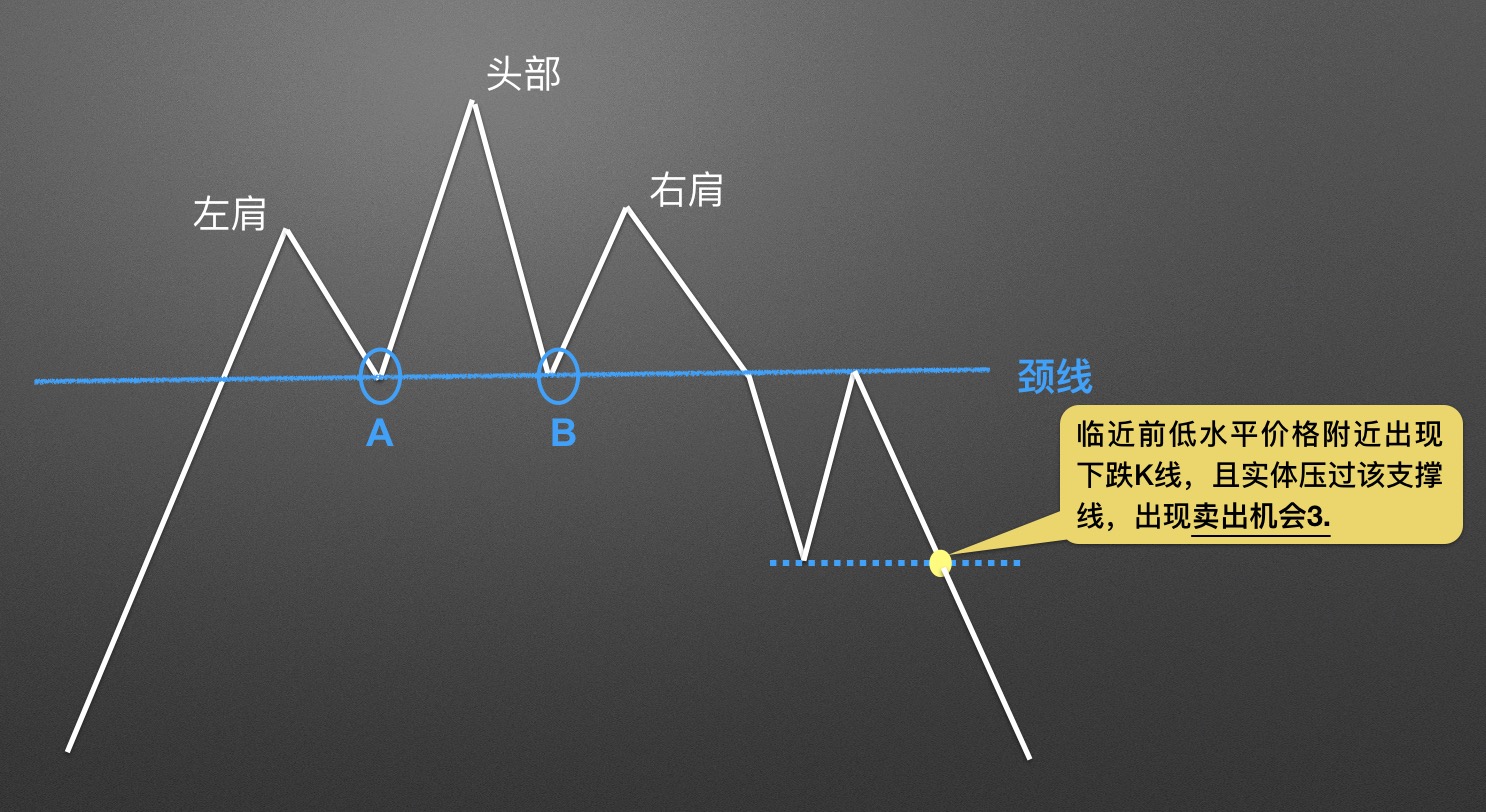
Selling opportunity #3 appears when the price retests the neckline and then breaks below the nearby price low again.
Let's summarize the application rules for the Head and Shoulders Top pattern.
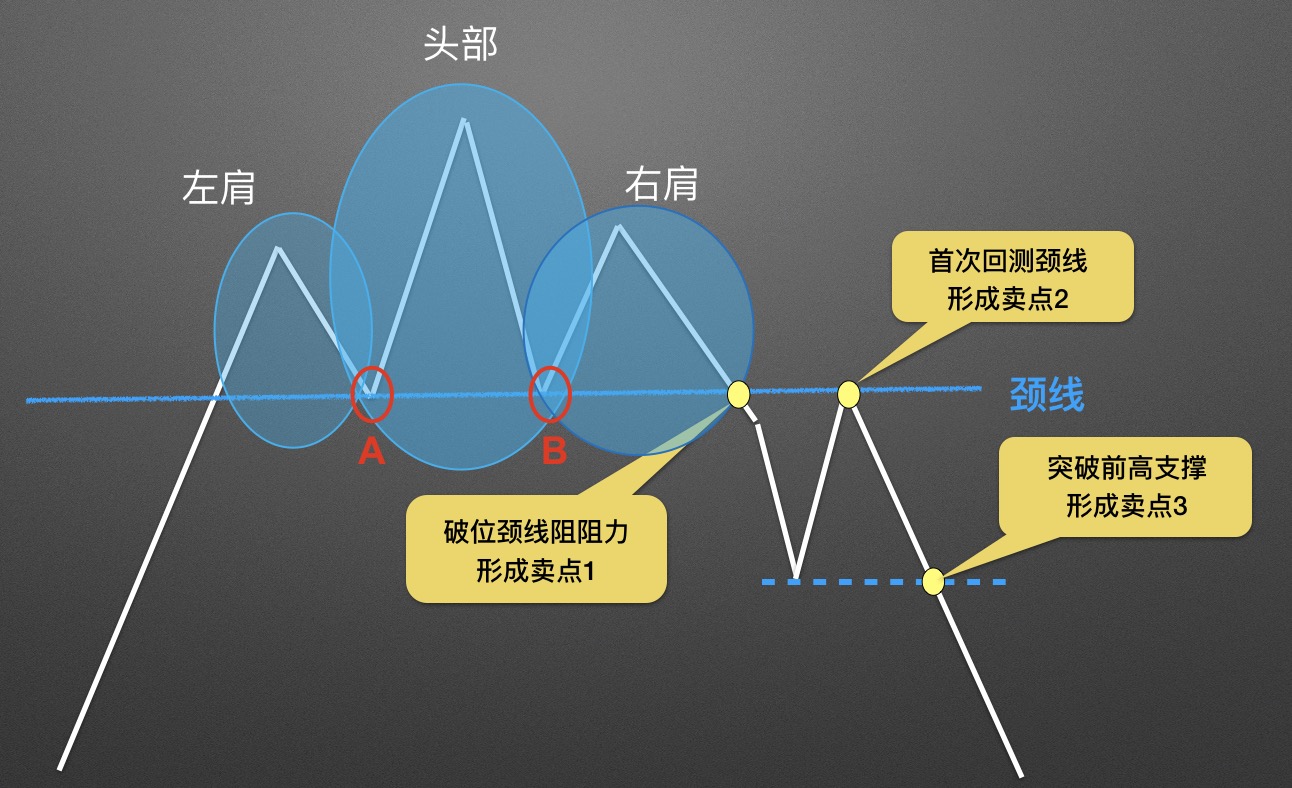
First, you need to confirm the three important components of the Head and Shoulders Top pattern: the left shoulder, the head, and the right shoulder, and draw the important bull-bear reference line — the neckline. As the market continues to change, we find the neckline breakout — selling opportunity #1, the neckline pullback — selling opportunity #2, and the break below the nearby previous low — selling opportunity #3.
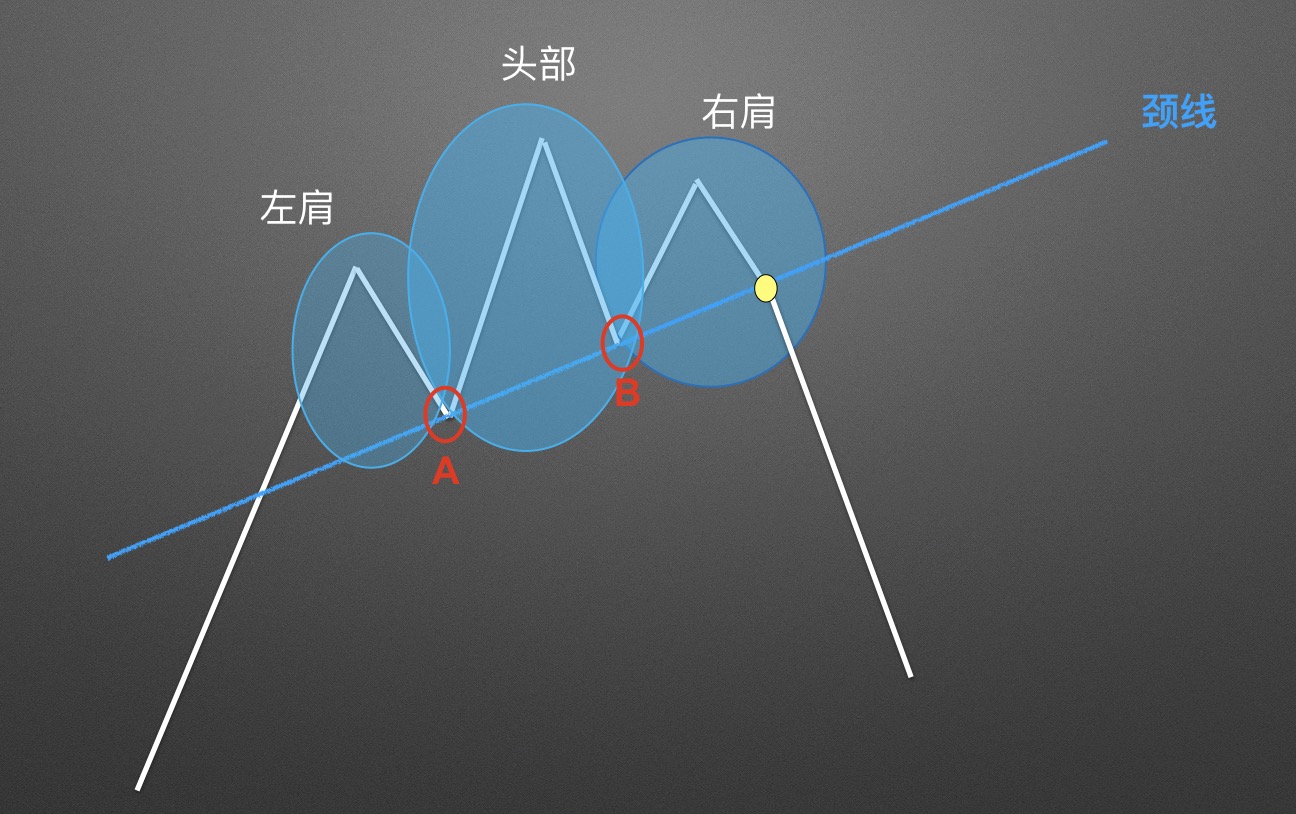
Not every Head and Shoulders Top pattern appears as textbook-perfect. It might be a strong straight-line decline like this, giving only one selling opportunity, or it might be a sloped shoulder like this.
Can the Head and Shoulders Top pattern also predict future downward space?
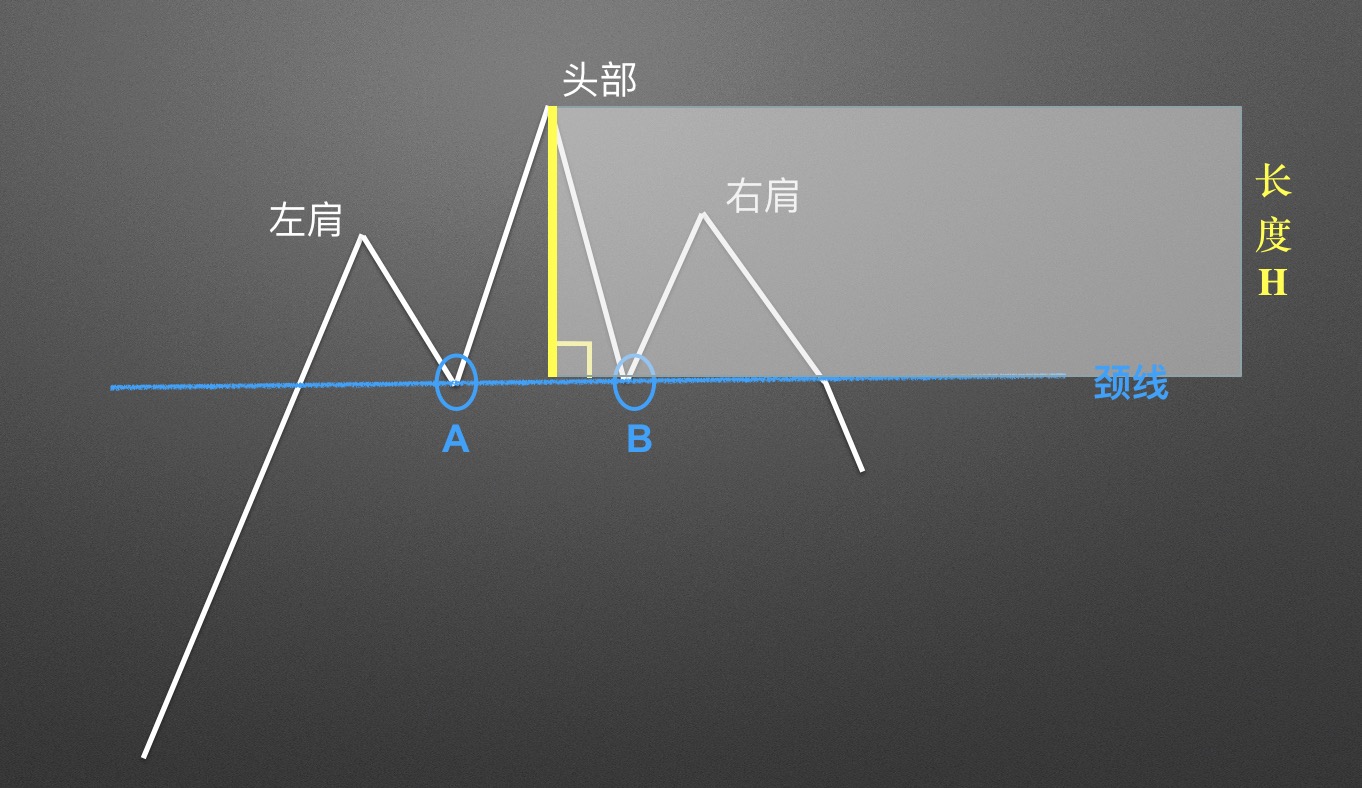
First, we draw a perpendicular line segment from the top of the head to the neckline, determining the length of the perpendicular segment as H.
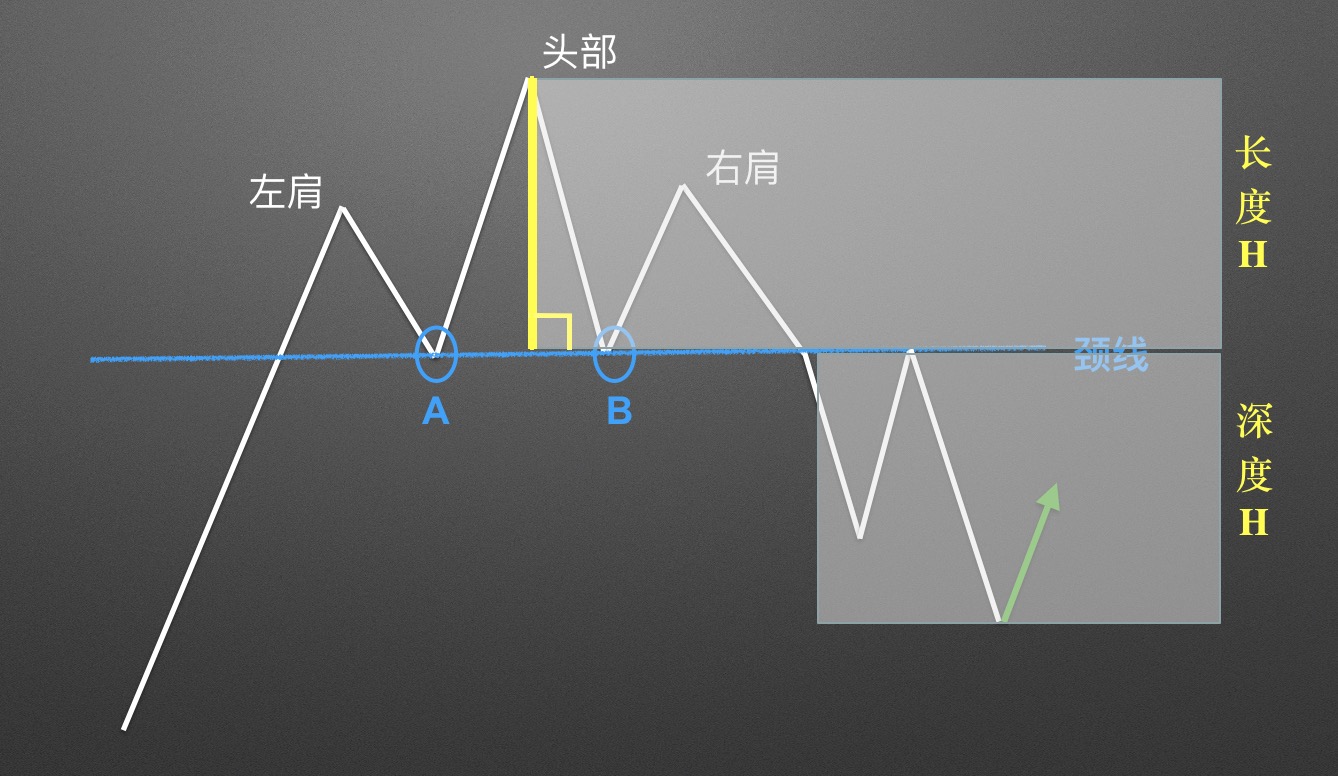
We move this perpendicular segment as shown below the neckline, and the future price will likely fall to depth H. Of course, if the downtrend is strong, the decline will last longer and go deeper. The excess portion is beyond predictable range.
Below, let's review several real cases.
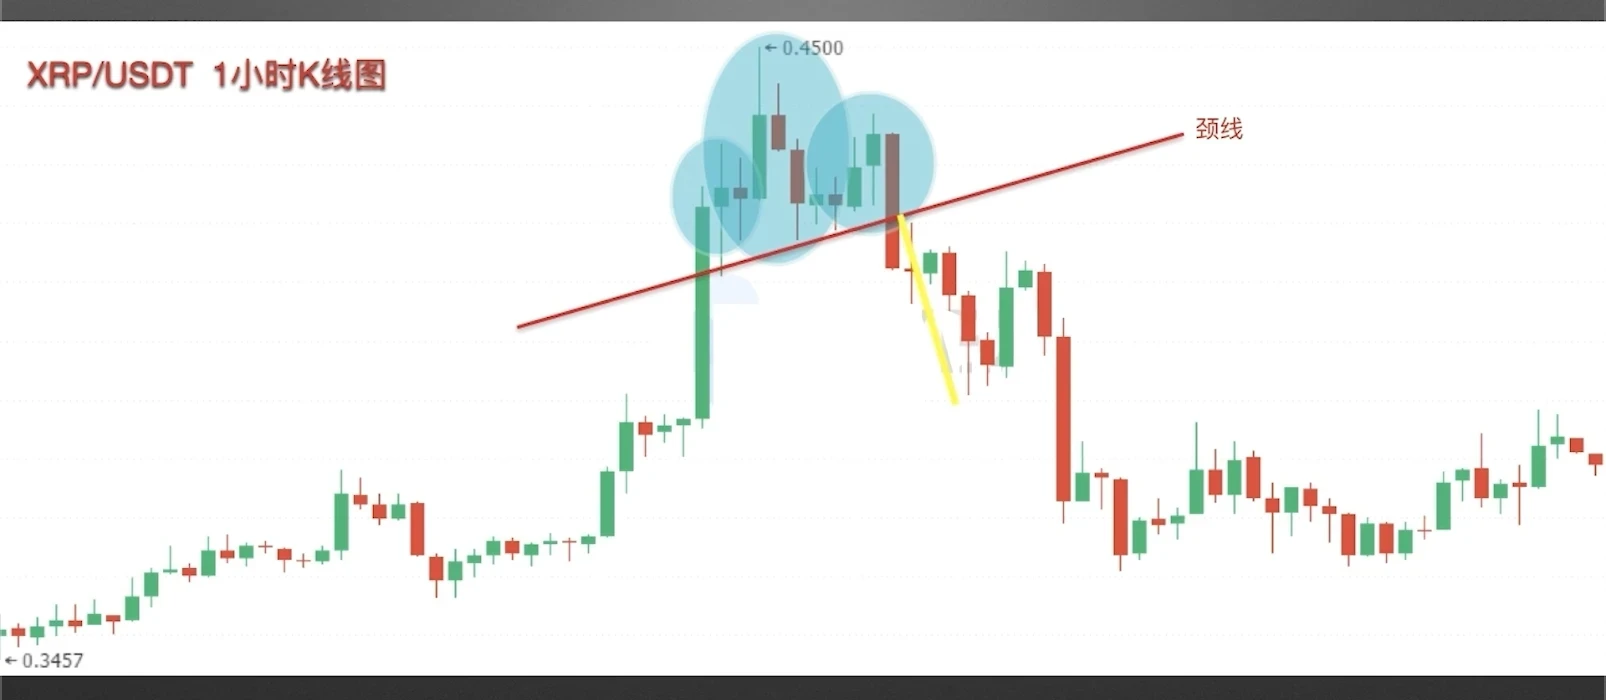
Screenshot from the OKX spot trading XRP/USDT 1-hour candlestick chart. The Head and Shoulders Top pattern formed this time is relatively regular. Although the price broke below the neckline quickly, it still provided three selling opportunities.
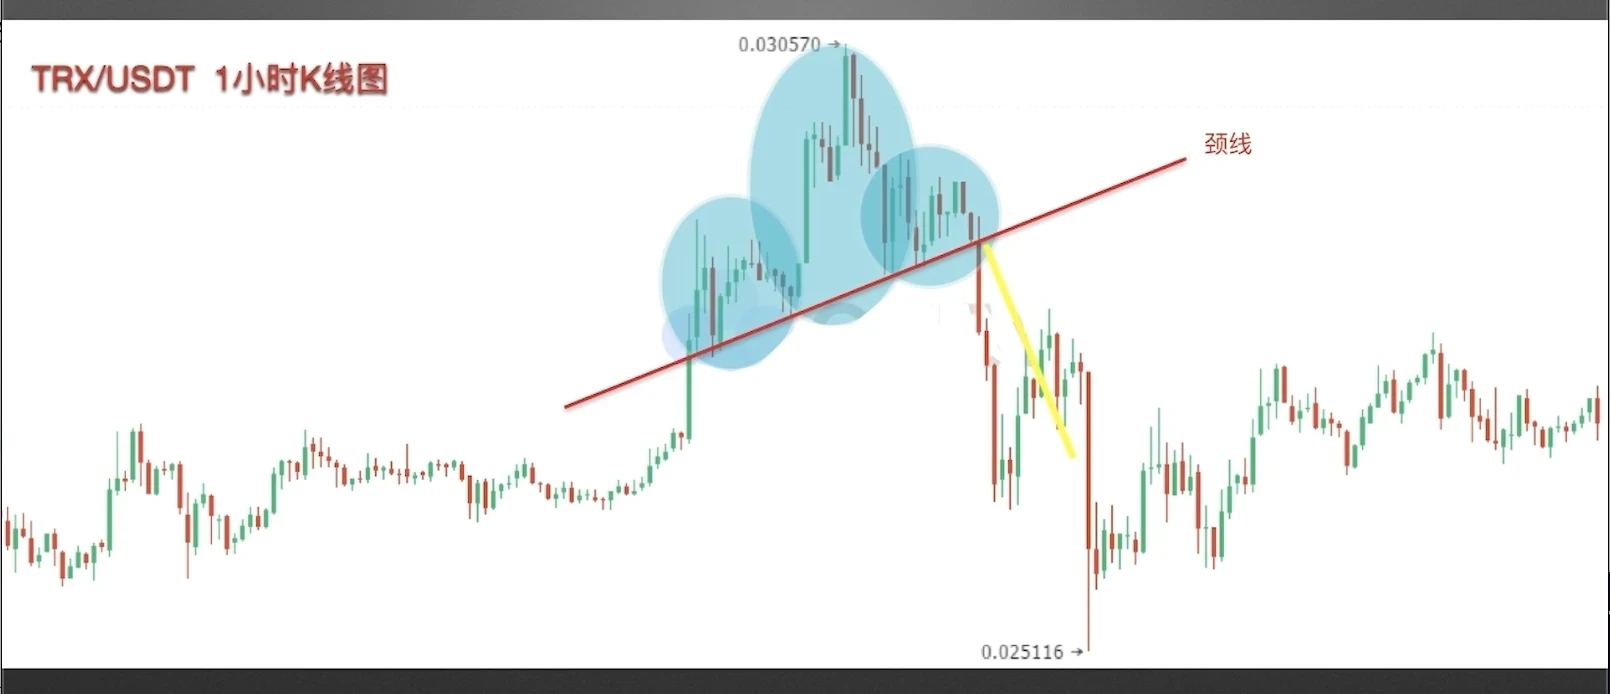
The second case screenshot is from the OKX spot trading TRX/USDT 1-hour candlestick chart. The Head and Shoulders Top pattern formed this time is also tilted. The bearish trend showed strength, giving only one selling opportunity.
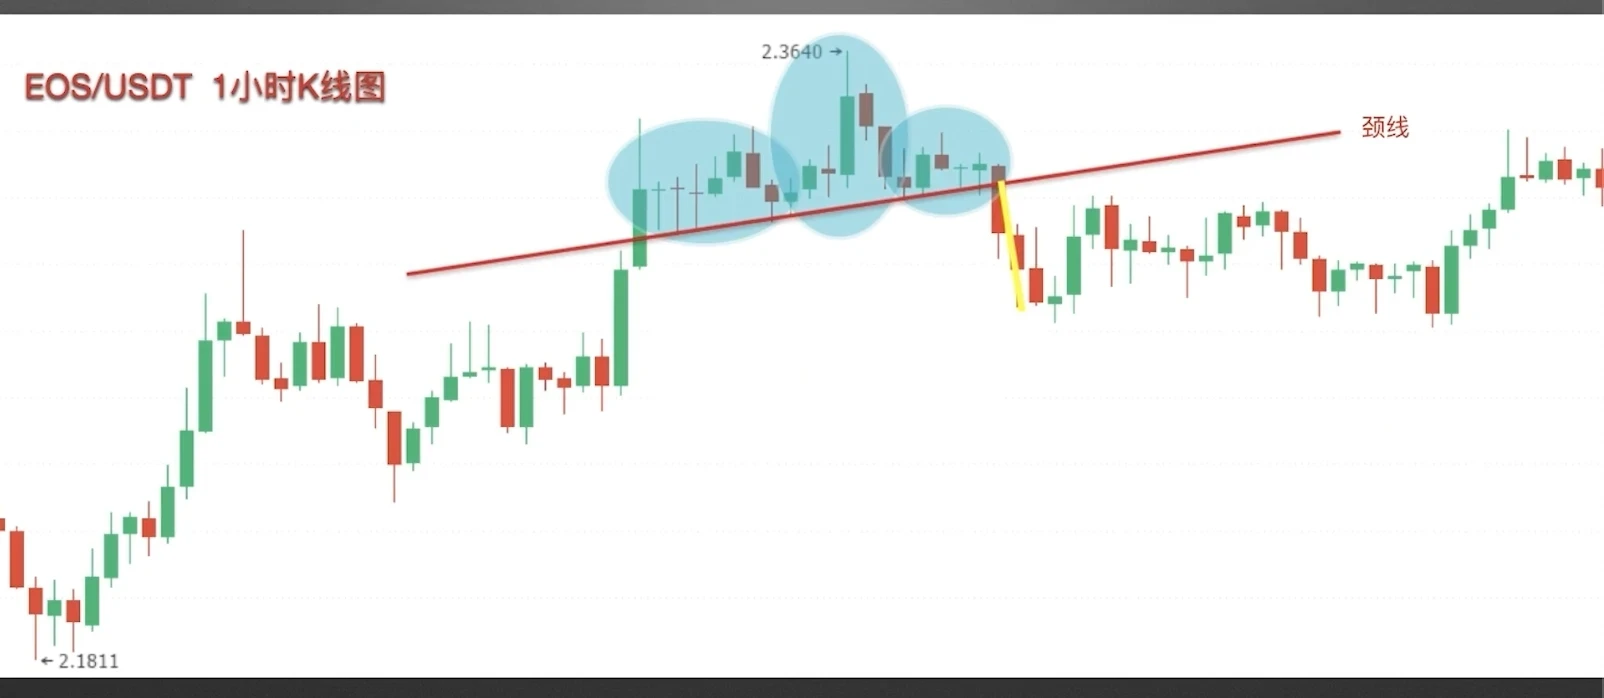
Case 3 screenshot is from the OKX spot trading EOS/USDT 1-hour candlestick chart. This Head and Shoulders Top structure is relatively small, and the decline is also relatively small, just reaching the predicted depth.
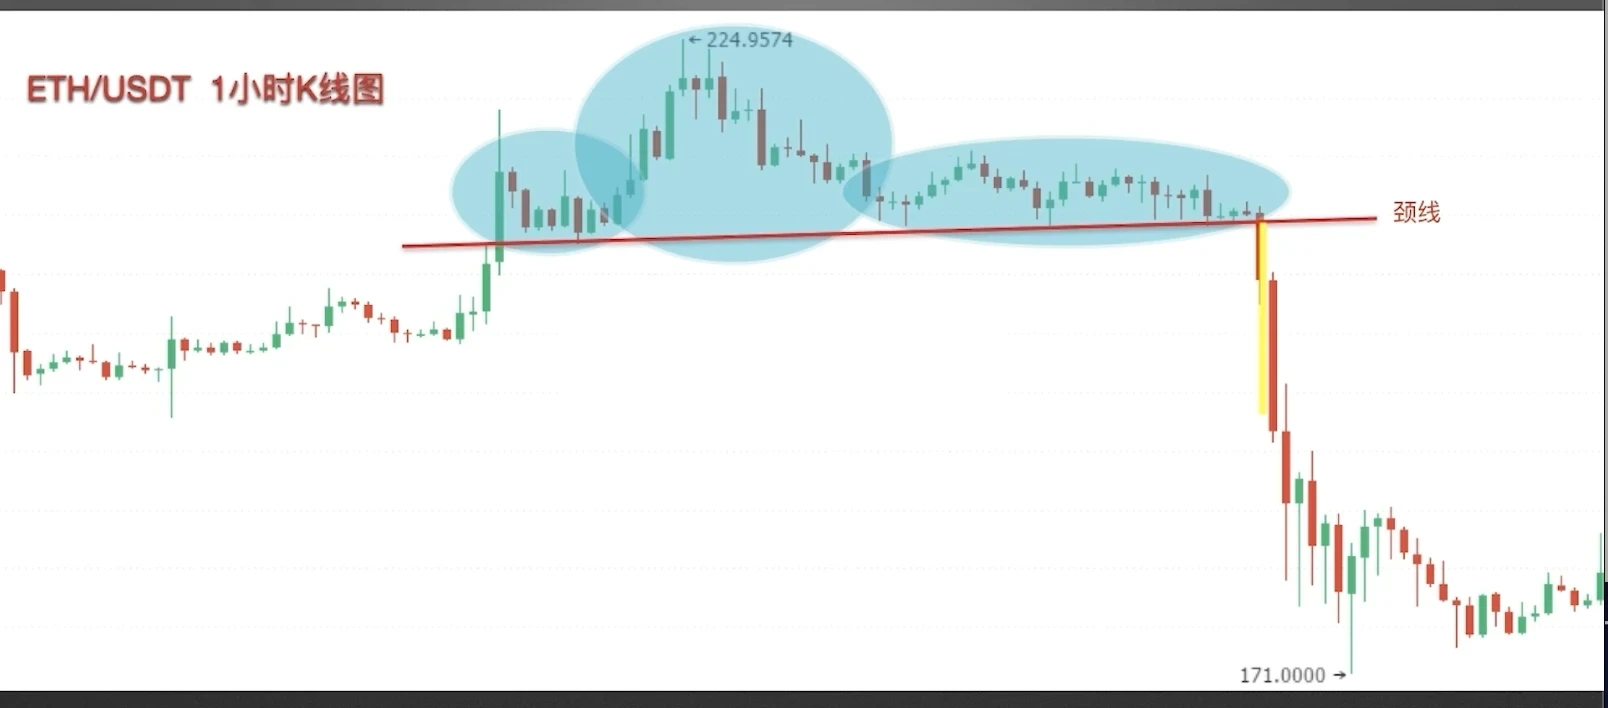
The final case screenshot is from the OKX spot trading Ethereum/USDT 1-hour candlestick chart. The market took a long time to construct the Head and Shoulders Top pattern. After breaking the neckline, the price fell rapidly, giving one selling opportunity.
The market is ever-changing, and we should always guard against uncertainty risks. Even after a Head and Shoulders Top has formed, there's a small probability it could be invalidated.
After a Head and Shoulders Top forms, once the price retests the neckline support and forms the upward candlestick shown in the diagram, with the bullish candlestick body breaking through the neckline, this indicates a Head and Shoulders Top deformation — a failed signal.
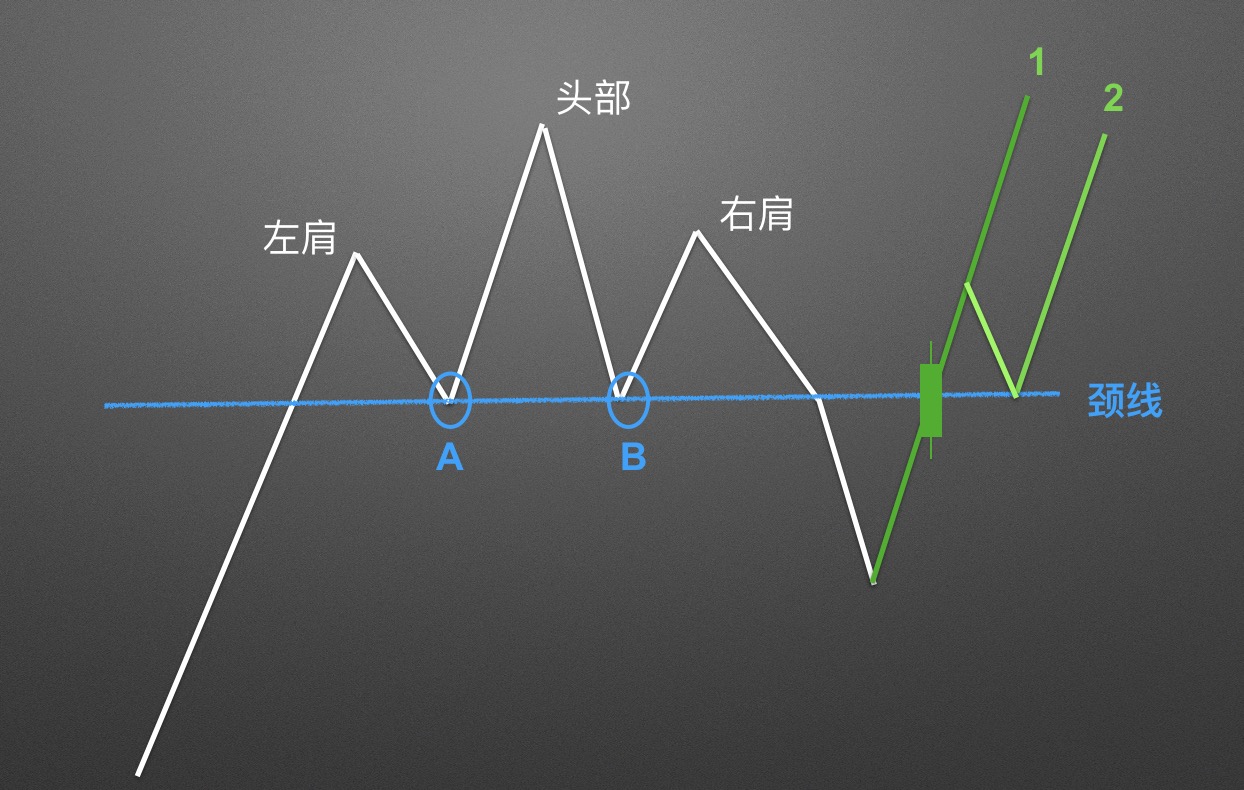
The future market will likely form the upward trends shown as 1 and 2 in the diagram.
Disclaimer
This article may contain content related to products that are not available in your region. This article is intended only to provide general information and does not take responsibility for any factual errors or omissions contained therein. This article represents only the author's personal views and does not represent the views of OKX. This article is not intended to provide any of the following recommendations, including but not limited to: (i) investment advice or investment recommendations; (ii) offers or solicitations to buy, sell, or hold digital assets; or (iii) financial, accounting, legal, or tax advice. Holding digital assets (including stablecoins) involves high risk, may fluctuate significantly, and may even become worthless. You should carefully consider whether trading or holding digital assets is suitable for you based on your financial situation. For questions about your specific situation, please consult your legal/tax/investment professional. The information appearing in this article (including market data and statistics, if any) is for general reference only. Although we have taken all reasonable precautions in preparing these data and charts, we accept no responsibility for any factual errors or omissions expressed herein. © 2025 OKX. This article may be reproduced or distributed in its entirety, or excerpts of 100 words or less from this article may be used, provided such use is non-commercial. Any reproduction or distribution of the entire article must also prominently state: "This article is copyrighted © 2025 OKX, used with permission." Permitted excerpts must cite the article title and include attribution, such as "Article Name, [Author Name (if applicable)], © 2025 OKX". Some content may be generated or assisted by artificial intelligence (AI) tools. Derivative works or other uses of this article are not permitted.
Show More
Recommended Reading

Profit Even When Bitcoin Falls? How to Trade Futures
As the cryptocurrency market scale represented by Bitcoin continues to expand, diverse forms of derivatives trading have gradually emerged beyond spot trading as a tool to hedge risk, with futures trading receiving the most attention. What is futures trading? Futures are the most common trading contract form in the cryptocurrency derivatives market. Digital asset futures trading refers to buyers and sellers agreeing to trade a specific asset at a specified price at a future time.
January 16, 2026

Simpler Than Copy Trading Strategies? One-Click Follow Top Strategy Traders on OKX, Let Traders Earn Money for You
Whether in traditional finance or the cryptocurrency market, strategy trading is a very important and critical method in the trading system. When facing complex trading environments and extreme trading conditions, even with solid theoretical technical knowledge and rich trading experience, it's easy to miss trading opportunities or make wrong judgments and operations due to emotional influence. Strategy trading is precisely an effective tool that can solve these problems. Now that you have the trading tools, how do you use them
November 21, 2025

V. Strategy Trading Series Course — Savings
Preface: We often have this hypothesis: In bull markets, there are many digital assets with significant gains. If we could continuously capture assets with large increases, for example catching a doubled digital asset every month, your assets would become 2 to the power of 12, or 4096 times, after one year. This is very impressive, but of course it's also almost impossible to achieve, because it's difficult for us to continuously catch surging assets. This is also a problem many users encounter: In bull markets, although
November 3, 2025

Which Countries/Regions Do Not Support Registration to Use OKX
OKX currently does not provide services to customers in the following regions: Certain U.S. territories, such as New York, Texas, Puerto Rico, American Samoa, Guam, Commonwealth of the Northern Mariana Islands, U.S. Virgin Islands (St. Croix, St. John, and St. Thomas), Cuba, Iran, North Korea, Crimea, Malaysia, Syria, Bangladesh, and Bolivia. For details, please refer to the OKX Terms of Service.
April 25, 2024

Quickly Understand OKX Common Products and Features
OKX (www.okx.com) is one of the world's renowned digital asset service platforms, primarily providing global users with Bitcoin, Ethereum, and other digital asset spot and derivatives trading services, while also exploring the world of DeFi, dApps, NFTs, and GameFi with users. On OKX, you can enjoy smooth spot, futures, and other trading experiences, stay updated on hot sector/concept token information第一时间, and also
April 25, 2024

Learn K-Line Patterns from Scratch | 5 The Importance of Candlestick Combination Applications
Prices move in trends; understand the language of price. Trading has signals; say goodbye to emotional trading. I. Bullish Candlestick Combinations at Key Positions In the first two lessons of this chapter, we explained the applications of bullish and bearish candlestick combinations, but these combinations are not effective when appearing at any position. In this section, we'll explain the importance of where combinations appear. In which positions can bullish combinations better play their role? The first situation: In a clear upward trend, approaching the previous
April 25, 2024


