Zero-Basic Guide to K-Line Patterns | 22 Common Analysis Indicators Part 4 — MACD
Markets have trends, understand the language of price;
Buy and sell have signals, say goodbye to intuitive Trading.
I. King of Indicators — MACD
In this section, we introduce a very commonly used technical indicator — MACD, known in Chinese as "Moving Average Convergence Divergence" and honored as the "King of Indicators."
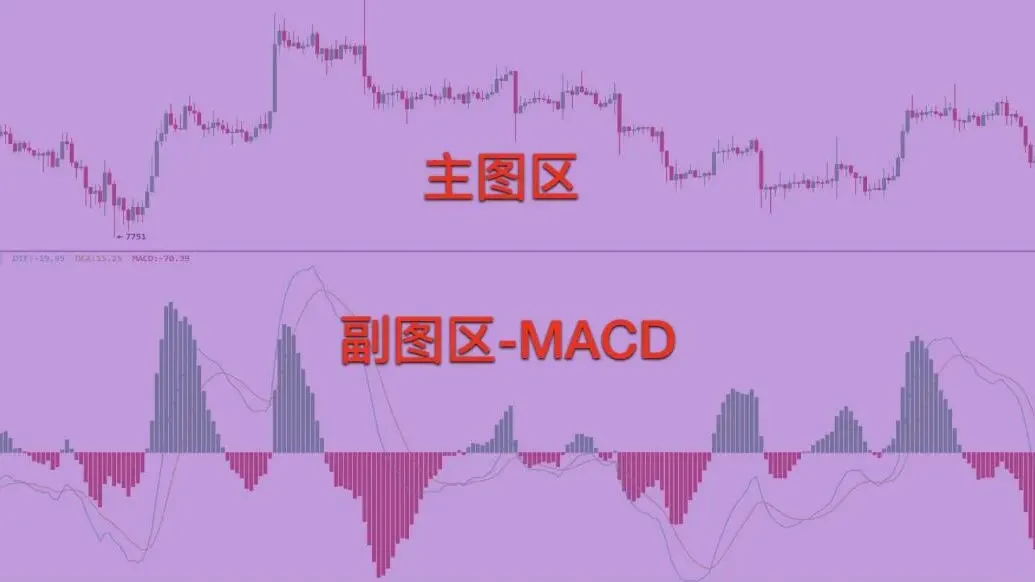
Let's recognize what the MACD indicator looks like through a trend chart. The upper area of the trend chart is the main chart area, displaying price movement trajectories. The MACD indicator is displayed in the sub-chart area. This indicator composed of dual curves and red-green histogram bars is MACD.
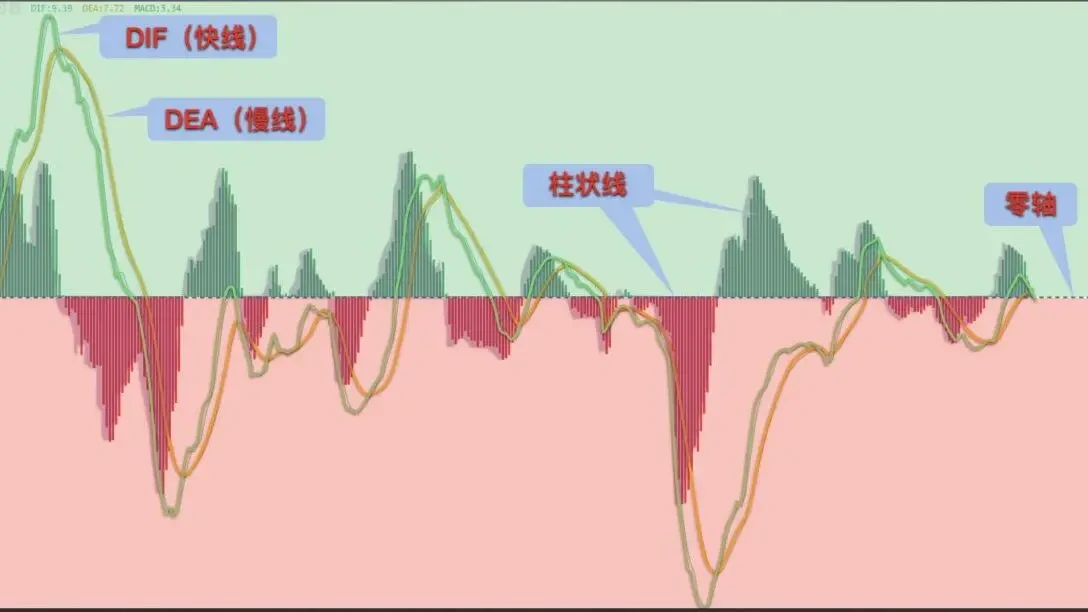
What components does the MACD indicator mainly consist of? One is the faster-moving DIF line, also called the fast line; the other is the slower-moving DEA line, also called the slow line. The fast line and slow line are usually referred to together as the MACD dual lines. The red and green bars that rise and fall like mountain peaks are called histogram bars. A horizontal line between the red and green histogram bars is called the zero line. The area above the zero line is considered the bullish control range, while the area below the zero line is considered the bearish control range.
II. Main Uses of the MACD Indicator
1) Golden Cross and Death Cross
First, let's introduce the MACD golden cross and death cross methods.
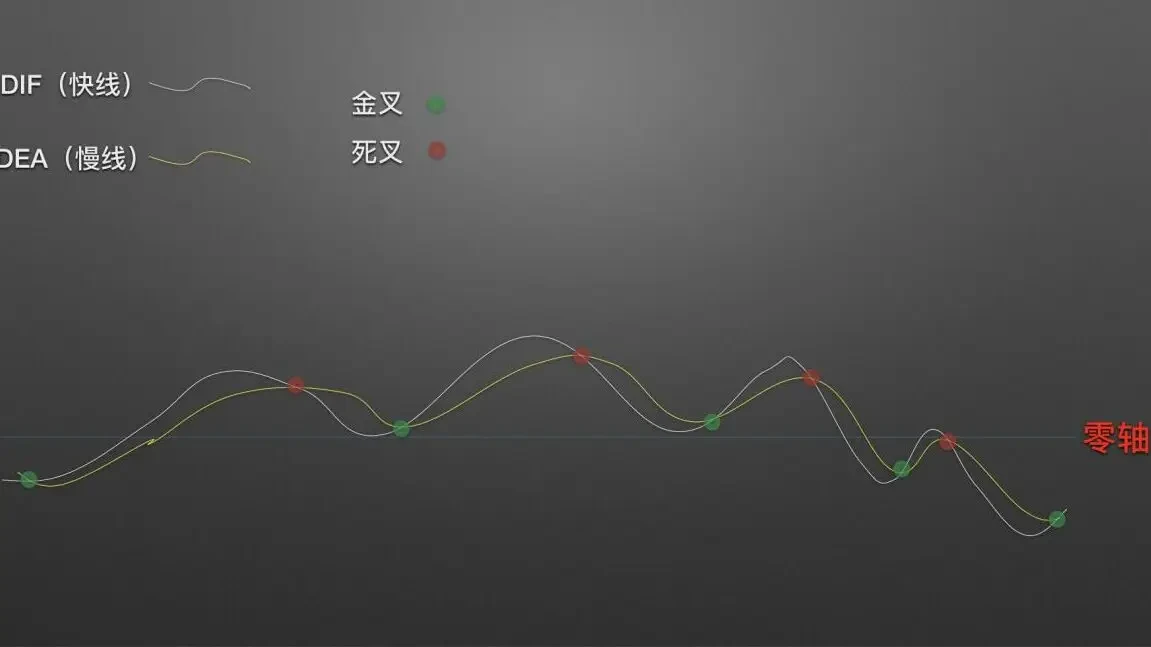
What do golden cross and death cross look like? When the fast line crosses the slow line from bottom to top, the resulting intersection is called a golden cross, which is a bullish signal. When the fast line crosses the slow line from top to bottom, the resulting intersection is called a death cross, which is a bearish signal.
Not all golden crosses are reliable bullish signals. Generally, golden crosses formed in the bullish control range above the zero line have more bullish significance, and the probability of success after buying is higher. Similarly, not all death crosses are reliable bearish signals. Generally, death crosses formed in the bearish control range below the zero line have more bearish significance, and the probability of success after opening a short position is higher. Death crosses formed above the zero line and golden crosses formed below the zero line have relatively lower reference significance and lower success probability.
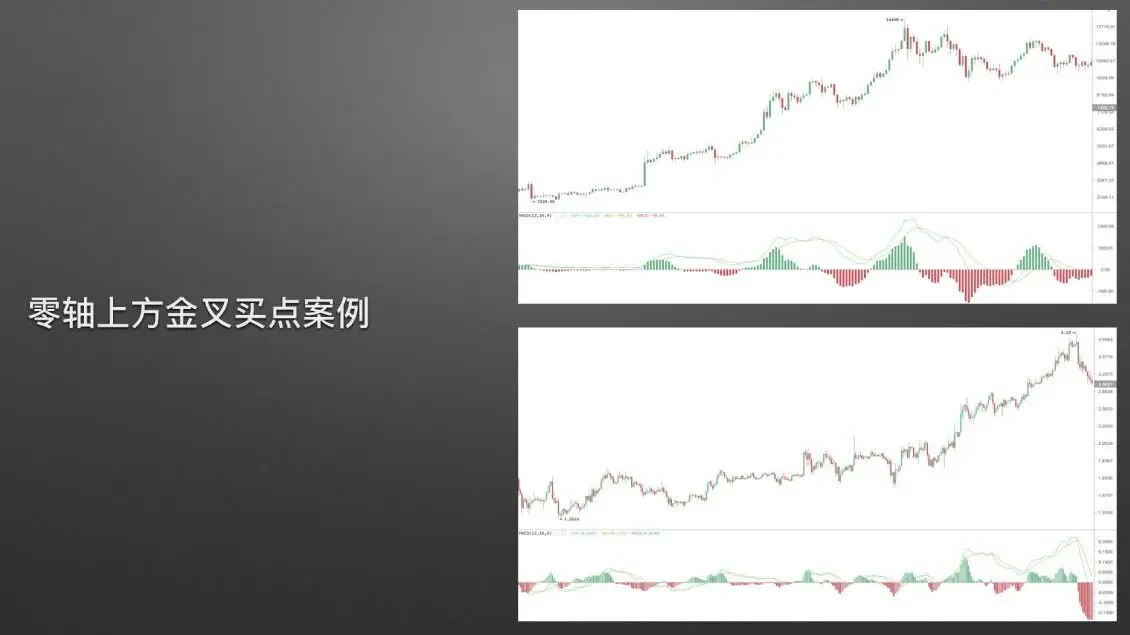
Through two sets of actual trend cases, let's further deepen our understanding of MACD golden cross and death cross applications. Let's look at the golden cross case first.
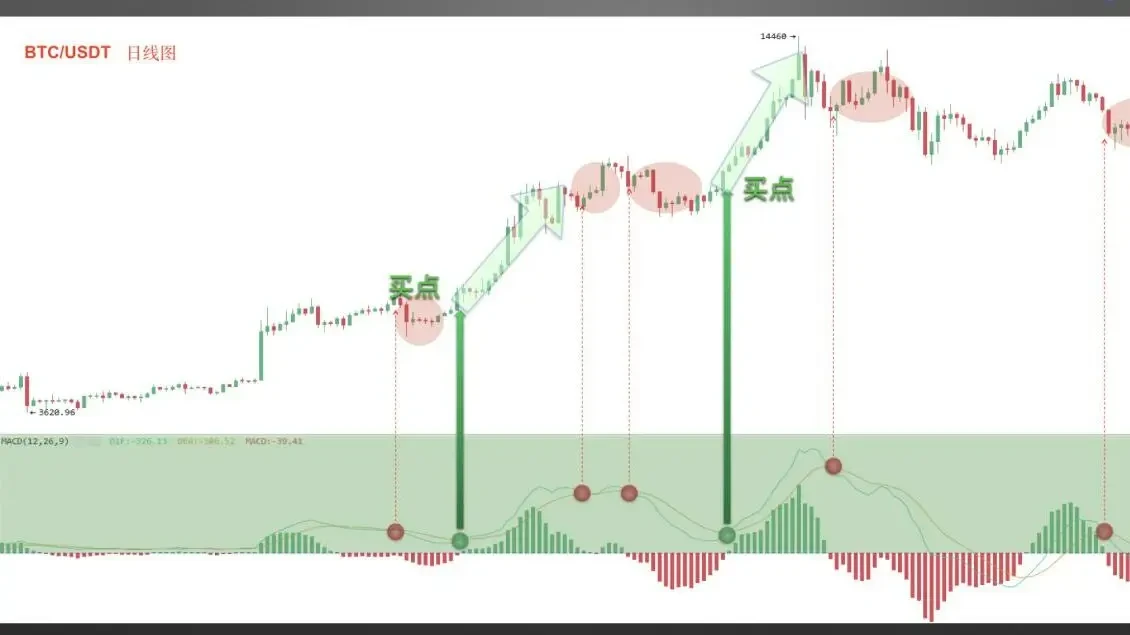
Case 1 screenshot is from the OKX spot trading area, BTC/USDT daily chart. The MACD dual lines formed two obvious golden crosses in the bullish control area above the zero line, followed by significant price increases. At the same time, many death crosses also appeared, but in the vast majority of cases, the price did not show significant corrections afterward.
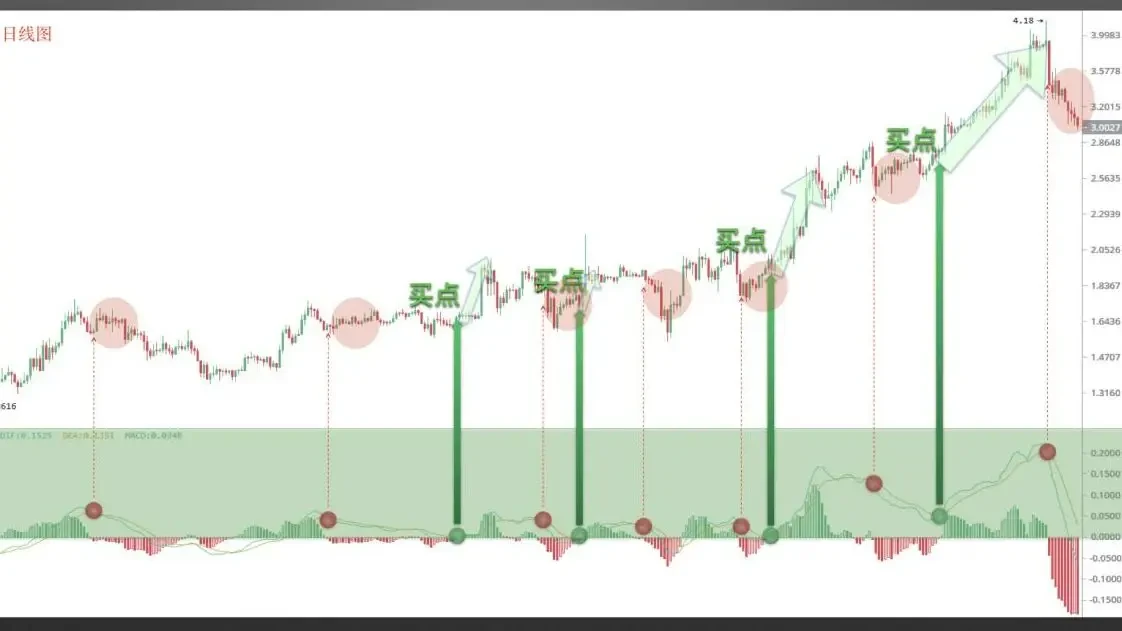
Case 2 screenshot is from OKX, OKB/USDT daily chart. The MACD dual lines showed four obvious golden crosses above the zero line. The gains after the first two golden crosses were limited, while significant rises occurred after the last two golden crosses. Most death crosses appearing in the bullish control range were failed signals.
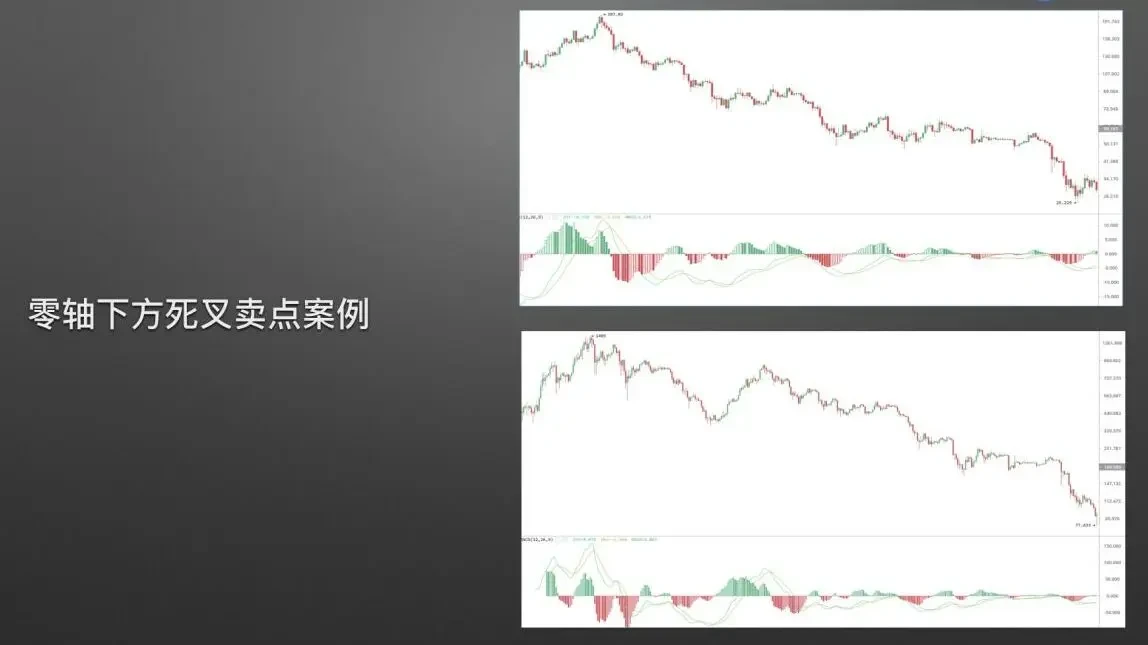
Next, let's look at two death cross cases.
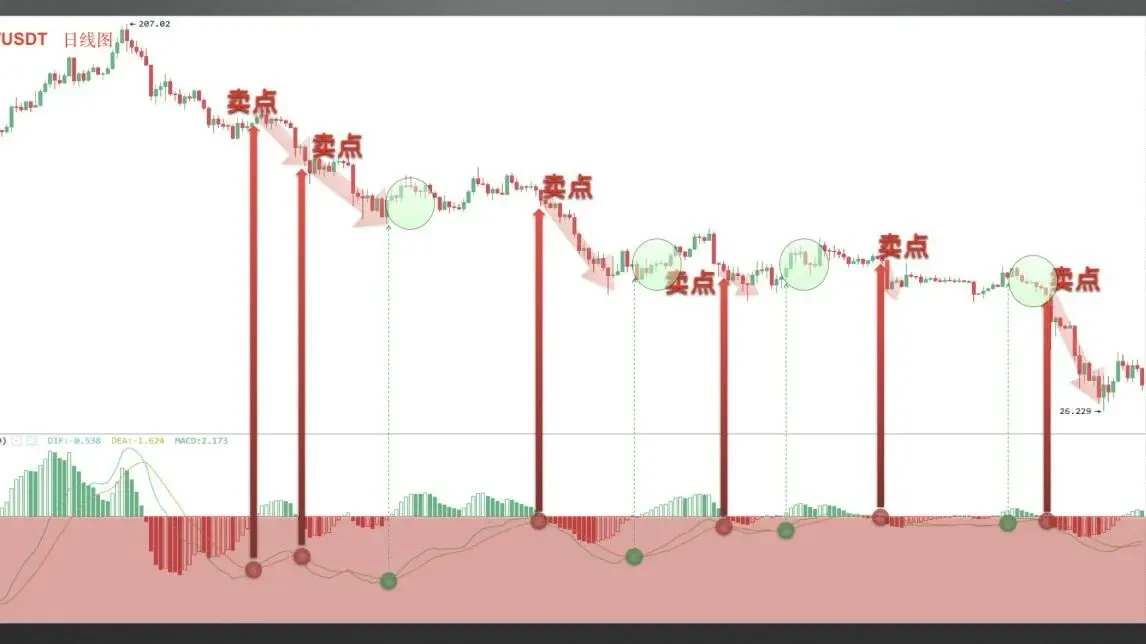
Case 1 screenshot is from OKX, LTC/USDT daily chart. The MACD dual lines showed six death crosses in the bearish control area below the zero line, and the price declined to varying degrees after each death cross. Although rebounds occurred after golden crosses formed, the magnitudes were quite limited.
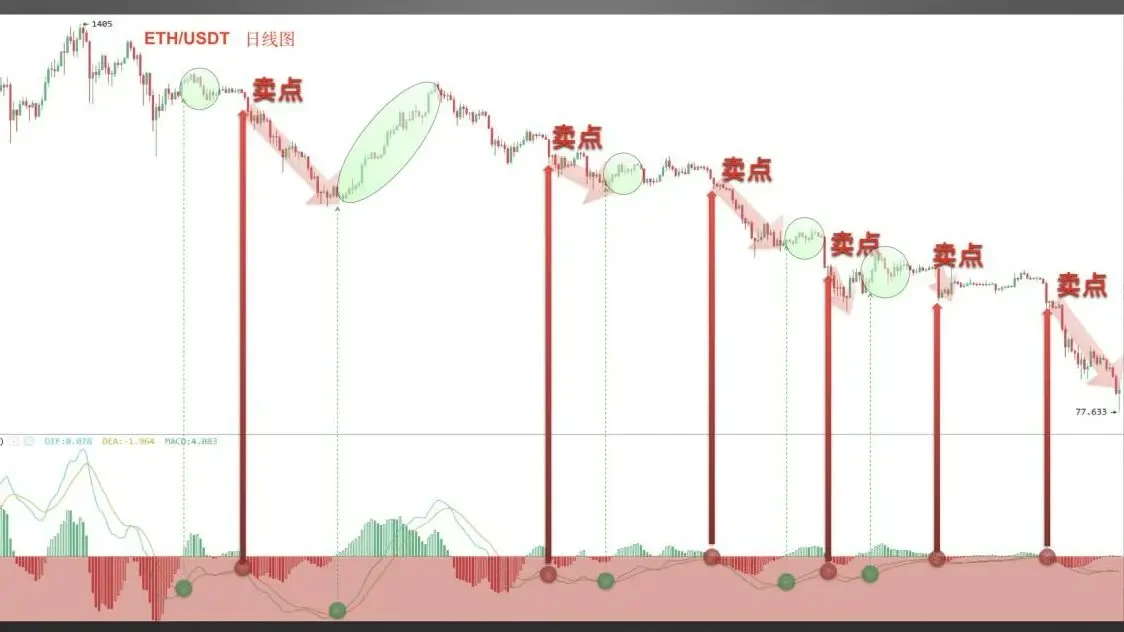
Case 2 screenshot is from OKX, ETH/USDT daily chart. The MACD dual lines similarly showed six death crosses below the zero line, and going short after death crosses can yield good returns. In the bearish control area, there were five obvious golden crosses; except for the second one which showed a significant rebound, the remaining four had no operational value.
2) Bullish Divergence and Bearish Divergence
In addition to golden cross and death cross, MACD bullish divergence and bearish divergence are also very commonly used market analysis methods. Bullish divergence is used to find buy points, while bearish divergence is used to find sell points.
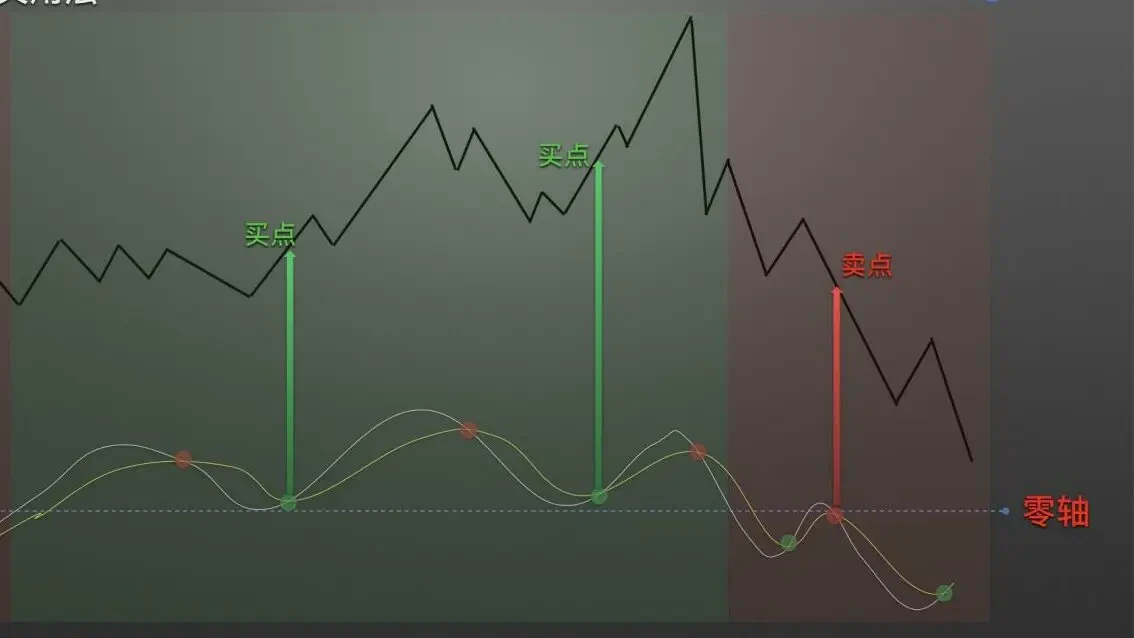
First, let's understand what MACD bullish divergence is through a schematic diagram.
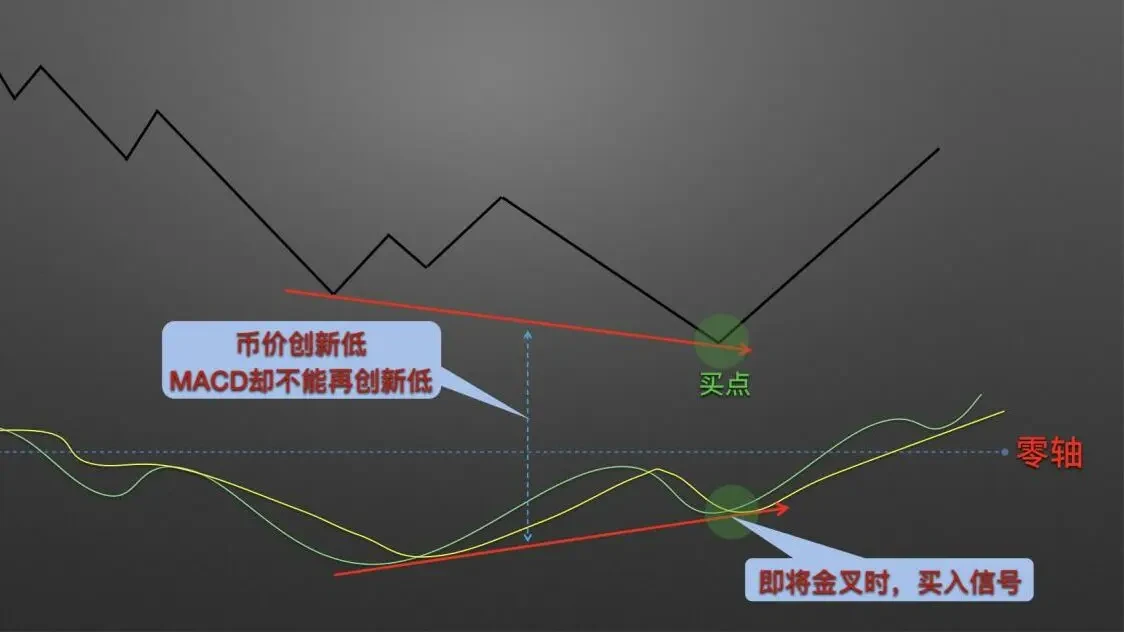
Bullish divergence always occurs below the zero line. When both price and MACD indicator dual lines are moving downward simultaneously, and price is making new lows but the MACD dual lines cannot simultaneously make new lows, the MACD indicator forms bullish divergence with price. When the MACD dual lines are about to form a golden cross, that is the buy signal.
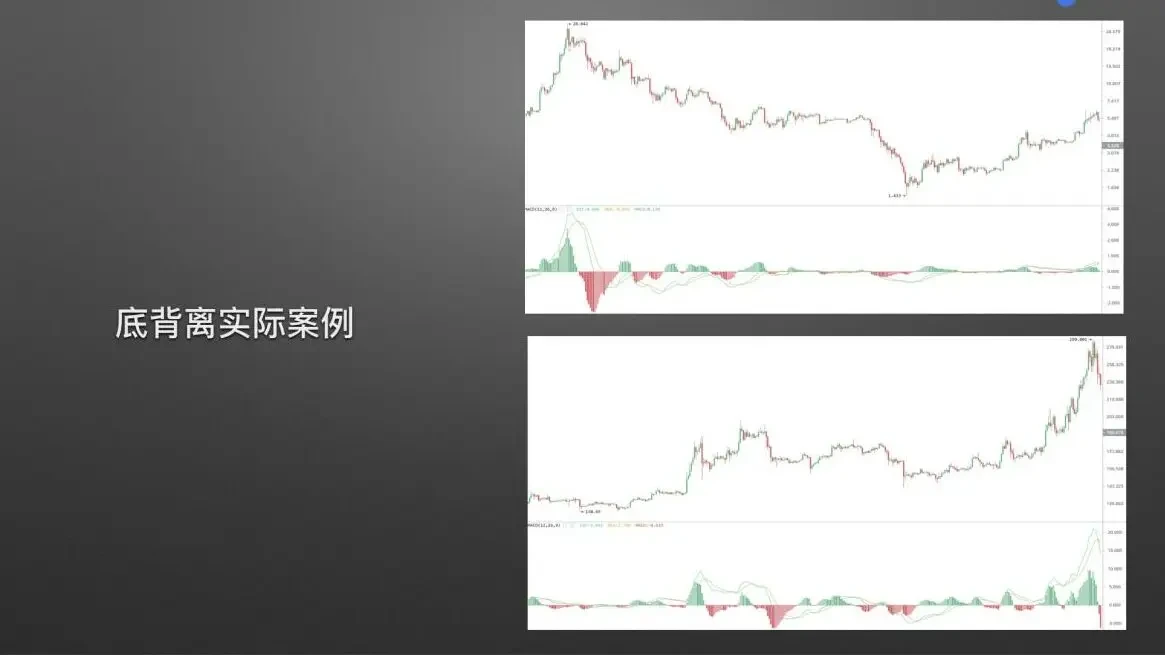
Let's deepen our understanding of bullish divergence through two actual cases.
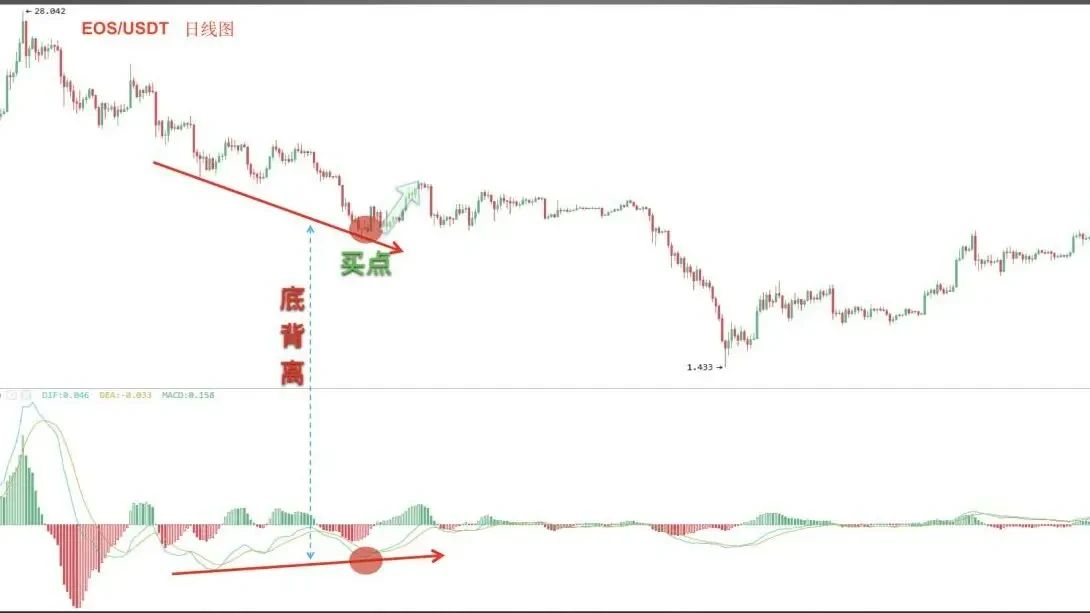
Case 1 screenshot is from OKX, EOS/USDT daily chart. Two obvious bullish divergences formed in this trend. The first rebound had relatively limited magnitude.
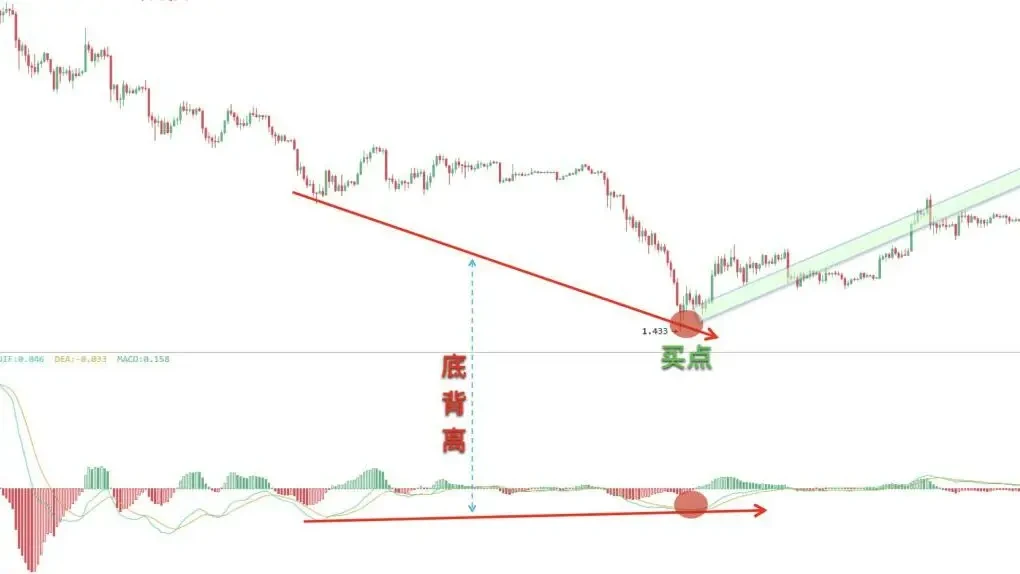
The second created the formation of a historic major bottom.
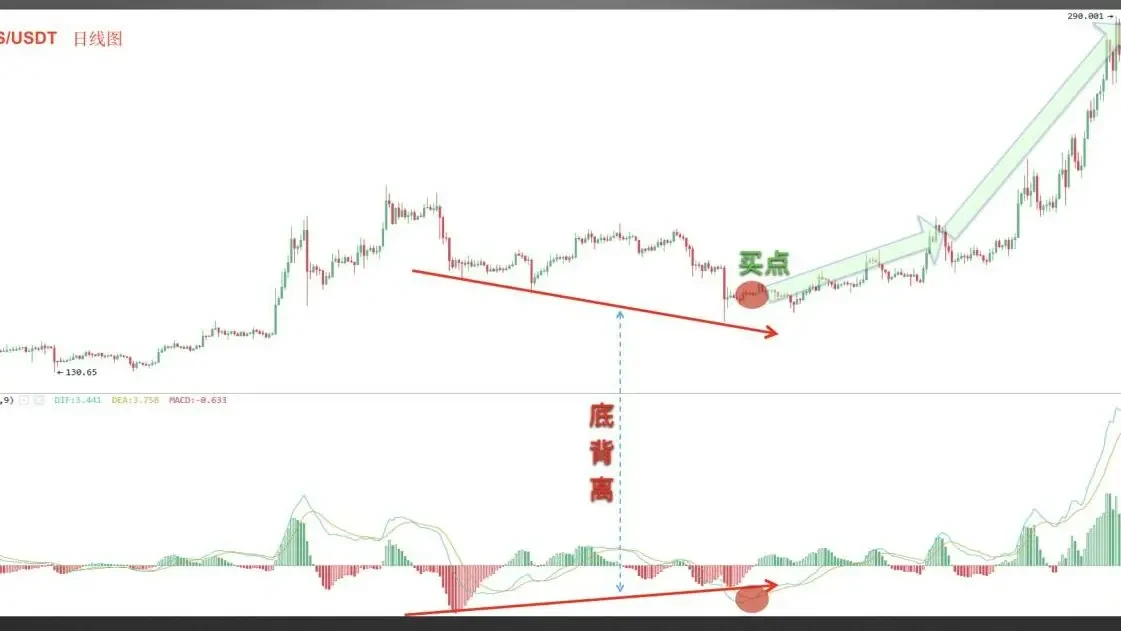
Case 2 is also an EOS/USDT daily chart. This time, bullish divergence occurred during the pullback phase of an uptrend, and the price showed significant gains again after the bullish divergence.
Next, let's understand what MACD bearish divergence is through a schematic diagram.
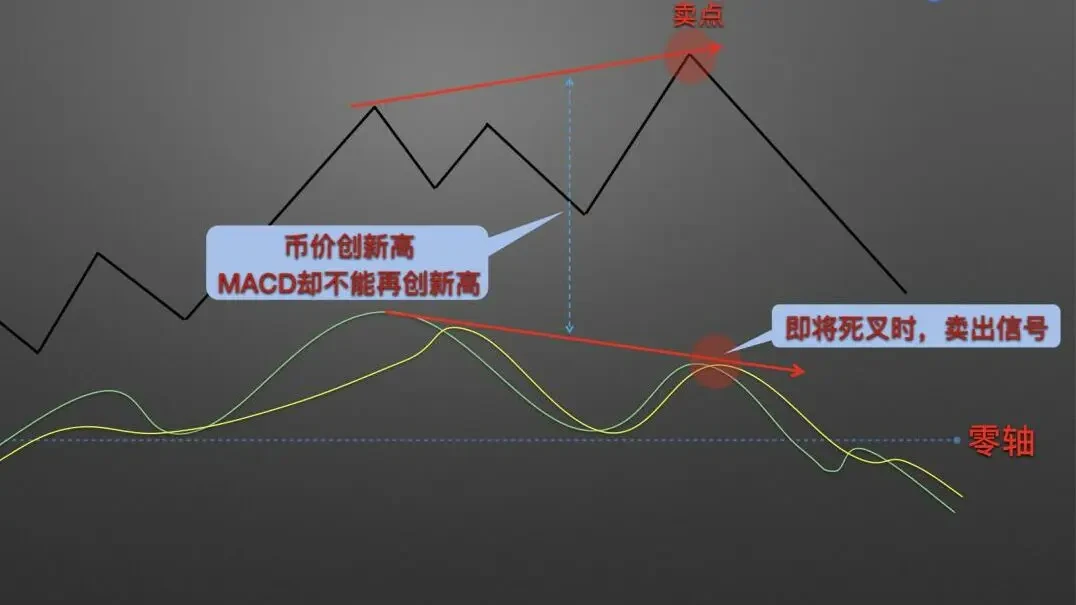
Bearish divergence always occurs above the zero line. When both coin price and MACD indicator dual lines are moving upward simultaneously, and price makes new highs but the MACD dual lines cannot simultaneously make new highs, the MACD indicator forms bearish divergence with price. When the MACD dual lines are about to form a death cross, that is the sell signal.
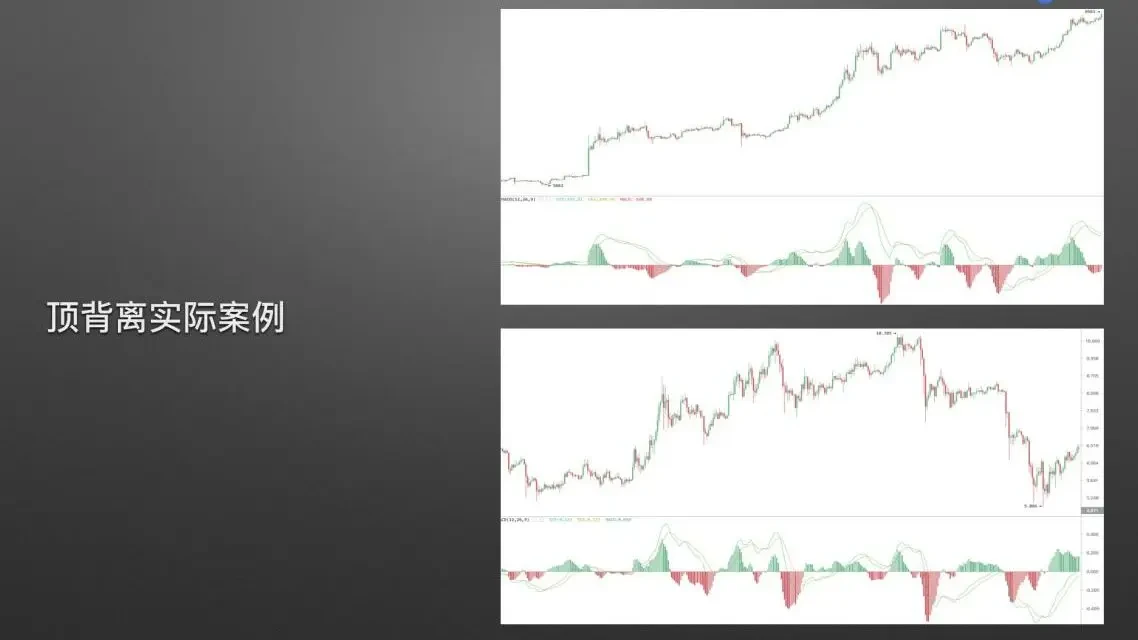
Let's deepen our understanding of bearish divergence through two actual cases.
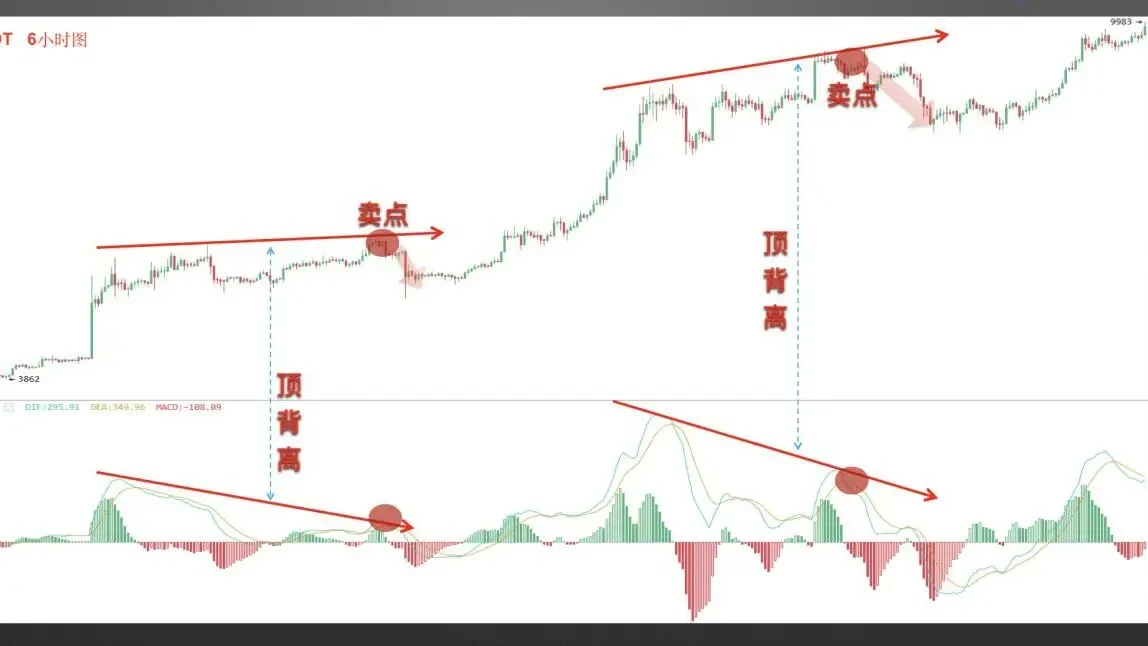
Case 1 screenshot is from OKX, BTC/USDT 6-hour chart. Two obvious bearish divergences appeared in this trend. The first occurred during the early stage of the uptrend. After MACD formed bearish divergence with price, the price showed a minor correction. The second occurred after a significant rise, and the MACD bearish divergence led to the formation of a cyclical top in coin price.
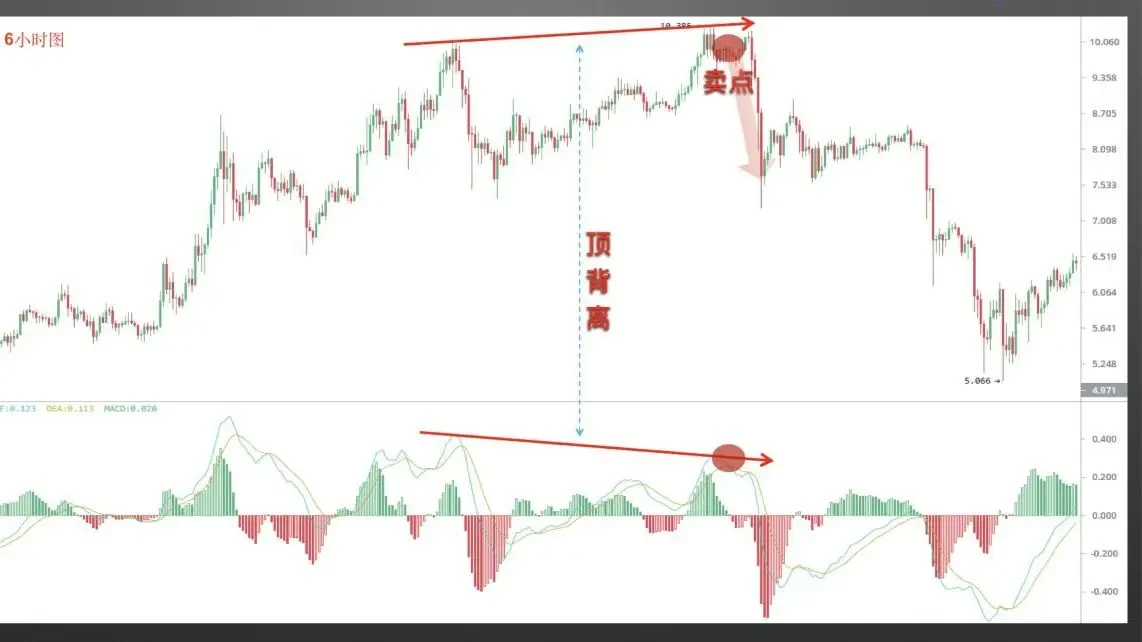
Case 2 screenshot is from OKX, ETC/USDT 6-hour chart. After bearish divergence formed between coin price and MACD, a significant decline occurred. If you understand the significance of MACD bearish divergence, you can smoothly exit at the top and preserve most of your profits.
Finally, let's briefly review this section.
MACD consists of four parts: the fast line DIF, the slow line DEA, histogram bars, and the zero line.
Above the zero line is the bullish control area, mainly focusing on buying when golden crosses appear; below the zero line is the bearish control area, mainly focusing on selling when death crosses appear.
Bullish divergence is a bullish signal, mainly for buying; bearish divergence is a bearish signal, mainly for selling.
Disclaimer
This article may contain product-related content not applicable to your region. This article is intended to provide general information only and does not take responsibility for any factual errors or omissions therein. This article represents only the author's personal views and does not represent the views of OKX. This article is not intended to provide any advice, including but not limited to: (i) investment advice or investment recommendations; (ii) offers or solicitations to purchase, sell, or hold digital assets; or (iii) financial, accounting, legal, or tax advice. Holding digital assets (including stablecoins) involves high risk, may fluctuate significantly, and may even become worthless. You should carefully consider whether trading or holding digital assets is suitable for you based on your financial situation. For questions regarding your specific situation, please consult your legal/tax/investment professional. The information appearing in this article (including market data and statistics, if any) is for general reference only. Although we have taken all reasonable precautions in preparing these data and charts, we accept no responsibility for any factual errors or omissions expressed herein. © 2025 OKX. This article may be reproduced or distributed in its entirety, or excerpts of 100 words or less from this article may be used, provided that such use is non-commercial. Any reproduction or distribution of the entire article must prominently state: "Copyright © 2025 OKX. Used with permission." Permitted excerpts must cite the article title and include attribution, for example "Article Name, [Author Name (if applicable)], © 2025 OKX". Some content may be generated or assisted by artificial intelligence (AI) tools. Derivative works or other uses of this article are not permitted.
Show More
Recommended Reading

Can You Profit When Bitcoin Falls? How to Conduct Contract Trading
As the cryptocurrency market scale represented by Bitcoin continues to expand, diverse forms of derivative trading have gradually emerged beyond spot trading as tools to hedge risk. Among them, contract trading receives the most attention. What is contract trading? Contracts are the most common trading contract form in the cryptocurrency derivatives market. Digital assets contract trading refers to buyers and sellers agreeing to trade certain assets at a specified price at a future time.
January 16, 2026

Simpler Than Copy Trading? One-Click Follow Top Strategy Traders on OKX, Let Traders Earn Money for You
Whether in traditional finance or the cryptocurrency market, strategy trading is a very important and critical method in the trading system. When facing complex trading environments and extreme market conditions, even with solid theoretical technical knowledge and rich trading experience, it's easy to miss trading opportunities or make wrong judgments and operations due to emotional influence. Strategy trading is precisely an effective tool that can solve these problems. With trading tools available, how to use
November 21, 2025

Five, Strategy Trading Series Courses — Accumulator
Introduction: We often have this speculation: In bull markets, there are many digital assets with significant gains. If we can continuously capture assets with large increases, for example catching one doubling digital asset each month, after one year your assets will become 2 to the power of 12, i.e., 4096 times, which is very amazing. Of course, this is also almost an impossible thing to complete, because we can hardly continuously catch surging assets. This is also a problem many users encounter: In bull markets, although
November 3, 2025

Which Countries/Regions Do Not Support Registration to Use OKX
OKX currently does not provide services to customers in the following regions: certain U.S. territories, such as New York, Texas, Puerto Rico, American Samoa, Guam, Commonwealth of the Northern Mariana Islands, U.S. Virgin Islands (St. Croix, St. John, and St. Thomas), Cuba, Iran, North Korea, Crimea, Malaysia, Syria, Bangladesh, and Bolivia. For details, please refer to the OKX Terms of Service.
April 25, 2024

Quickly Understand OKX Common Products and Features
OKX (www. okx. com) is one of the world's famous digital asset service platforms, mainly providing global users with Bitcoin, Ethereum and other digital assets spot and derivative trading services, while also exploring the world of DeFi, DApps, NFTs and GameFi together with users. On OKX, You can enjoy smooth trading experiences such as spot and contracts, keep abreast of token information in hot areas/concepts, and also
April 25, 2024

Zero-Basic Guide to K-Line Patterns | 5 The Importance of K-Line Combination Applications
Markets have trends, understand the language of price; buy and sell have signals, say goodbye to intuitive trading. I. Bullish K-Line Combinations at Key Positions In the first two sections of this chapter, we explained the applications of bullish and bearish K-line combinations, but these combinations are not effective when appearing at any position. In this section, we will explain the importance of where combinations appear. Where can bullish combinations better play their role? The first situation: In a clear uptrend, near the previous
April 25, 2024


