Zero-Based K-Line Learning | 23 Common Analysis Indicators 5—KDJ
Trends have patterns, understand the language of prices;
Buy/sell has signals, say goodbye to intuitive trading.
In this course, we learn the fifth lesson of the intricate technical indicators—the Stochastic Oscillator KDJ.
I. Stochastic Oscillator KDJ
First, let's get to know the KDJ indicator.
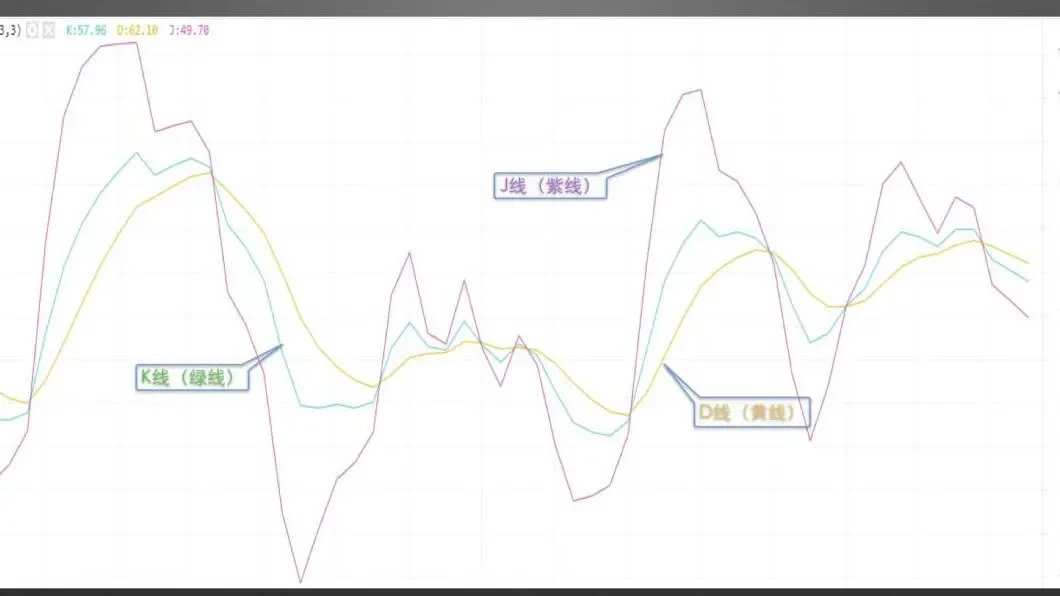
Screenshot from OKX BTC quarterly futures daily chart. As shown in the figure, the KDJ indicator consists of three lines: the K-line, J-line, and D-line. The purple line is the J-line, most sensitive to price; the green line is the K-line, second most sensitive to price; the yellow line is the D-line, least sensitive to price.
II. Application Rules of KDJ Indicator
So how to use the KDJ indicator to assist in analyzing price movements?
1) Basic Usage
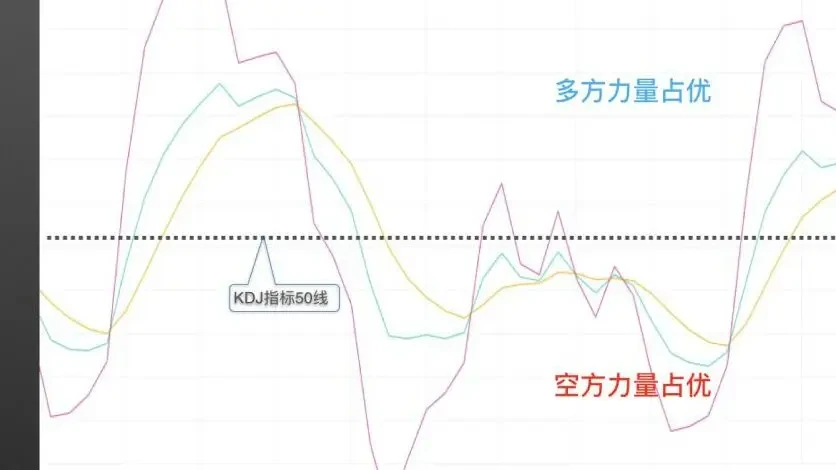
Bullish/bearish power comparison. Screenshot from OKX BTC quarterly futures daily chart. The black dashed arrow in the figure indicates the indicator value is 50, representing a balanced state between bulls and bears. When K, D, and J values are all above 50, it indicates bullish strength dominates; when K, D, and J values are all below 50, it indicates bearish strength dominates.
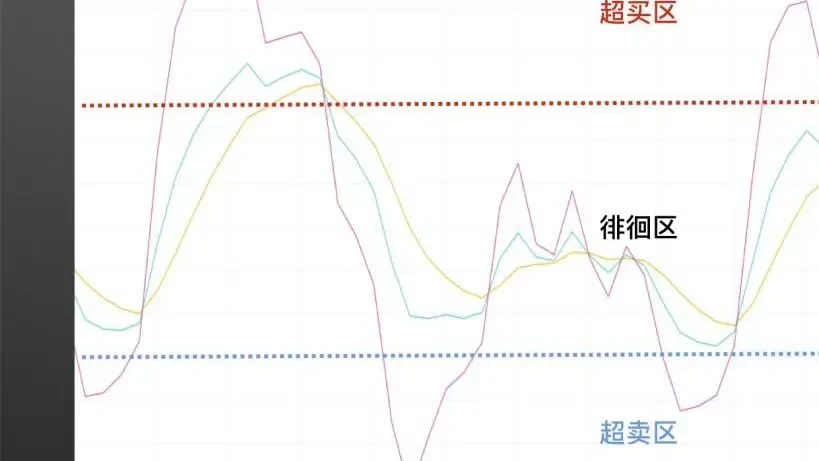
Overbought/oversold zones. Screenshot from OKX BTC quarterly futures daily chart. The blue dashed arrow indicates the indicator value is 20; the red dashed arrow indicates the indicator value is 80. According to general classification standards, K, D, and J values below 20 are in the oversold zone, signaling a high probability of future price increase; K, D, and J values above 80 are in the overbought zone, signaling an easy occurrence of future price decline; K, D, and J values between 20-80 are in the wandering zone, suitable for观望.
Understanding bullish/bearish power comparison and overbought/oversold zones, let's look at the third aspect of KDJ.
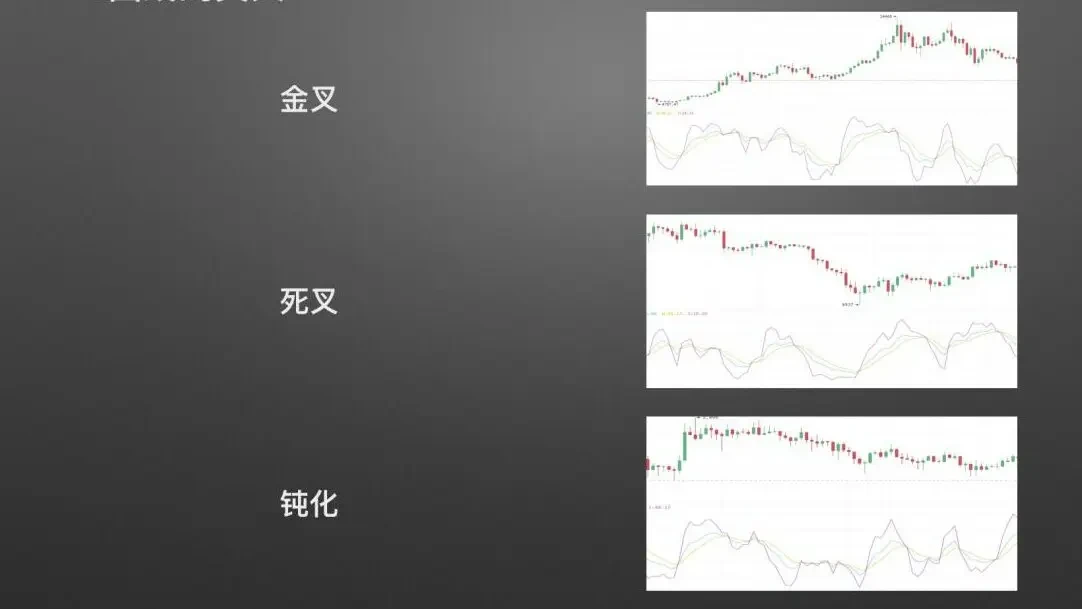
KDJ curve crossovers are usually divided into two forms: golden cross and death cross, with the钝化 formation formed by repeated KDJ curve crossovers being a special case.
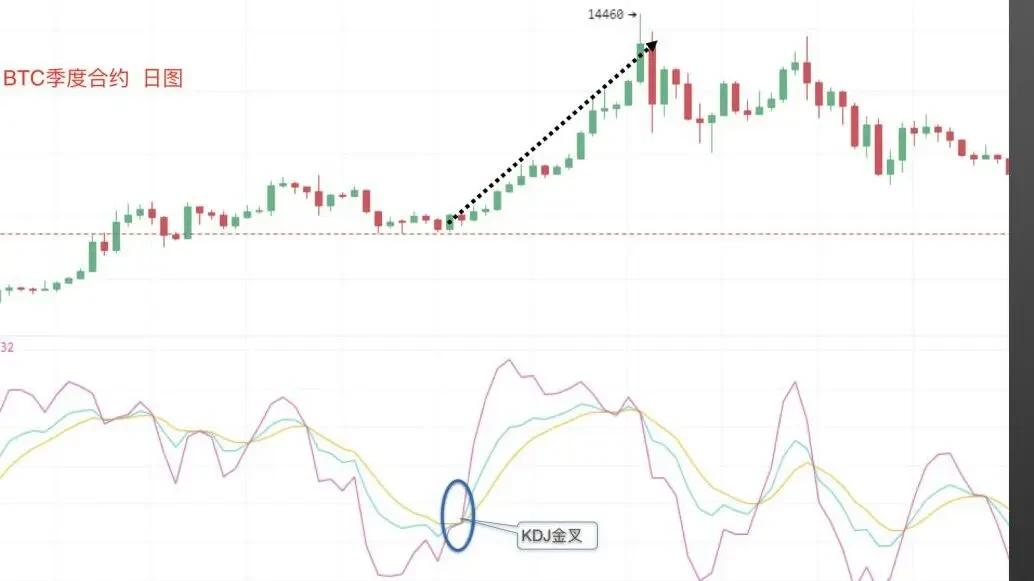
Golden cross example: Screenshot from OKX BTC quarterly futures daily chart. As shown in the blue circle position, when the short-period KDJ curve crosses the long-period KDJ curve from bottom to top, forming a golden cross (金叉), price is highly likely to rise, as shown by the price trend indicated by the black dashed arrow.
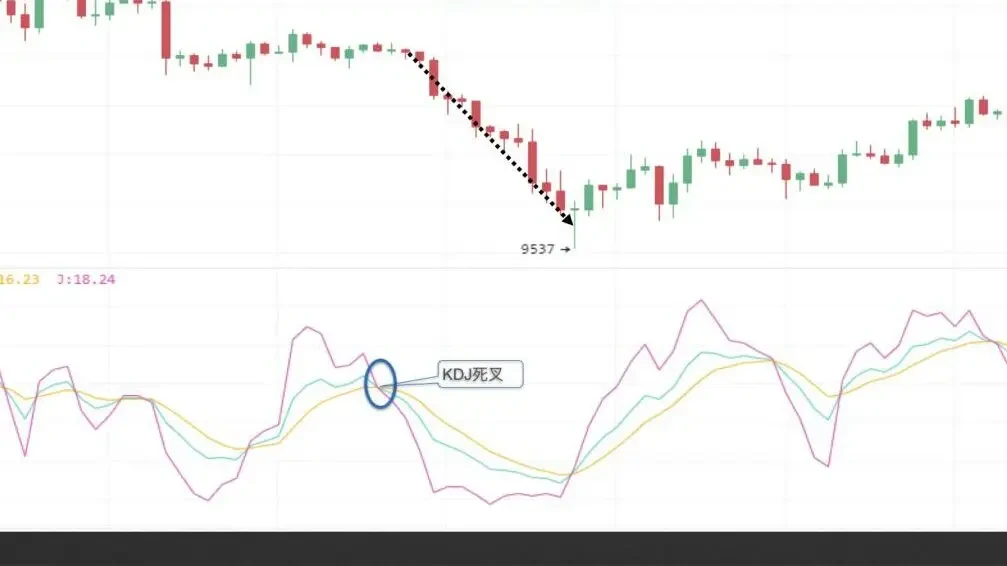
Death cross example: Screenshot from OKX BTC quarterly futures 4-hour chart. As shown in the blue circle position, when the purple J-line and green K-line both cross the yellow D-line from top to bottom, forming a death cross, the KDJ death cross signals a high probability of future decline, as shown by the price trend indicated by the black dashed arrow.
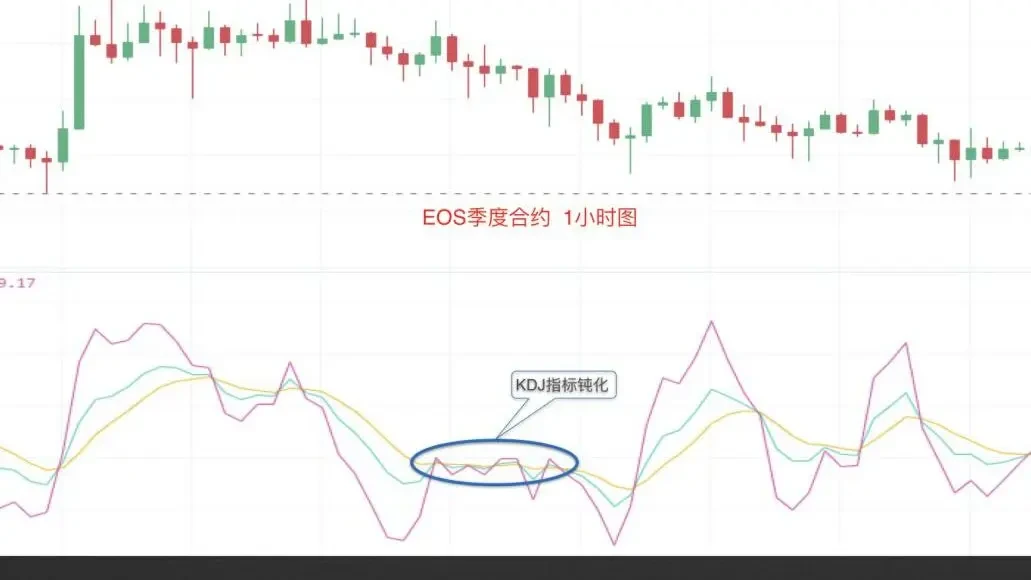
钝化 example: Screenshot from OKX EOS quarterly futures 1-hour chart. As shown in the blue circle, when the coin price follows a certain trend, the KDJ indicator frequently forms golden crosses or death crosses issuing buy/sell signals, appearing in a sticky state. This phenomenon is called indicator钝化. When钝化 occurs, crossover signals lose their guiding significance.
2) Pattern Analysis
Above we learned some basic uses of the KDJ indicator. Next let's see how to perform pattern analysis on KDJ curves.
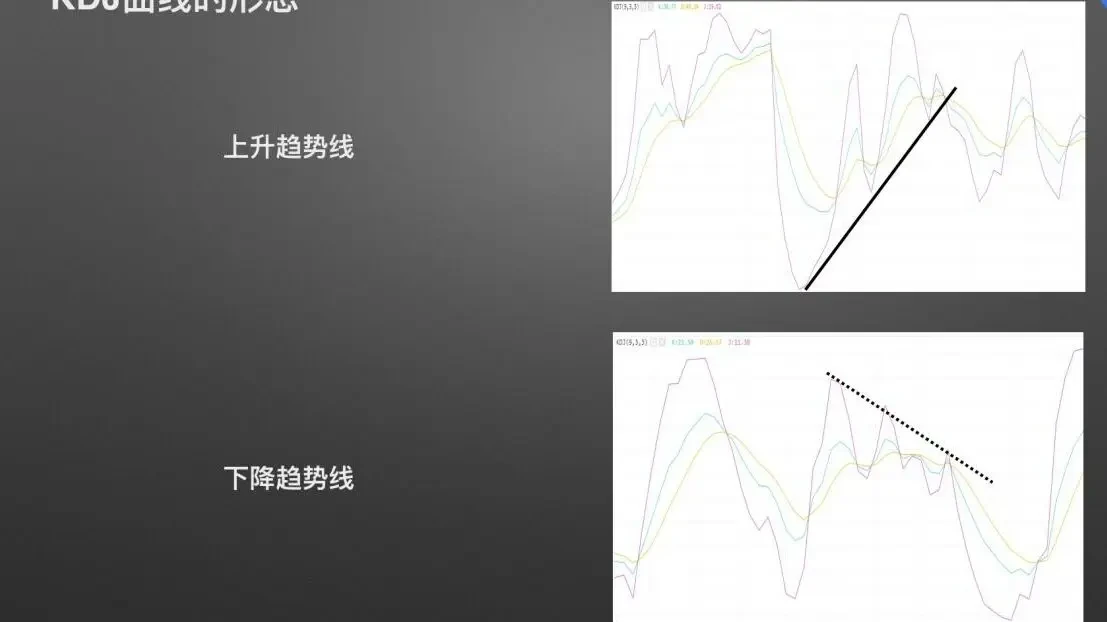
Common patterns in KDJ curves include uptrend lines and downtrend lines. As shown respectively: the uptrend line is shown by the black solid line in the upper figure; the downtrend line is shown by the black dashed line in the lower figure.
Specific examples of KDJ curve uptrend lines and downtrend lines will be detailed in the practical examples below. Additionally, other common KDJ curve patterns include W-bottom, M-top, triangular patterns, etc. Usage methods can refer to relevant content from courses 10, 13, and 15.
Finally, let's discuss the practical application of the KDJ indicator
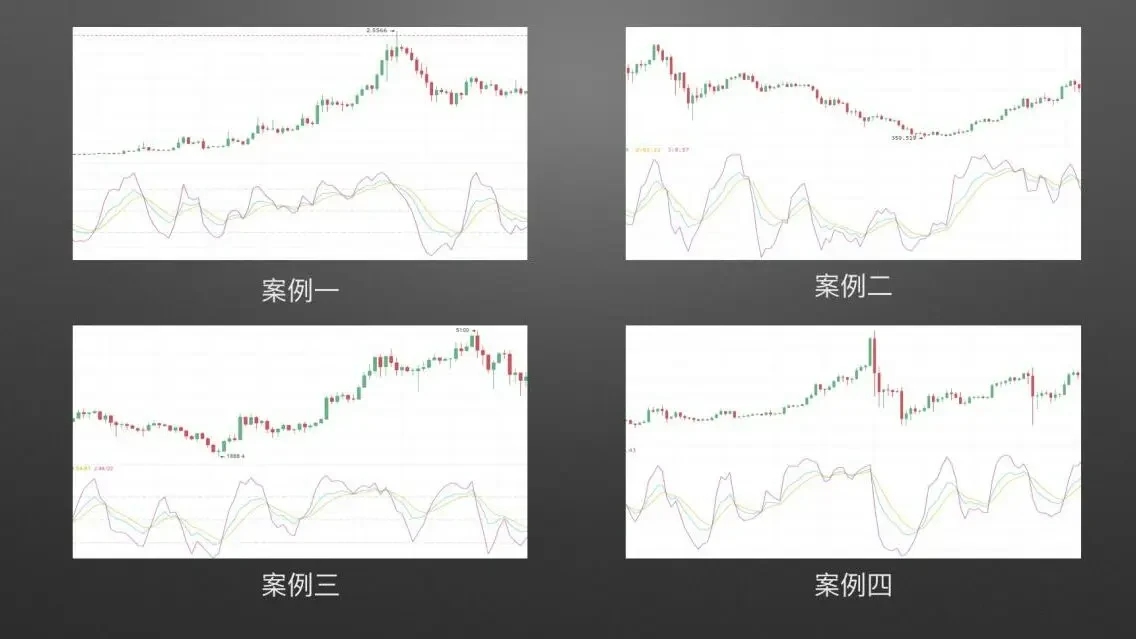
Below we look at a set of real examples
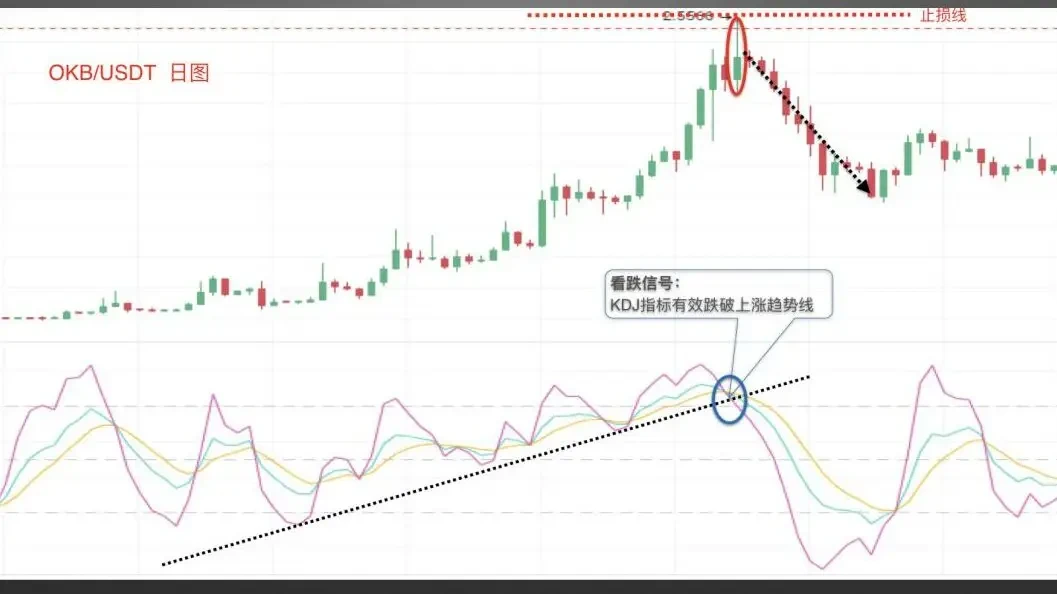
Example 1: KDJ indicator uptrend line application. Screenshot from OKX OKB/USDT daily chart. Coin price continuously rises, while KDJ indicator lows continuously move upward showing a clear uptrend. When KDJ indicator effectively breaks below this uptrend line, forming a bearish signal, and simultaneously the upper K-line shows a long upper shadow as shown in the red circle, the stop-loss line can be set at the highest point of the upper K-line corresponding to the effective break below the KDJ indicator uptrend line. Subsequently, the coin price welcomes a decline.
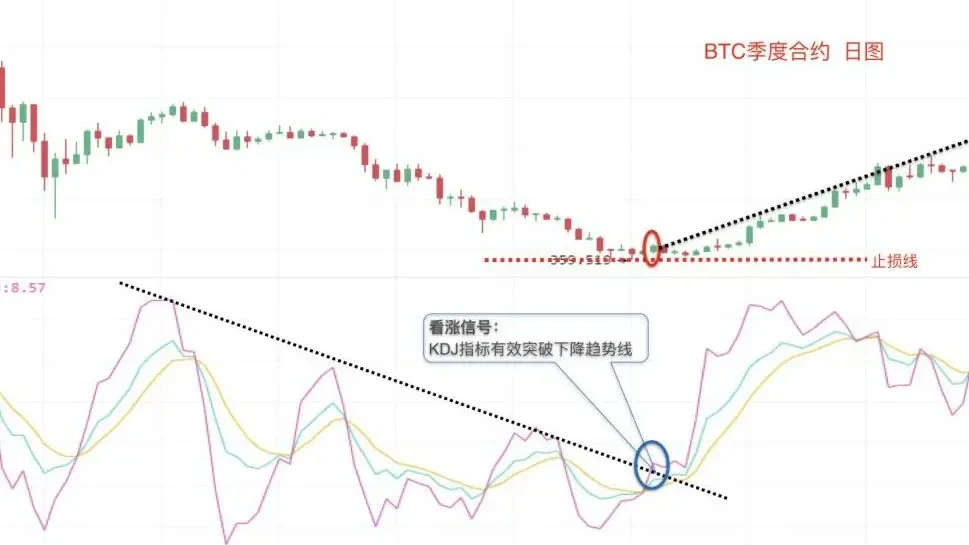
Example 2: KDJ indicator downtrend line application. Screenshot from OKX BTC quarterly futures daily chart. Coin price continuously falls, while KDJ indicator highs continuously move downward showing a clear downtrend. When KDJ indicator effectively breaks above this downtrend line, forming a bullish signal, and the corresponding upper K-line position is shown in the red circle, the stop-loss line can be set at the lowest point of the upper K-line corresponding to the effective break above the KDJ indicator downtrend line. Subsequently, the coin price welcomes a rise.
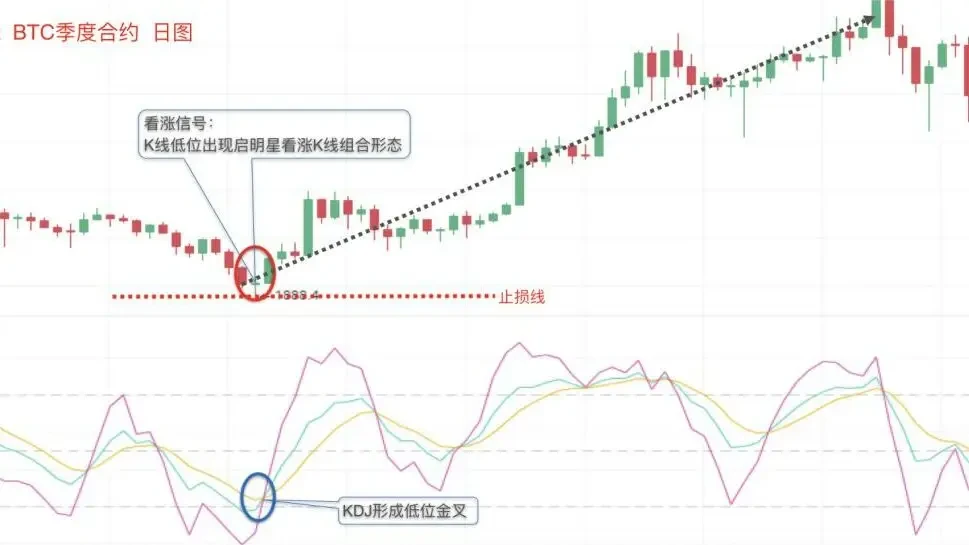
Example 3: Application of KDJ low-level golden cross and bullish K-line engulfing. Screenshot from OKX BTC quarterly futures daily chart. Coin price continuously falls, and at low levels appears the Morning Star bullish K-line combination pattern introduced in course 3. Simultaneously, the corresponding KDJ indicator forms a golden cross at low levels. This is a double bullish signal. The stop-loss line can be set at the lowest price of the doji in the Morning Star bullish K-line combination. Subsequently, the coin price welcomes a rapid rise.
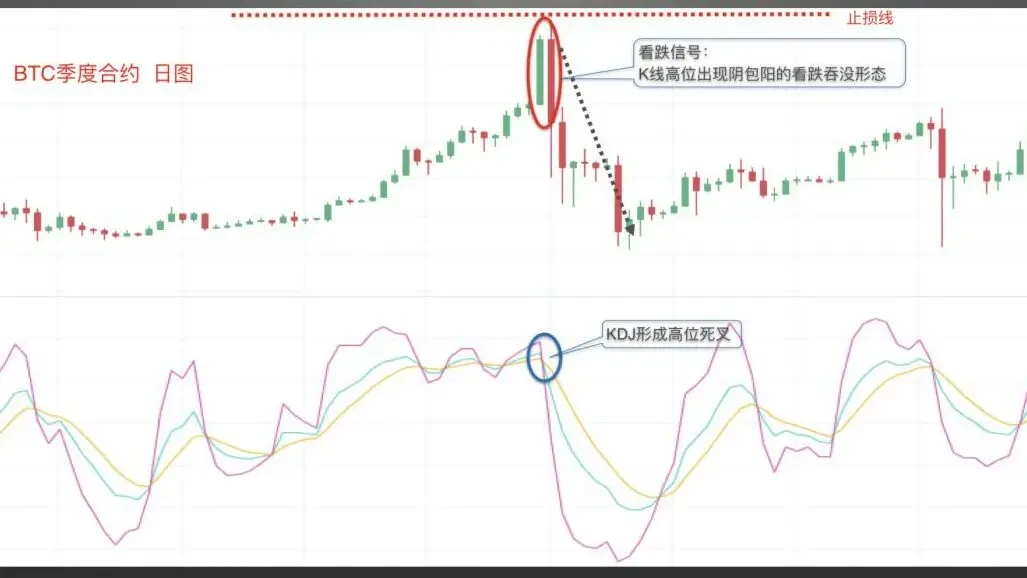
Example 4: Application of KDJ high-level death cross and bearish K-line engulfing. Screenshot from OKX BTC quarterly futures daily chart. Coin price continuously rises, and at high levels appears the bearish engulfing K-line pattern (阴包阳) introduced in course 4. Simultaneously, the corresponding KDJ indicator forms a death cross at high levels. This is a double bearish signal. The stop-loss line can be set at the highest point of the medium阴线 in the bearish engulfing. Subsequently, the coin price welcomes a rapid decline.
This concludes our discussion on the Stochastic Oscillator KDJ. In the next course, we begin learning the Relative Strength Index RSI.
Disclaimer
This article may contain product-related content not applicable to your region. This article is intended to provide general information only and does not accept responsibility for any factual errors or omissions therein. This article represents only the author's personal views and does not represent the views of OKX. This article is not intended to provide any of the following advice, including but not limited to: (i) investment advice or investment recommendations; (ii) offers or solicitations to buy, sell or hold digital assets; or (iii) financial, accounting, legal or tax advice. Holding digital assets (including stablecoins) involves high risk, may fluctuate significantly, and may even become worthless. You should carefully consider whether trading or holding digital assets is suitable for you based on your financial situation. For questions about your specific situation, please consult your legal/tax/investment professional. The information appearing in this article (including market data and statistics, if any) is for general reference only. While we have taken all reasonable precautions in preparing these data and charts, we accept no responsibility for any factual errors or omissions expressed herein. © 2025 OKX. This article may be reproduced or distributed in its entirety, or excerpts of 100 words or less from this article may be used, provided such use is non-commercial. Any reproduction or distribution of the entire article must also prominently state: "Copyright © 2025 OKX. Used with permission." Permitted excerpts must cite the article title and include attribution, such as "Article Name, [Author Name (if applicable)], © 2025 OKX". Some content may be generated or assisted by artificial intelligence (AI) tools. Derivative works or other uses of this article are not permitted.
Show More
Recommended Reading

Profit even when Bitcoin falls? How to trade futures
With the continuous expansion of the cryptocurrency market represented by Bitcoin, various forms of derivatives trading have gradually emerged beyond spot trading as a tool to hedge risk. Among them, futures trading receives the most attention. What is futures trading? Futures are the most common trading contract form in the cryptocurrency derivatives market. Digital assets futures trading refers to buyers and sellers agreeing to trade certain assets at a specified price at a future time.
January 16, 2026

Simpler than copy trading? One-click follow the strongest strategy traders on OKX, let traders make money for you
Whether in traditional finance or the cryptocurrency market, strategy trading is a very important and crucial method in the trading system. When facing complex trading environments and extreme trading conditions, even with solid theoretical knowledge and rich trading experience, it's easy to miss trading opportunities or make wrong judgments and operations due to emotional influence. Strategy trading is precisely an effective tool that can solve these problems. With trading tools available, how to use
November 21, 2025

V. Strategy Trading Series Courses—Earn
Preface: We often have this speculation: In bull markets, there are many digital assets with significant gains. If we can continuously capture assets with large increases, for example capturing one doubled digital asset per month, after one year your assets will become 2 to the power of 12, that is 4096 times, which is very amazing. Of course, this is also almost an impossible task to complete, because we find it difficult to continuously catch surging assets. This is also a problem many users encounter: In bull markets, although
November 3, 2025

Which countries/regions do not support registration to use OKX
OKX currently does not provide services to customers in the following regions: certain US territories such as New York, Texas, Puerto Rico, American Samoa, Guam, Commonwealth of the Northern Mariana Islands, US Virgin Islands (St. Croix, St. John and St. Thomas), Cuba, Iran, North Korea, Crimea, Malaysia, Syria, Bangladesh, and Bolivia. For details, please refer to the OKX Terms of Service.
April 25, 2024

Quickly understand OKX common products and features
OKX (www. okx. com) is one of the world's famous digital asset service platforms, mainly providing global users with Bitcoin, Ethereum and other digital assets spot and derivatives trading services, while also exploring the world of DeFi, dApps, NFTs and GameFi together with users. On OKX, you can enjoy smooth trading experiences such as spot and futures, keep up with token information in hot areas/concepts第一时间, and also
April 25, 2024

Zero-Based K-Line Learning | 5 Importance of K-Line Combination Applications
Trends have patterns, understand the language of prices; buy/sell has signals, say goodbye to intuitive trading. I. Key positions for bullish K-line combinations. In the first two sections of this chapter, we explained the applications of bullish K-line combinations and bearish K-line combinations, but these combinations are not effective when appearing in any position. In this section, we explain the importance of combination positions. Where can bullish combinations better play their role? First scenario: In a clear uptrend, the nearby front
April 25, 2024


