
Zero Basics to Learn Candlestick Charts | 24 Common Analysis Indicators 6 — RSI
Trends drive price movements, learn to read the language of markets;
Signals guide your trades, move beyond gut feeling Trading.
1. Relative Strength Index (RSI)
In this lesson, we will cover the sixth part of our series on intertwined technical indicators — the Relative Strength Index (RSI).
Let us first look at the RSI indicator chart.
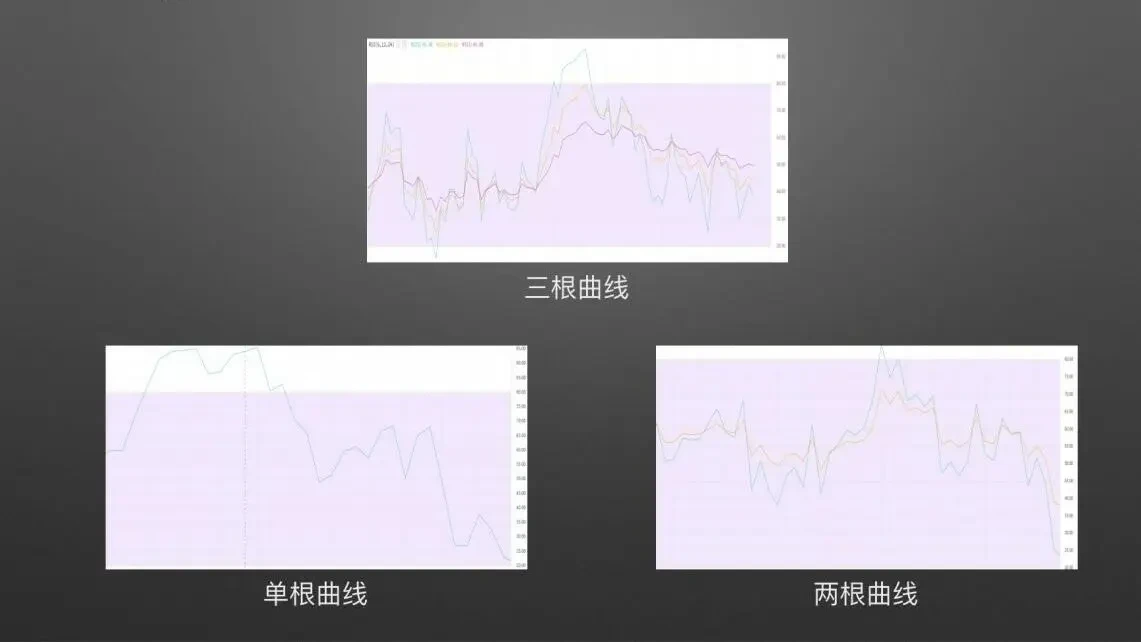
A typical RSI indicator consists of three curves with different parameters, though it can also be configured as a single curve or two curves. This indicator was proposed by Welles Wilder and reflects the market's degree of optimism or pessimism over a given period. It is one of the more commonly used short- to medium-term indicators in technical analysis.
2. Application Rules of the RSI Indicator
So how do you use the RSI indicator to determine whether the market will rise or fall?
We mainly analyze it through four aspects: RSI values, RSI curve crossovers, RSI curve patterns, and RSI divergences.

First, let us look at RSI values. The screenshot is from the OKX BTC quarterly futures 1-hour chart. RSI values range from 0 to 100, with RSI=50 serving as the boundary between a strong and a weak market. When the RSI curve crosses below 50 from above, it indicates the market has weakened; when the RSI curve crosses above 50 from below, it signals the market is gaining strength. When RSI falls below 20, the market is in an extremely oversold condition, which is a potential bullish signal. When RSI exceeds 80, the market is in an extremely overbought condition, which is a potential bearish signal.
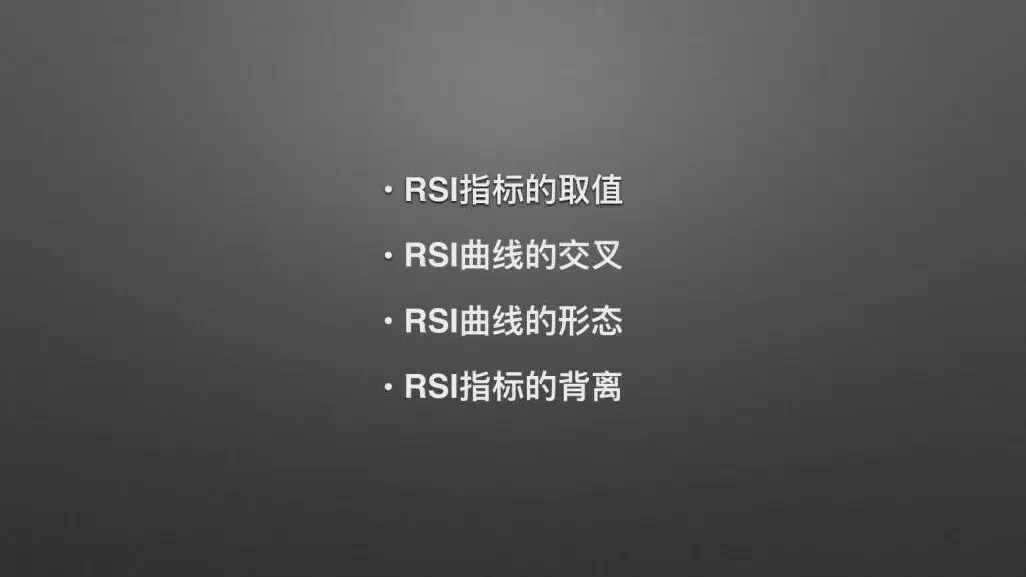
Next, let us look at RSI curve crossovers. Similar to the KDJ indicator in the previous lesson, RSI crossovers can also be divided into golden crosses and death crosses, as shown in the figures.
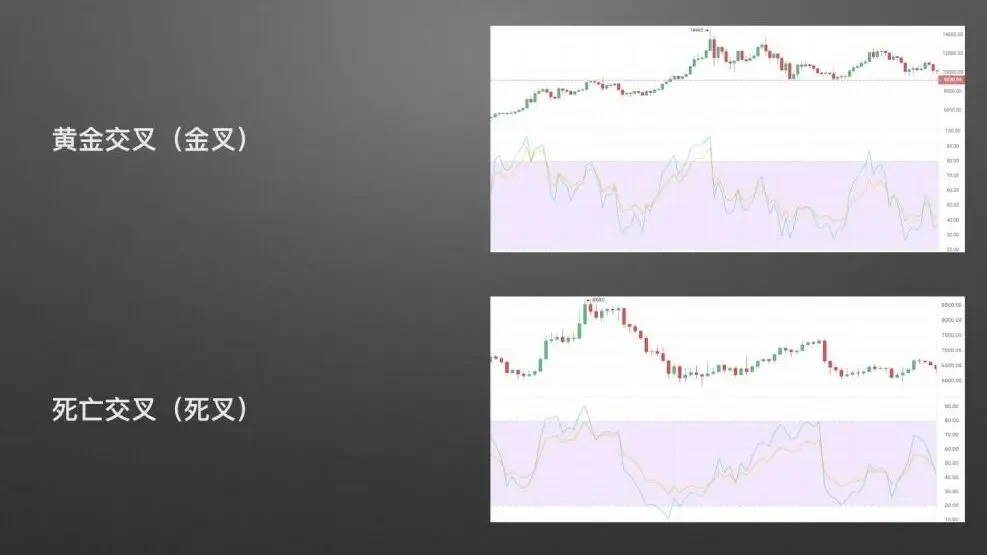
Golden cross example: The screenshot is from the OKX BTC quarterly futures daily chart. When the short-period green RSI curve crosses above the long-period yellow RSI curve, it forms a golden cross, as shown. The corresponding asset price is indicated by the red dashed arrow in the figure. The market is likely to start rising from the corresponding price level going forward.
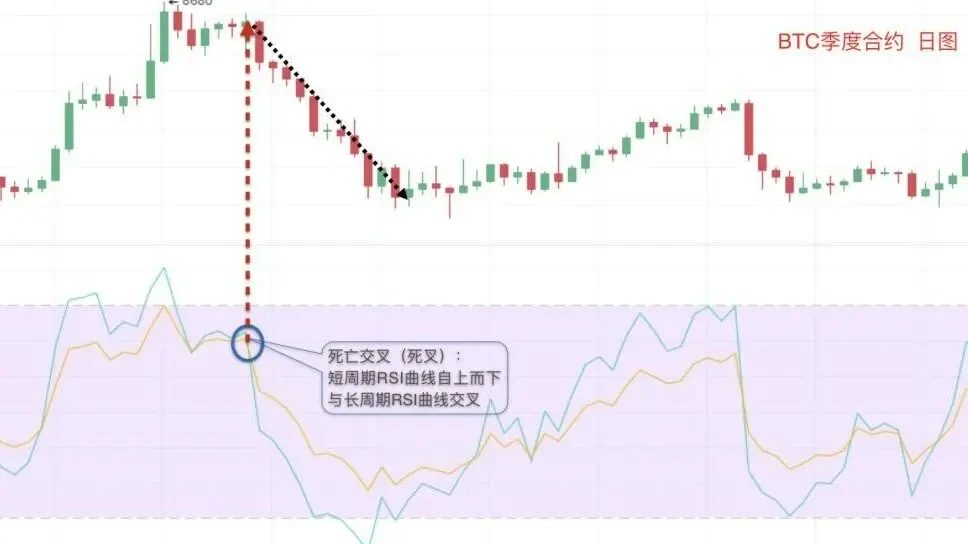
Death cross example: The screenshot is also from the OKX BTC quarterly futures daily chart. When the short-period green RSI curve crosses below the long-period yellow RSI curve, it forms a death cross, as shown. The corresponding asset price is indicated by the red dashed arrow in the figure. The market is likely to start declining from the corresponding price level going forward.
Having learned some basic uses of the RSI indicator above, let us now look at how to perform pattern analysis on RSI curves.

Based on their direction, RSI curve patterns are typically divided into ascending trendlines and descending trendlines, as shown in the figures.
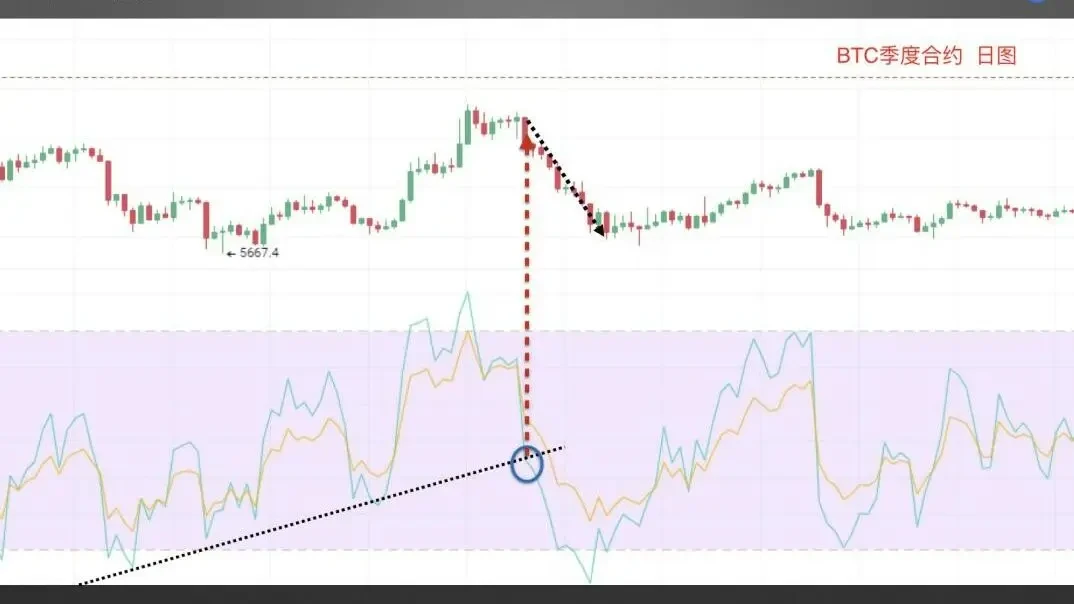
Ascending trendline: The screenshot is from the OKX BTC quarterly futures daily chart. As the asset price continues to rise, the RSI indicator runs upward along the ascending trendline. When the RSI curve breaks below the support formed by the ascending trendline, it generates a bearish signal. The corresponding asset price is indicated by the red dashed arrow in the figure. The market is likely to start declining from the corresponding price level going forward.
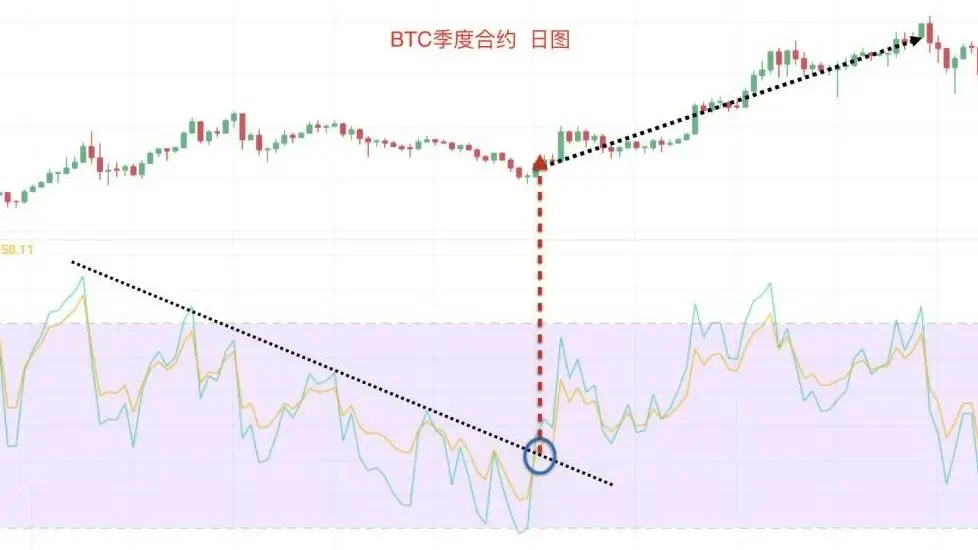
Descending trendline: The screenshot is also from the OKX BTC quarterly futures daily chart. As the asset price declines, the RSI indicator runs downward along the descending trendline. When the RSI curve breaks above the resistance formed by the descending trendline, it generates a bullish signal. The corresponding asset price is indicated by the red dashed arrow in the figure. The market is likely to start rising from the corresponding price level going forward.
In addition, other common RSI curve patterns include M-tops, W-bottoms, and triangular patterns, for which you may refer to the relevant content on candlestick pattern analysis covered in earlier lessons.
Having learned about RSI patterns, let us now discuss RSI divergences, which are equally important for traders to identify market turning points.
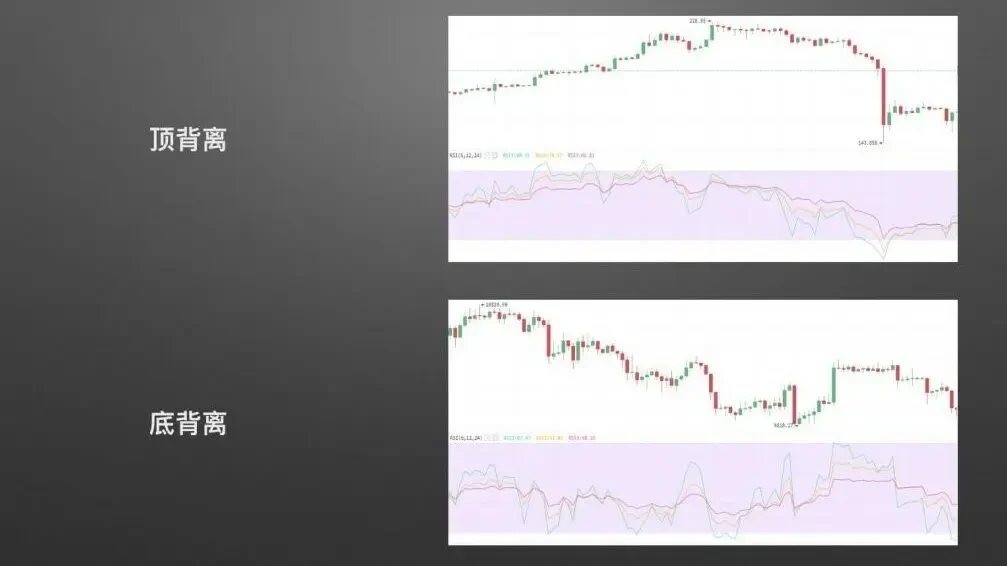
Like other indicators, RSI divergences come in two forms: bearish divergence and bullish divergence, as shown in the figures.
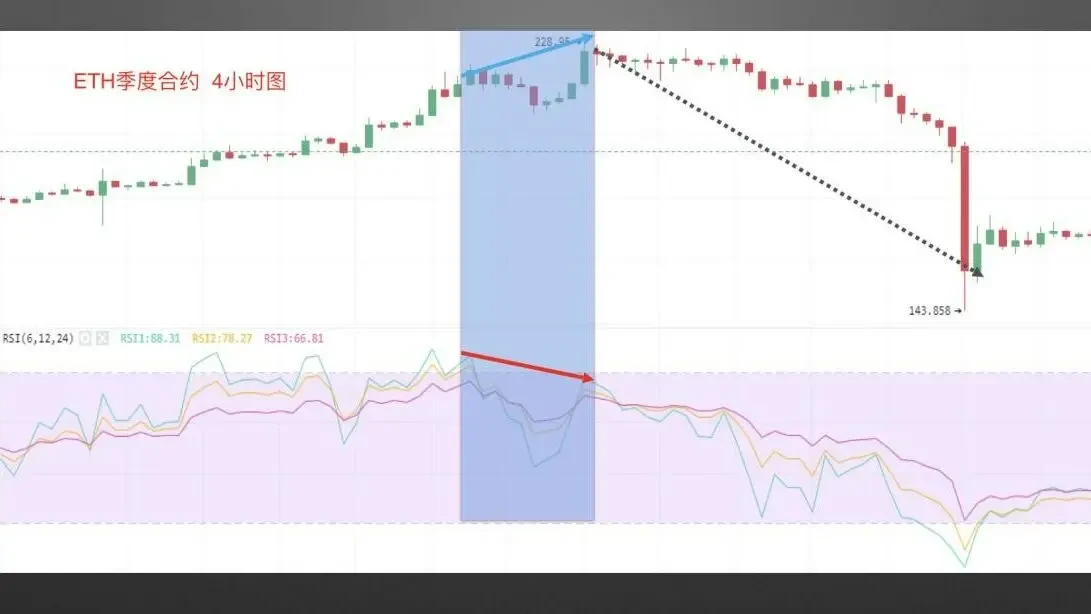
Bearish divergence: The screenshot is from the OKX ETH quarterly futures 4-hour chart. When the K-line price makes a new high but the RSI does not follow suit with a new high, a bearish divergence occurs, as highlighted in the blue area. This is likely to form a bearish signal, followed by a decline in the asset price.
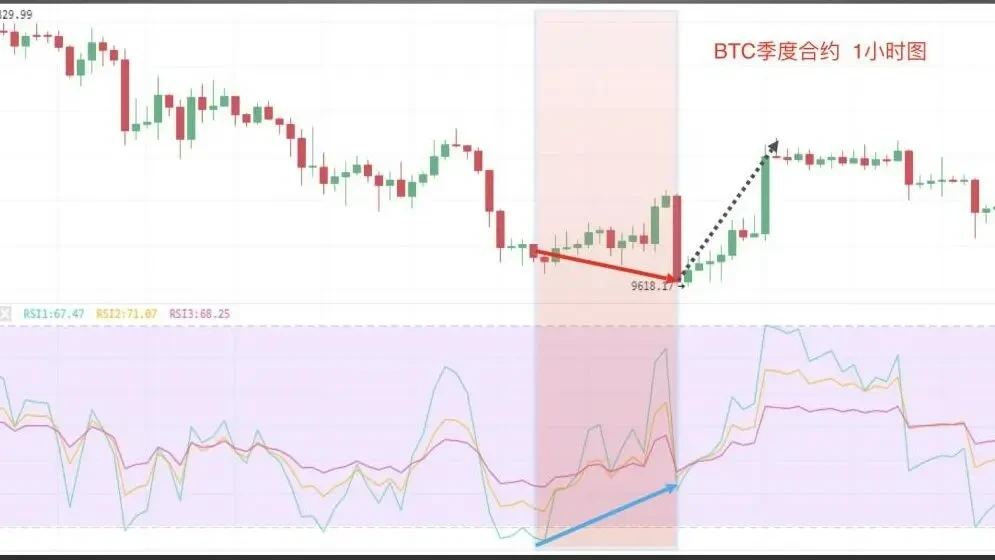
Bullish divergence: The screenshot is from the OKX BTC quarterly futures 1-hour chart. When the K-line price makes a new low but the RSI does not follow suit with a new low, a bullish divergence occurs, as highlighted in the red area. This is likely to form a bullish signal, followed by a rebound in the asset price.
Finally, let us discuss the practical application of the RSI indicator.
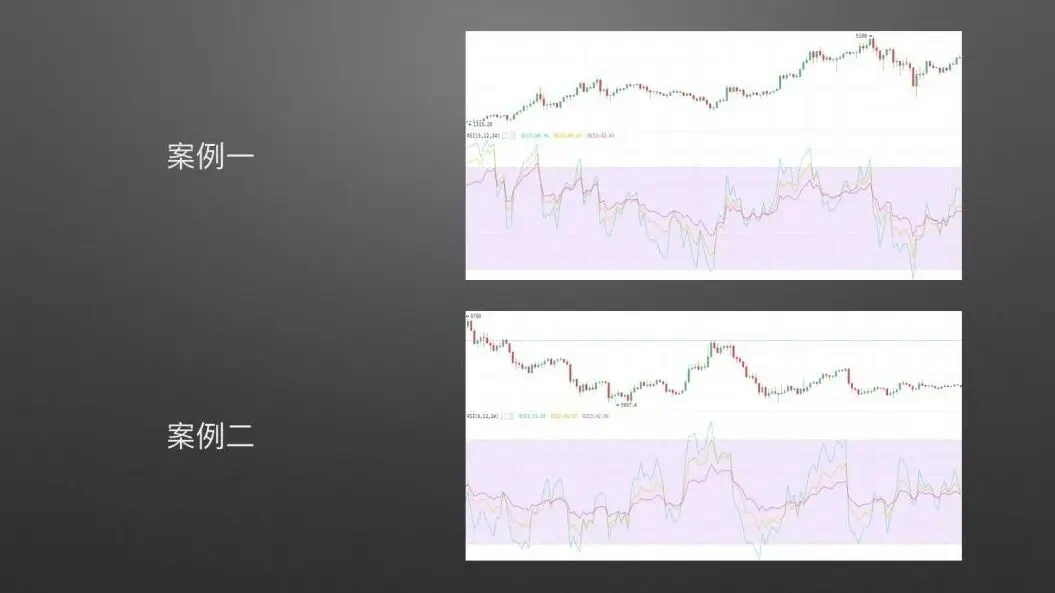
Practical examples are shown in Case 1 and Case 2 below.
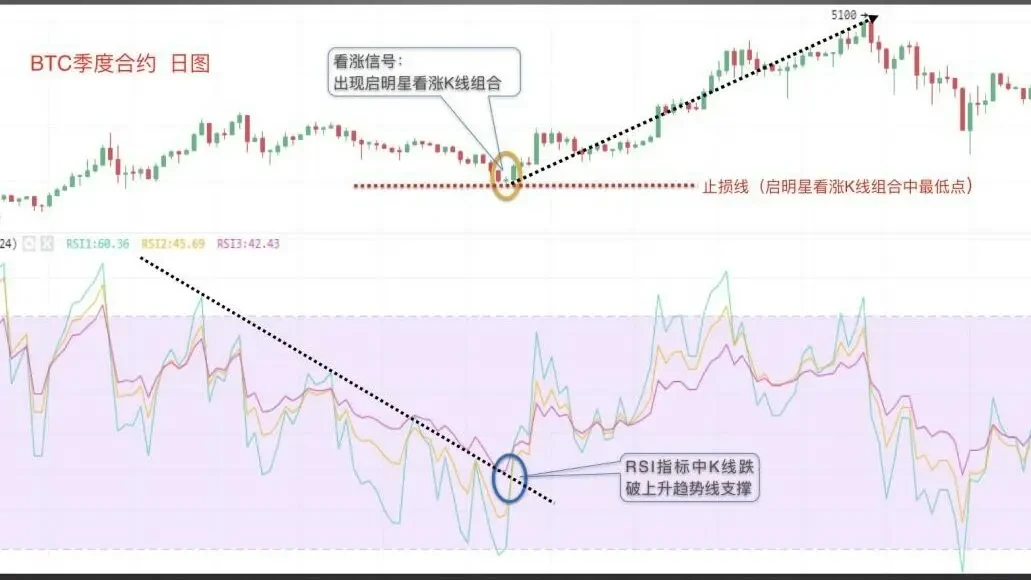
Case 1: Combining RSI descending trendline with morning star bullish candlestick pattern. The screenshot is from the OKX BTC quarterly futures daily chart. The RSI peak forms a descending trendline. When the RSI indicator breaks above the descending trendline and the price forms a morning star bullish candlestick pattern (covered in Lesson 3), this constitutes a bullish signal. The stop-loss can be set at the low of the morning star pattern. The asset price subsequently rose.
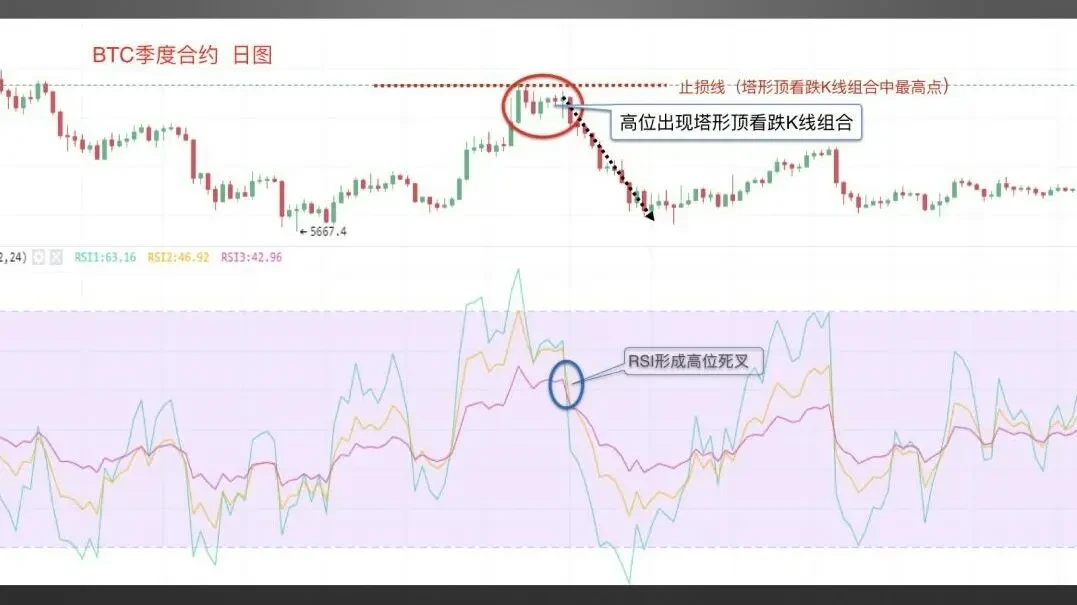
Case 2: Combining RSI high-position death cross with tower top bearish candlestick pattern. The screenshot is from the OKX BTC quarterly futures daily chart. As the asset price continues to rise, a tower top bearish candlestick pattern (covered in Lesson 4) appears at a high position in the K-lines, while the RSI indicator generates a death cross. This constitutes a bearish signal. The stop-loss can be set at the high of the tower top pattern. The asset price subsequently started to decline.
This concludes our discussion on the RSI indicator. In the next lesson, we will begin learning about the SAR indicator.
Disclaimer
This article may contain product-related information that may not be applicable to your region. This article is intended to provide general information only and makes no responsibility for any factual errors or omissions herein. This article represents only the author's personal views and does not represent the views of OKX. This article is not intended to provide any advice, including but not limited to: (i) investment advice or investment recommendations; (ii) offers or solicitations to purchase, sell, or hold digital assets; or (iii) financial, accounting, legal, or tax advice. Holdings in digital assets (including stablecoins) involve a high degree of risk and may fluctuate significantly, potentially even becoming worthless. You should carefully consider whether trading or holding digital assets is appropriate for you based on your financial situation. For questions specific to your circumstances, please consult your legal/tax/investment professional. Any information appearing in this article (including market data and statistics, where applicable) is provided for general reference purposes only. Although all reasonable precautions have been taken in preparing such data and charts, we assume no responsibility for any factual errors or omissions expressed herein. © 2025 OKX. This article may be reproduced or distributed in its entirety, or excerpts of 100 words or less may be used, provided that such use is for non-commercial purposes. Any reproduction or distribution of the full article must prominently state: "This article is copyrighted © 2025 OKX, used with permission." Permitted excerpts must cite the article title and include attribution, for example: "Article title, [author name (if applicable)], © 2025 OKX." Some content may have been generated or assisted by artificial intelligence (AI) tools. Derivative works and other uses of this article are not permitted.
Show More
Recommended Reading

Can You Profit from Bitcoin's Decline? How to Trade Futures
As the cryptocurrency market, led by Bitcoin, continues to expand, derivatives trading has gradually emerged in various forms alongside spot trading, serving as a hedging tool. Among these, futures trading has garnered the most attention. What is futures trading? Futures are the most common form of trading contracts in the cryptocurrency derivatives market. Digital assets futures trading refers to an agreement between buyers and sellers to trade a specific asset at a predetermined price at a future date.
January 16, 2026

Simpler Than Copying Strategies? Copy Top Traders with One Click on OKX and Let Them Earn for You
Whether in traditional finance or the cryptocurrency market, strategy trading is a crucial and key method within the trading system. When facing complex trading environments and extreme market conditions, even with solid theoretical knowledge and extensive trading experience, it is easy to miss trading opportunities or make incorrect decisions driven by emotions. Strategy trading is precisely an effective tool to address these issues. Now that you have your trading tools, how do you put them to use?
November 21, 2025

5. Strategic Trading Series — DCA Bot
Foreword: We often wonder: During a bull market, there are many digital assets that surge dramatically. If you could consistently capture assets with significant gains, for example, catching one that doubles every month, your assets would grow to 2 to the power of 12 — that is 4,096 times — after one year. That is truly remarkable, though of course it is nearly impossible, as it is very difficult to consistently catch assets that soar in value. This is a common challenge many users face: During a bull market, although
November 3, 2025

Which Countries/Regions Do Not Support OKX Registration
OKX currently does not provide services to customers in the following regions: certain US territories such as New York, Texas, Puerto Rico, American Samoa, Guam, the Commonwealth of the Northern Mariana Islands, the US Virgin Islands (St. Croix, St. John, and St. Thomas), Cuba, Iran, North Korea, Crimea, Malaysia, Syria, Bangladesh, and Bolivia. For more details, please refer to the OKX Terms of Service.
April 25, 2024

Quick Guide to OKX Common Products and Features
OKX (www. okx. com) is one of the world's renowned digital assets service platforms, primarily serving global users with
Bitcoin, Ethereum, and other digital assets spot and derivatives trading services, while also exploring the world of DeFi, dApps, NFTs, and GameFi together with its users. On OKX, you can enjoy seamless spot and futures trading experiences, stay updated on tokens in trending sectors/concepts in real time, and more.April 25, 2024

Zero Basics to Learn Candlestick Charts | 5 The Importance of Candlestick Combination Patterns
Trends drive price movements, learn to read the language of markets; signals guide your trades, move beyond gut feeling trading. 1. Key levels for bullish candlestick combinations In the first two installments of this chapter, we covered bullish and bearish candlestick combination patterns. However, these combinations are not effective at every position. In this section, we will explain why the location where these patterns appear matters so much. At which levels can bullish combinations play a more effective role? The first scenario: approaching the end of
April 25, 2024


