Zero-Basics Guide to candlestick Patterns: 25 Common Analysis Indicators — SAR
Trends drive price movements — learn to read what the market is saying.
Signals guide your entries and exits — stop trading on instinct and Trading with confidence.
1. The SAR Parabolic Indicator
First, let's understand what the SAR parabolic indicator is.
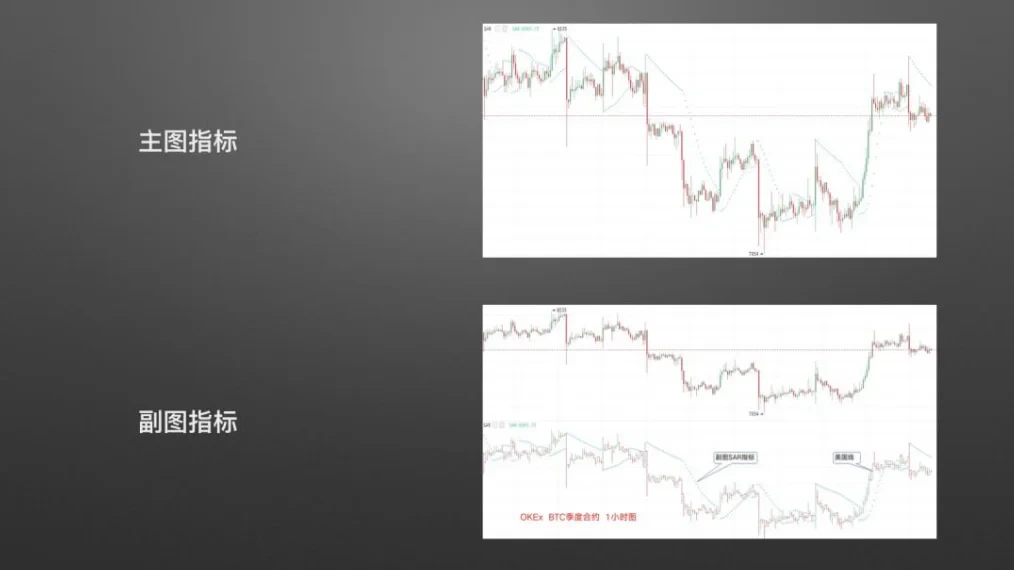
In practice, the SAR indicator can be added to both the main chart and sub-chart, as shown in the respective figures.
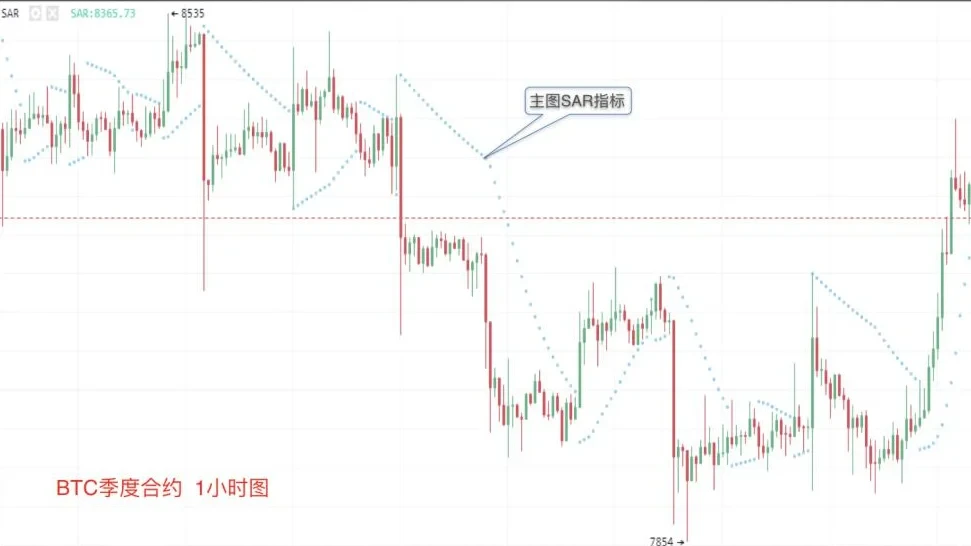
Main-chart SAR indicator: Screenshot from OKX OKX BTC quarterly futures 1-hour chart. The parabolic curve formed by small blue dots is the SAR indicator. Its full English name is "Stop and Reverse," also known in Chinese as the stop-loss point reversal indicator, and is referred to as the parabolic indicator due to its shape. It serves as a supplementary indicator for identifying trend reversals.
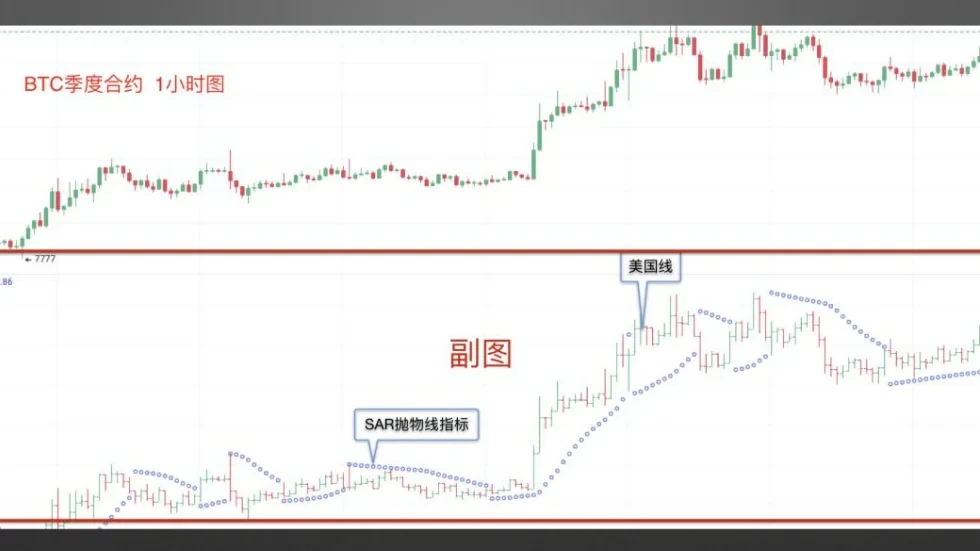
Sub-chart SAR indicator: The screenshot is also from OKX OKX BTC quarterly futures 1-hour chart. The area highlighted in the red box is the sub-chart region. Price markers in this area are called NCW (New Closing bar) or PC (Price Comparison) bars. The parabolic curve running above and below the bar represents the sub-chart SAR indicator.
2. Application Rules for the SAR Indicator
Now that we understand the SAR indicator, how do we use it to identify trend reversals and guide our Trading?
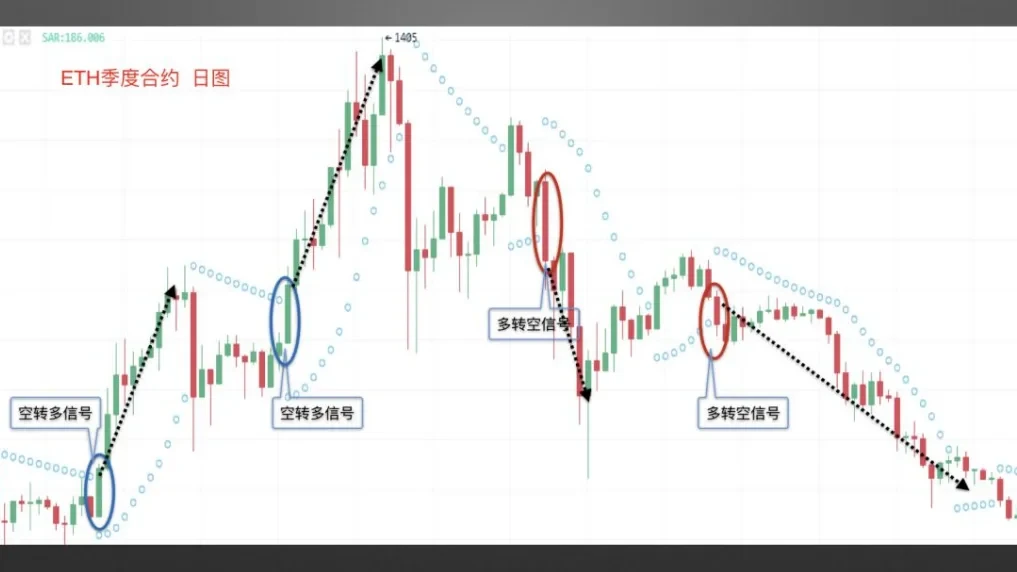
Screenshot from OKX OKX ETH quarterly futures daily chart. When the price candlestick decisively breaks above the SAR indicator positioned above the price, it forms a bearish-to-bullish reversal signal, suggesting a likely upward move ahead. When the price candlestick decisively breaks below the SAR indicator positioned below the price, it forms a bullish-to-bearish reversal signal, suggesting a likely downward move ahead.
Once the reversal signal is confirmed, how do we use the SAR indicator to determine whether the upward or downward trend will continue?
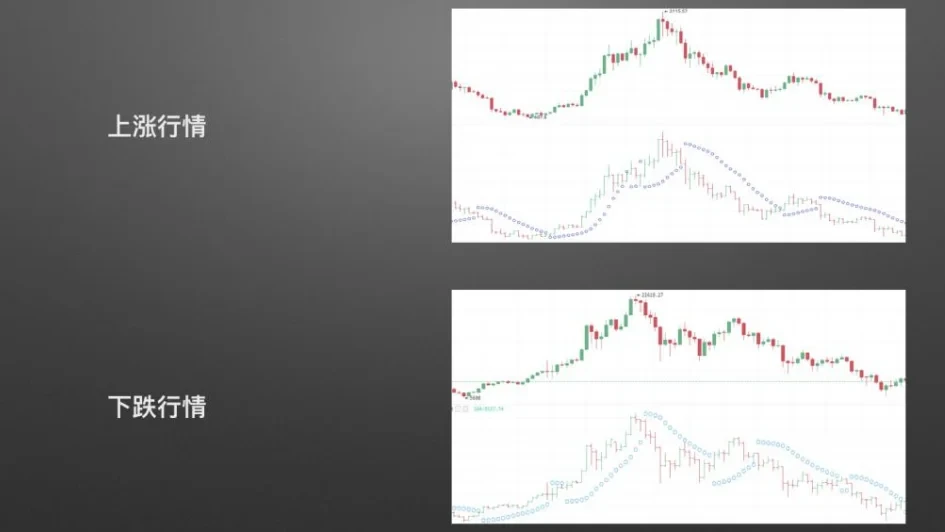
Let's analyze this in the context of both uptrends and downtrends, as illustrated below.
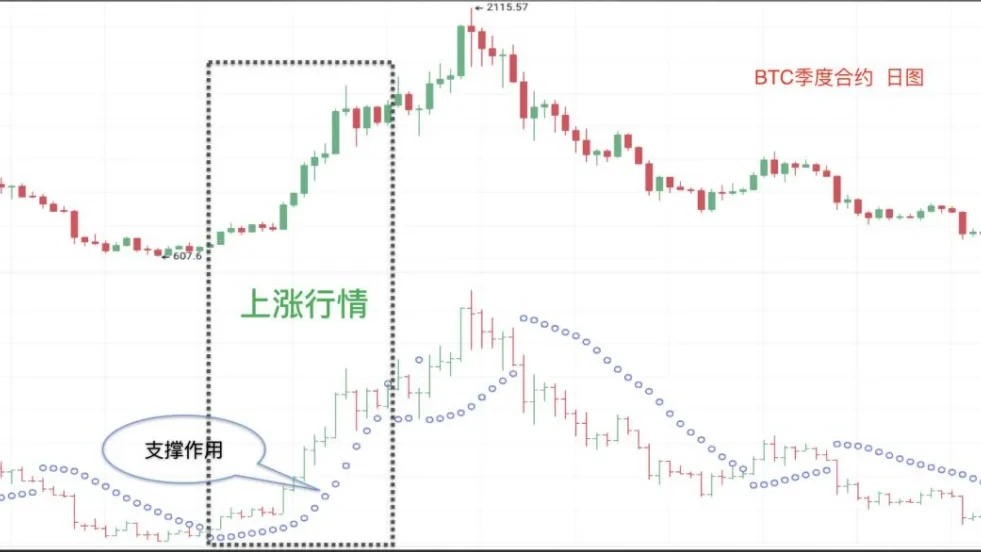
In an uptrend: Screenshot from OKX OKX BTC quarterly futures daily chart. As shown in the area marked by the black dashed box, when the price line runs above the SAR indicator curve, it indicates a bullish trend. At this point, the indicator acts as a support level for the price, propelling it higher and sustaining the upward trend. Investors can continue holding their positions in the short term, until the SAR indicator issues a clear sell signal.
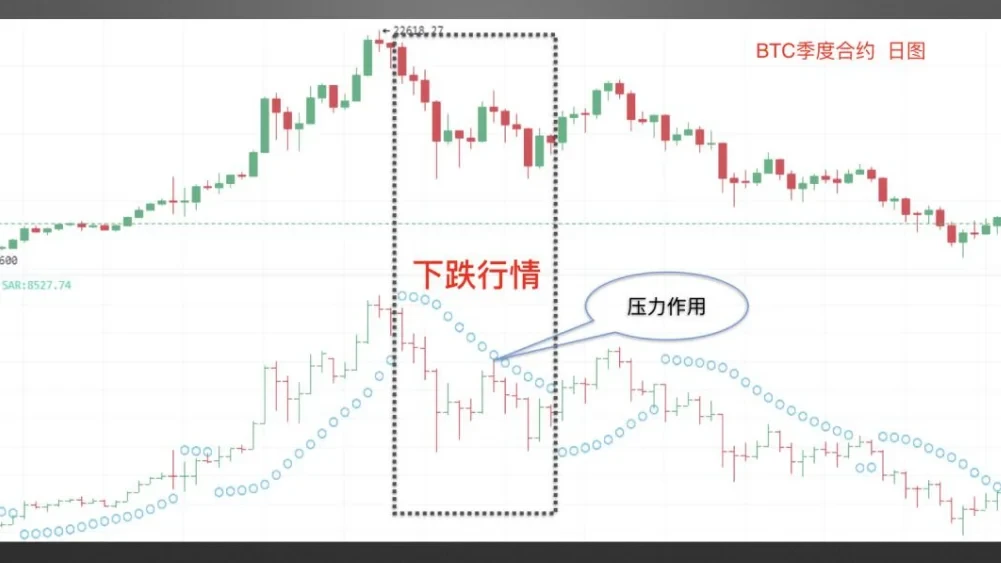
In a downtrend: Screenshot from OKX OKX BTC quarterly futures daily chart. As shown in the area marked by the black dashed box, when the price line runs below the SAR indicator curve, it indicates that the indicator is exerting resistance on the price, pushing it further downward and sustaining the bearish trend. Investors should remain on the sidelines until the SAR indicator issues a clear buy signal.
Finally, let's look at the practical application of the SAR indicator.
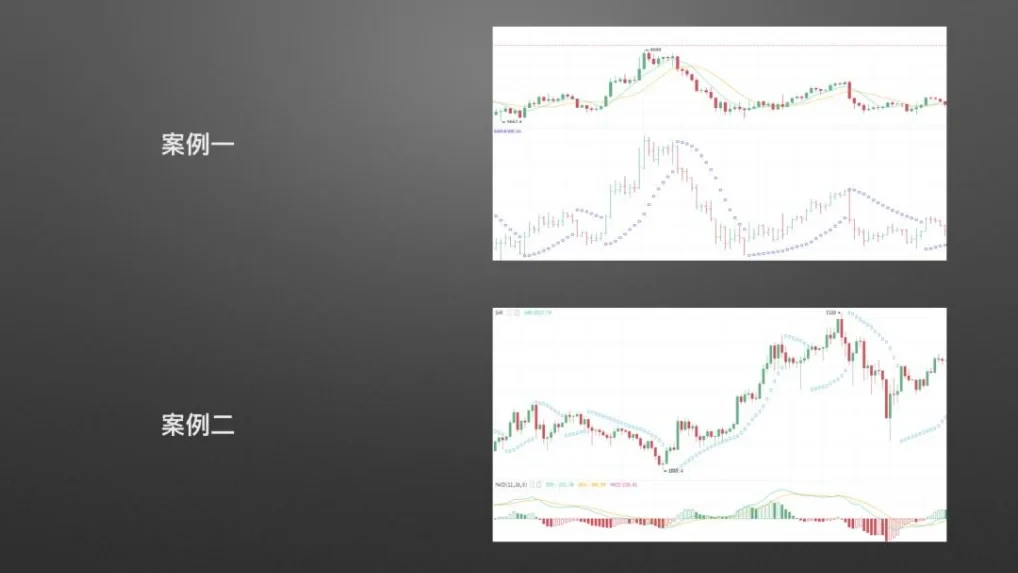
The practical cases are Case 1 and Case 2, as shown below.
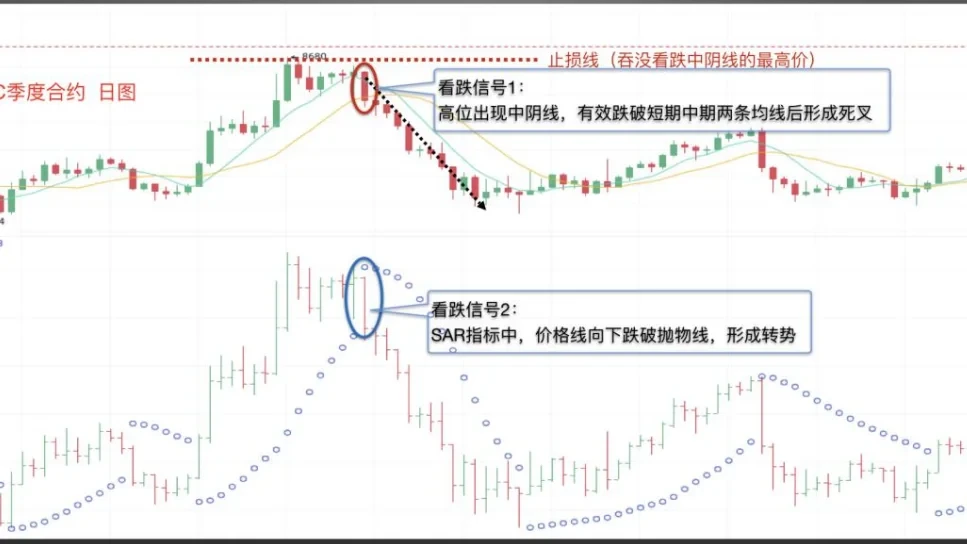
Case 1: Practical application of the SAR indicator combined with two moving averages. Screenshot from OKX OKX BTC quarterly futures daily chart. As the price line runs above the SAR parabolic curve, the price continued to rise. At a high price level, a medium bearish candle formed, breaking below both the short-term and medium-term moving averages and creating a death cross — this constitutes Bearish Signal 1. Simultaneously, on the SAR indicator, the price line dropped below the parabolic curve, forming Bearish Signal 2. The stop-loss can be set at the high of the aforementioned medium bearish candle. The price subsequently declined as expected.
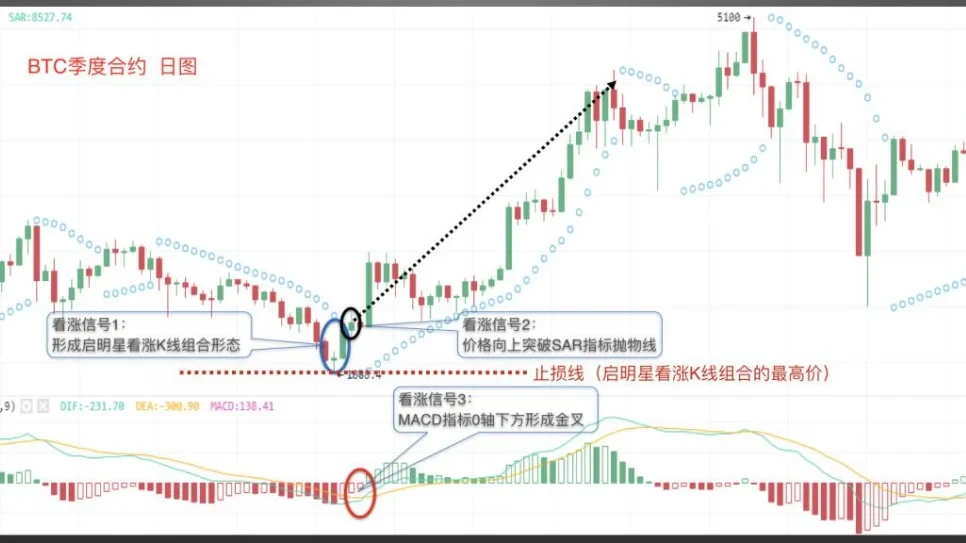
Case 2: Practical application of the SAR indicator combined with candlestick patterns and MACD. Screenshot from OKX OKX BTC quarterly futures daily chart. The price was trading below the SAR indicator, and a morning star bullish candlestick pattern formed at the bottom, creating Bullish Signal 1. The price then broke above the SAR parabolic curve, forming Bullish Signal 2. Additionally, the MACD indicator formed a golden cross below the 0 level, generating Bullish Signal 3. The stop-loss line can be set at the low of the morning star bullish candlestick pattern. The price subsequently rose as expected.
To conclude, here are a few important reminders for Traders using the SAR indicator:
First, while the SAR indicator works well in sustained uptrends or downtrends, it cannot help you buy at the absolute bottom or sell at the absolute top.
Second, the SAR indicator is not suitable for volatile, oscillating markets, as its buy and sell signals become very frequent under such conditions, which can easily lead to losses.
Third, the greater the distance between the SAR indicator and the candlestick, the stronger the current upward or downward trend.
That concludes our discussion of the SAR indicator. In the next lesson, we will cover the TD indicator.
Disclaimer
This article may contain product-related content that does not apply to your region. This article is intended solely to provide general information and makes no representation as to any factual errors or omissions. The views expressed herein are those of the author and do not represent the views of OKX. This article is not intended to provide any advice, including but not limited to: (i) investment advice or investment recommendations; (ii) offers or solicitations to buy, sell, or hold digital assets; or (iii) financial, accounting, legal, or tax advice. Holding digital assets (including stablecoins) involves a high level of risk and prices may fluctuate significantly, potentially to the point of becoming worthless. You should carefully consider whether trading or holding digital assets is appropriate for you based on your financial situation. For questions specific to your circumstances, please consult your legal/tax/investment professional. Any information provided in this article (including market data and statistics, where applicable) is for general reference purposes only. While we have taken all reasonable precautions in preparing such data and charts, we make no representations and accept no responsibility for any factual errors or omissions expressed herein. © 2025 OKX. This article may be reproduced or distributed in its entirety or in excerpts of 100 words or less, provided that such use is non-commercial in nature. Any reproduction or distribution of the full article must also include the following attribution: "This article is copyrighted © 2025 OKX, used with permission." Permitted excerpts must cite the article title and include the source, for example: "Article title, [author name (if applicable)], © 2025 OKX". Some content may have been generated or assisted by artificial intelligence (AI) tools. Derivative works and other uses of this article are not permitted.
Show More
Recommended Reading

Can You Profit from Bitcoin's Decline? How to Trade Futures
As the cryptocurrency market, led by Bitcoin, continues to expand, derivatives trading has emerged alongside spot trading as a diverse range of trading tools, serving as a hedge against risk. Among these, futures trading has attracted the most attention. What are futures? Futures are the most common form of trading contract in the cryptocurrency derivatives market. Digital assets futures trading refers to an agreement between a buyer and a seller to trade a specific asset at a predetermined price at a future date.
January 16, 2026

Even Simpler Than Copy Trading? One-Click Copy the Top Traders on OKX and Let Them Earn for You
Whether in traditional finance or the cryptocurrency market, copy trading is a crucial and key component of the trading ecosystem. When facing complex trading conditions and extreme market volatility, even those with solid theoretical knowledge and extensive trading experience can easily miss trading opportunities or make poor decisions driven by emotion. Copy trading is precisely the tool that can solve these problems. Now that you have the trading tools, how do you make the most of
November 21, 2025

5. Copy Trading Series — Cost-Averaging Tool
Preface: We often wonder: in a bull market, there are many digital assets that surge dramatically. If we could consistently capture coins with the largest gains — say, one that doubles every month — over a year your assets would grow to 2 to the power of 12, which is 4,096 times your initial investment. That is staggering, though of course nearly impossible to achieve, as it is incredibly difficult to consistently catch coins that surge in value. This is a common challenge many users face: in a bull market, although
November 3, 2025

Which Countries/Regions Do Not Support Registration on OKX
OKX currently does not provide services to customers from the following regions: certain U.S. territories, such as New York, Texas, Puerto Rico, American Samoa, Guam, the Commonwealth of the Northern Mariana Islands, the U.S. Virgin Islands (St. Croix, St. John, and St. Thomas), Cuba, Iran, North Korea, Crimea, Malaysia, Syria, Bangladesh, and Bolivia. For more details, please refer to the OKX Terms of Service.
April 25, 2024

Quick Guide to OKX's Common Products and Features
OKX (www. okx. com) is one of the world's leading digital assets service platforms, primarily serving global users by offering
Trading services for Bitcoin, Ethereum, and other digital assets in both spot and derivatives markets, while also exploring the world of DeFi, dApps, NFTs, and GameFi together with its users. On OKX, you can enjoy seamless spot and futures trading experiences, stay updated on tokens in trending sectors and concepts, and much more.April 25, 2024

Zero-Basics Guide to Candlestick Patterns | 5 The Importance of Candlestick Pattern Application
Trends drive price movements — learn to read what the market is saying; Signals guide your entries and exits — stop trading on instinct. 1. Key Levels for Bullish Candlestick Patterns In the first two installments of this chapter, we covered bullish and bearish candlestick patterns. However, these patterns are not effective in every situation. In this section, we will discuss why the location where a pattern appears matters so much. Where do bullish patterns work best? First scenario: Near the end of a clear uptrend, when a
April 25, 2024


