
Learn Candlestick Charts from Scratch | 27 Common Analysis Indicators 9 — OKX Trading Big Data Indicators
Price movements have trends; understand the language of prices;
Buy and sell have signals; say goodbye to intuitive Trading.
I. OKX Trading Big Data Indicators
First, let's see what OKX Trading big data indicators are available?
In OKX contracts, commonly used Trading data indicators include the long/short position ratio, contract basis, total open interest and Trading volume, aggressive buying/aggressive selling, and the long/short elite trend indicator, among others.
1) Long/Short Position Ratio
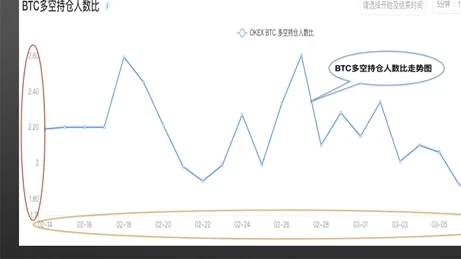
Screenshot from OKX BTC long/short position ratio diagram. The horizontal axis represents dates, the vertical axis represents the long/short position ratio, and the blue curve shows the trend of the daily long/short position ratio at different times. This refers to the ratio of the total number of people holding BTC contract long positions to the total number of people holding short positions over a period of time. Longs represent those who are bullish, and shorts represent those who are bearish. More longs than shorts indicates more people are bullish; more shorts than longs indicates more people are bearish.
So what is the relationship between the long/short position ratio indicator and price?
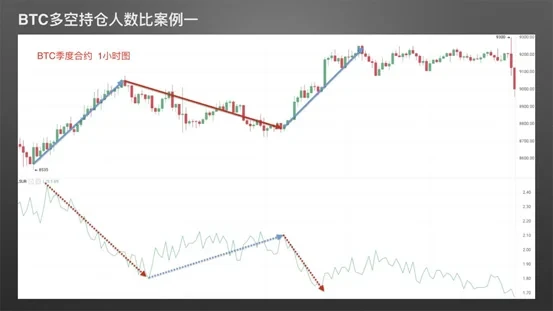
BTC long/short position ratio case 1: Screenshot from OKX BTC quarterly contract 1-hour chart. We can see that when the coin price rises, the long/short position ratio continuously decreases; when the coin price falls, the long/short position ratio continuously increases. At this time, the coin price and the long/short position ratio indicator show a negative correlation.
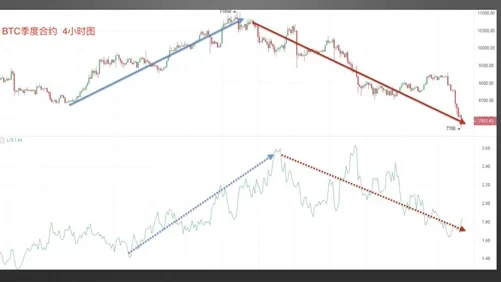
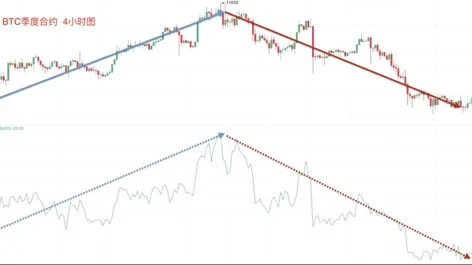
BTC long/short position ratio case 2: Screenshot from OKX BTC quarterly contract 4-hour chart. We can see that when the coin price rises, the long/short position ratio continuously increases; when the coin price falls, the long/short position ratio continuously decreases. At this time, the coin price and the long/short position ratio indicator show a positive correlation.
Special precautions for using the long/short position ratio indicator:
In different timeframes, the long/short position ratio indicator and coin price trends may show different correlations;
The correlation between the long/short position ratio and coin price is not absolute and exists with a certain probability.
2) Contract Basis
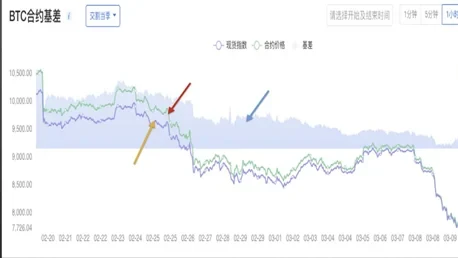
Screenshot from OKX BTC contract basis diagram. In the diagram, the blue curve indicated by the yellow arrow represents the spot index, and the green curve indicated by the red arrow represents the contract price. The blue area indicated by the blue arrow in the diagram is the BTC contract basis. Contract basis refers to the changes in the spot index price and contract price at the same moment, as well as their difference. Since contract prices are more sensitive to market supply and demand changes or news than spot prices, although the trends are the same, there are differences in their movements.

How to observe the changes in contract basis?
BTC contract basis indicator case: Screenshot from OKX BTC quarterly contract 4-hour chart. From the diagram, we can see that when the basis increases, the coin price rises; when the basis decreases, the coin price falls. The basis trend basically maintains consistency with the coin price trend, showing a positive correlation between the two.
3) Total Contract Open Interest and Trading Volume
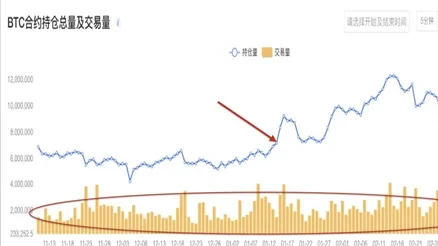
Screenshot from OKX BTC contract total open interest and Trading volume diagram. The blue curve indicated by the red arrow is the BTC contract total open interest trend chart. Total open interest represents the sum of long and short positions for delivery and perpetual contracts of that coin at the corresponding moment. The yellow bar chart below shows the changes in BTC contract Trading volume. Trading volume represents the total Trading volume of delivery and perpetual contracts of that coin within a unit of time.
So what is the relationship between total contract open interest and coin price rises and falls?
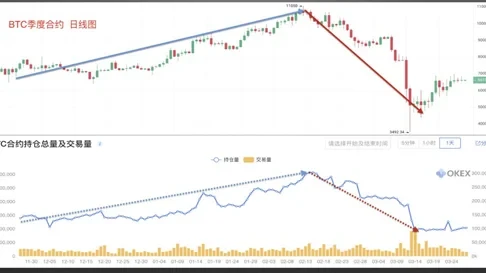
BTC quarterly contract total open interest and Trading volume practical case: Screenshot from OKX BTC quarterly contract daily chart. From the diagram, we can see that the total contract open interest trend chart below basically maintains consistency with the coin price trend above. When total contract open interest gradually increases, the coin price continues to rise; conversely, when total contract open interest continuously decreases, the coin price continues to fall. Overall, they show a positive correlation relationship of rising and falling together.
4) Aggressive Buying and Selling
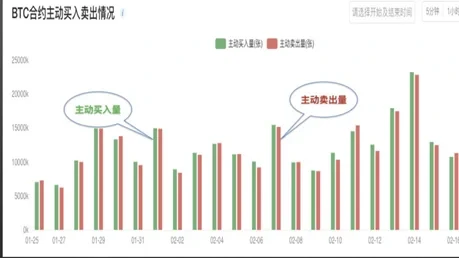
Screenshot from OKX BTC contract daily aggressive buying and selling diagram. The green bars represent the daily aggressive buying volume of BTC contracts, which is actually commonly referred to as Funds inflow, referring to the transaction value of aggressive buy orders within a unit of time. The red bars represent the daily aggressive selling volume of BTC contracts, which is commonly referred to as Funds outflow, referring to the transaction value of aggressive sell orders within a unit of time. Generally, within a unit of time, when aggressive buying exceeds aggressive selling, it indicates high market sentiment for active buying and prices rise; when aggressive selling exceeds aggressive buying, it indicates increased bearish market sentiment and prices fall.
How to judge market rises and falls through aggressive buying and selling volume?
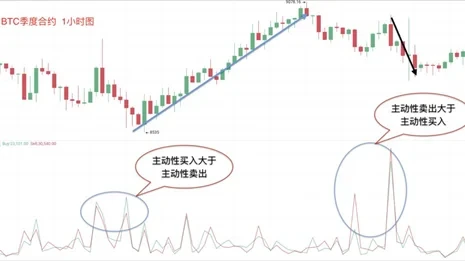
BTC contract aggressive buying and selling volume indicator case: Screenshot from OKX BTC quarterly contract 1-hour chart. When aggressive buying volume and aggressive selling volume both expand simultaneously, it indicates that the market will have unusual movements. When there are at least two consecutive signals where aggressive buying volume exceeds aggressive selling, it indicates continuous net inflow of Funds and increased probability of market rises. When there are at least two consecutive signals where aggressive selling volume exceeds aggressive buying, it indicates continuous net outflow of Funds and increased probability of market falls.
5) OKX Long/Short Elite Trend Indicator
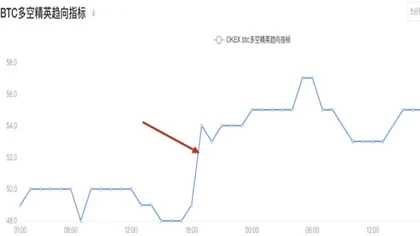
Screenshot from OKX BTC contract long/short elite trend indicator 1-hour diagram. The blue curve indicated by the red arrow in the diagram is the BTC contract long/short elite trend indicator chart. This indicator reflects the long/short ratio of net positions (i.e., net positions) of the top hundreds of elite trader accounts in the holdings ranking.
How to judge the market through the long/short elite trend indicator?
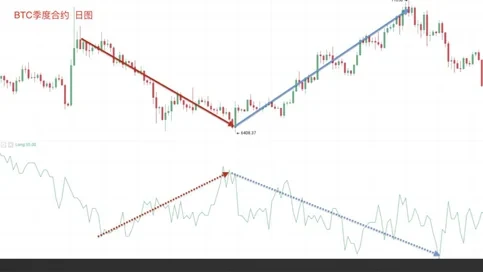
BTC contract long/short elite trend indicator case: Screenshot from OKX BTC quarterly contract daily chart. We can see that when the coin price falls, the long/short elite trend indicator continuously increases; when the coin price rises, the long/short elite trend indicator continuously decreases. Based on experience, the coin price and the long/short elite trend indicator show a negative correlation in most cases.
Disclaimer
This article may contain product-related content that is not applicable to your region. This article is intended to provide general information only and does not assume responsibility for any factual errors or omissions therein. This article represents only the author's personal views and does not represent the views of OKX. This article is not intended to provide any advice, including but not limited to: (i) investment advice or investment recommendations; (ii) offers or solicitations to buy, sell, or hold digital assets; or (iii) financial, accounting, legal, or tax advice. Holding digital assets (including stablecoins) involves high risk, may fluctuate significantly, and may even become worthless. You should carefully consider whether Trading or holding digital assets is suitable for you based on your financial situation. For questions regarding your specific situation, please consult your legal/tax/investment professional. The information appearing in this article (including market data and statistics, if any) is for general reference only. Although we have taken all reasonable precautions in preparing these data and charts, we assume no responsibility for any factual errors or omissions expressed herein. © 2025 OKX. This article may be reproduced or distributed in its entirety, or excerpts of 100 words or less from this article may be used, provided that such use is non-commercial. Any reproduction or distribution of the entire article must also prominently state: "This article is copyrighted © 2025 OKX, used with permission." Permitted excerpts must cite the article name and include the source, for example "Article Name, [Author Name (if applicable)], © 2025 OKX". Some content may be generated or assisted by artificial intelligence (AI) tools. Derivative works or other uses of this article are not permitted.
Show More
Recommended Reading

Profit Even When Bitcoin Falls? How to Conduct Contract Trading
With the continuous expansion of the cryptocurrency market represented by Bitcoin, various forms of derivative trading have gradually emerged beyond spot trading as a tool to hedge risk. Among them, contract trading has received the most attention. What is contract trading? Contracts are the most common trading contract form in the cryptocurrency derivatives market. Digital assets contract trading refers to buyers and sellers agreeing to trade certain assets at a specified price at a future time.
January 16, 2026

Simpler Than Copy Trading? One-Click Follow Top Strategy Traders on OKX, Let Traders Earn Money for You
Whether in traditional finance or the cryptocurrency market, strategy trading is a very important and crucial method in the trading system. When facing complex trading environments and extreme market conditions, even with solid theoretical technical knowledge and rich trading experience, it is easy to miss trading opportunities or make wrong judgments and operations due to emotional influence. Strategy trading is precisely an effective tool that can solve these problems. Now that you have trading tools, how do you use
November 21, 2025

V. Strategy Trading Series Courses — Savings
Preface: We often have such speculation: In bull markets, there are many digital assets with significant gains. If we can continuously capture coins with large increases, for example, capturing a doubled digital asset every month, after one year your assets will become 2 to the power of 12, that is, 4096 times, which is very amazing. Of course, this is also almost an impossible task to complete, because it is difficult for us to continuously catch coins with large increases. This is also a problem many users encounter: In bull markets, although
November 3, 2025

Which Countries/Regions Do Not Support Registration to Use OKX
OKX currently does not provide services to customers in the following regions: certain U.S. territories, such as New York, Texas, Puerto Rico, American Samoa, Guam, Commonwealth of the Northern Mariana Islands, U.S. Virgin Islands (St. Croix, St. John, and St. Thomas), Cuba, Iran, North Korea, Crimea, Malaysia, Syria, Bangladesh, and Bolivia. For details, please refer to the OKX Terms of Service.
April 25, 2024

Quickly Understand OKX Common Products and Features
OKX (www. okx. com) is one of the globally renowned digital asset service platforms, primarily providing global users with Bitcoin, Ethereum, and other digital asset spot and derivative trading services, while also exploring the world of DeFi, dApps, NFTs, and GameFi together with users. On OKX, you can enjoy smooth trading experiences such as spot and contracts, keep up to date with token information in hot areas/concepts, and also
April 25, 2024

Learn Candlestick Charts from Scratch | 5 Importance of Candlestick Pattern Applications
Price movements have trends; understand the language of prices. Buy and sell have signals; say goodbye to intuitive trading. I. Bullish Candlestick Combinations at Key Positions. In the first two sections of this chapter, we explained the applications of bullish and bearish candlestick combinations, but these combinations are not effective when they appear at any position. In this section, we will explain the importance of where combinations appear. In which positions can bullish combinations better play their role? The first situation: In a clear upward trend, near the previous
April 25, 2024


