Learn Candlestick Charts from Zero | 28 Common Analysis Indicators 10—Multi-Indicator Comprehensive Practical Application
Trends have ups and downs, understand the language of prices;
Buy and sell have signals, say goodbye to intuitive Trading.
I. Comprehensive Practical Application of Single Indicators
In the first part, we will look at the practical application of single indicator resonance across different timeframes.
Now let's examine two real cases, as shown in the figures below.

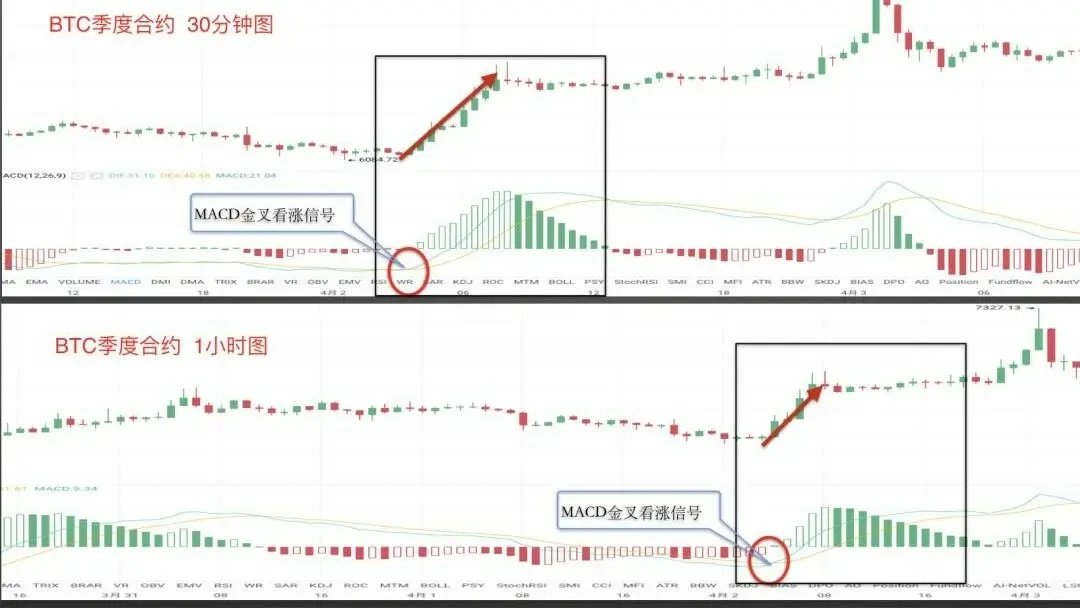
Case 1 shows the practical application of MACD indicator resonance across different timeframes. The top screenshot is from OKX BTC quarterly futures 30-minute chart, and the bottom screenshot is from OKX BTC quarterly futures 1-hour chart. The black box areas show the resonance of MACD at adjacent time points across different timeframes. When MACD forms golden crosses across different timeframes, this serves as a dual bullish signal, and subsequently the price begins to rise.
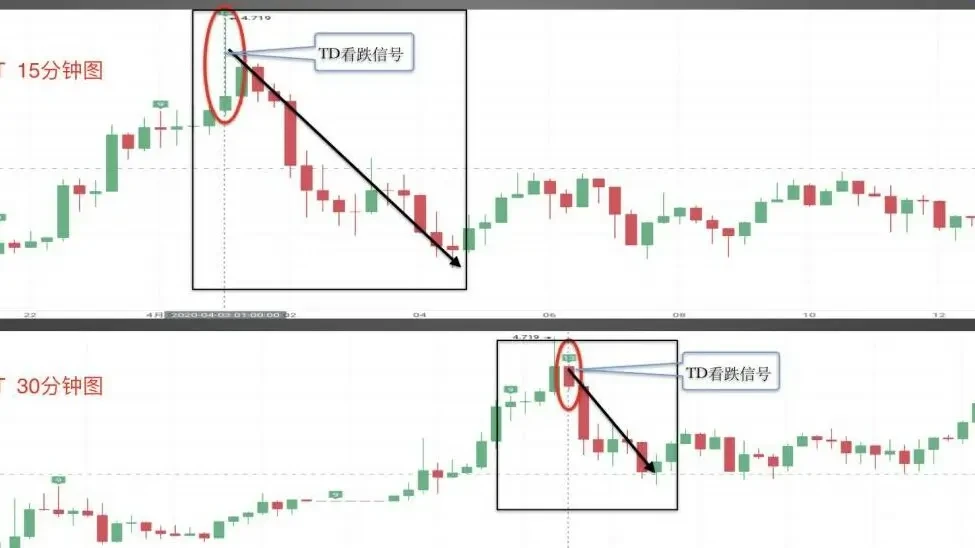
Case 2 shows the practical application of TD indicator resonance across different timeframes. The top screenshot is from OKX OKB/USDT 15-minute chart, and the bottom screenshot is from OKX OKB/USDT 30-minute chart. The black box areas show the resonance of TD indicator at adjacent time points across different timeframes. When the TD indicator shows green sequence 13 across different timeframes, this serves as a dual bearish signal, and subsequently the price begins to fall.
II. Practical Application of Two-Indicator Resonance
First, let's look at the practical application of two-indicator resonance.
Now let's continue examining several real cases.
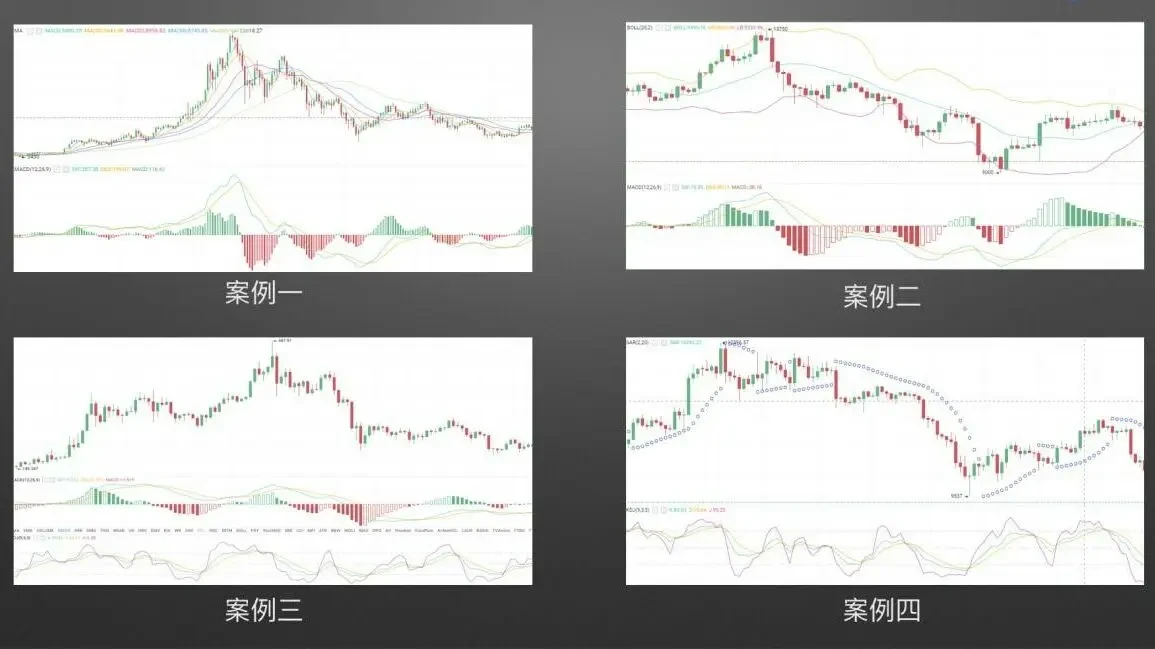
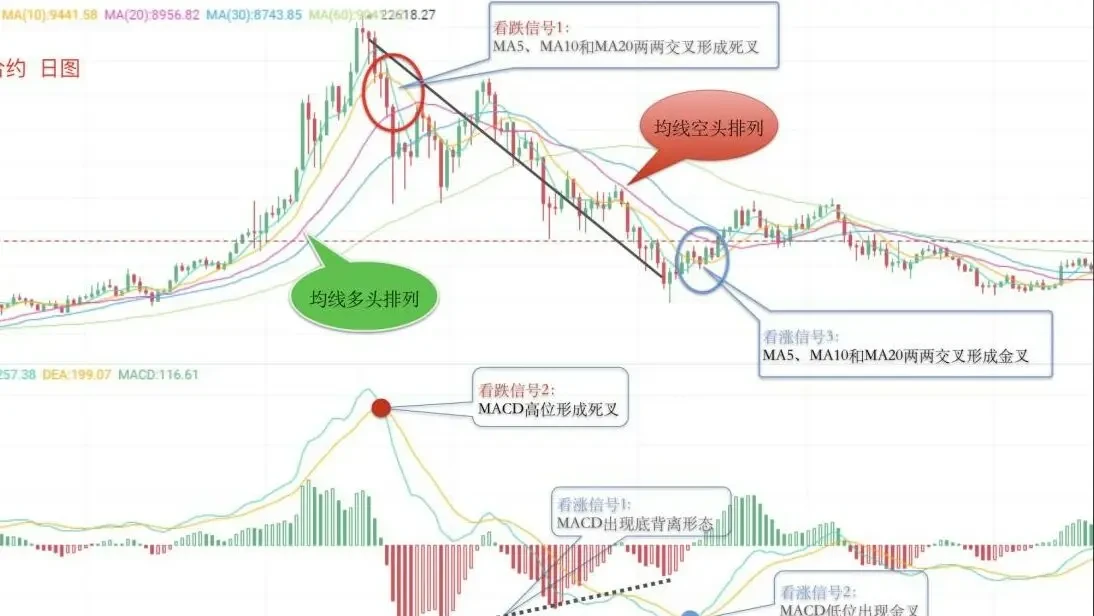
Case 1 shows the comprehensive application of moving averages and MACD indicator. The screenshot is from OKX BTC quarterly futures daily chart. Initially, the moving averages are in bullish arrangement, and the price runs upward along the moving average system. When MA5, MA10, and MA20 cross each other forming death crosses, bearish signal 1 appears; and the MACD indicator forms a death cross, appearing as bearish signal 2. Subsequently, the price continues to fall and constantly hits new lows. The moving average system shows bearish arrangement, while the MACD indicator histogram bottoms show successive increases, forming bullish divergence with the price. This is bullish signal 1; when the MACD indicator shows a golden cross, this is bullish signal 2; and when MA5, MA10, and MA20 cross each other forming golden crosses, this is bullish signal 3.
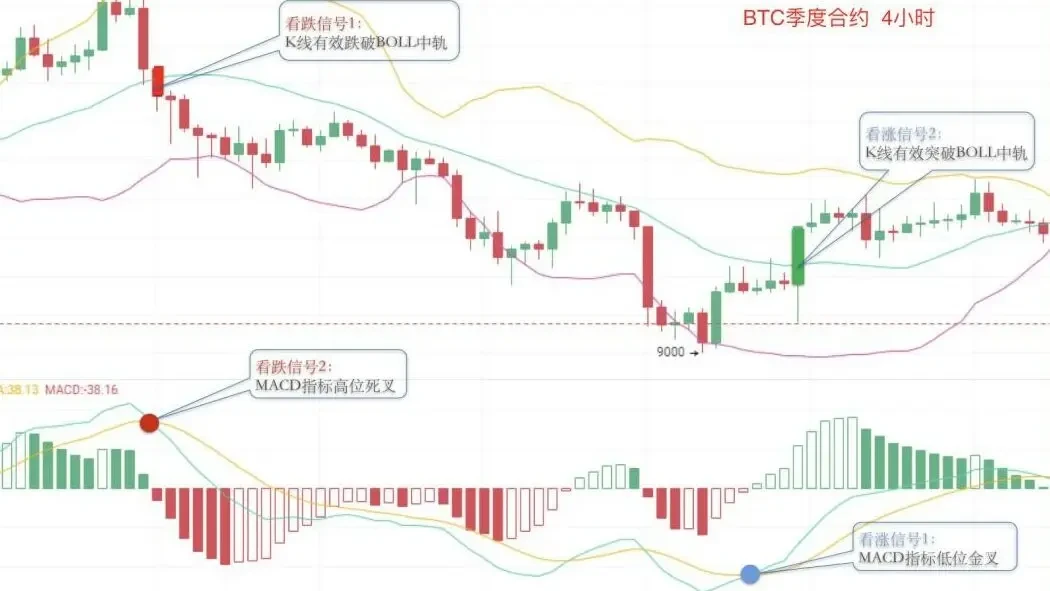
Case 2 shows the comprehensive application of BOLL and MACD indicators. The screenshot is from OKX BTC quarterly futures 4-hour chart. When the candlestick effectively breaks below the BOLL middle band, forming bearish signal 1; and the MACD indicator forms a death cross at high levels, appearing as bearish signal 2. Subsequently, the price runs below the BOLL middle band, continuing the downtrend; when the MACD indicator forms a golden cross at low levels, this is bullish signal 1; subsequently, a medium bullish candlestick effectively breaks through the BOLL middle band, appearing as bullish signal 2.
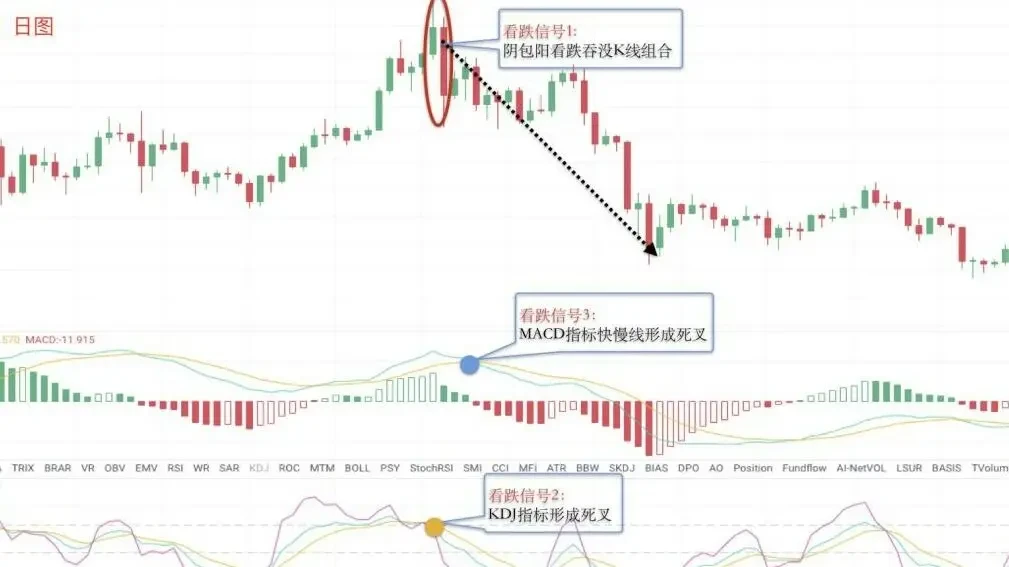
Case 3 shows the comprehensive application of MACD, KDJ indicators, and bearish engulfing candlestick combination. The screenshot is from OKX ETH quarterly futures daily chart. When a bearish engulfing candlestick combination of yang wrapped by yin appears at high levels, this is bearish signal 1; simultaneously, the KDJ indicator forms a death cross, this is bearish signal 2; subsequently, the MACD indicator fast and slow lines also form a death cross, this is bearish signal 3. Afterward, the price begins to fall.
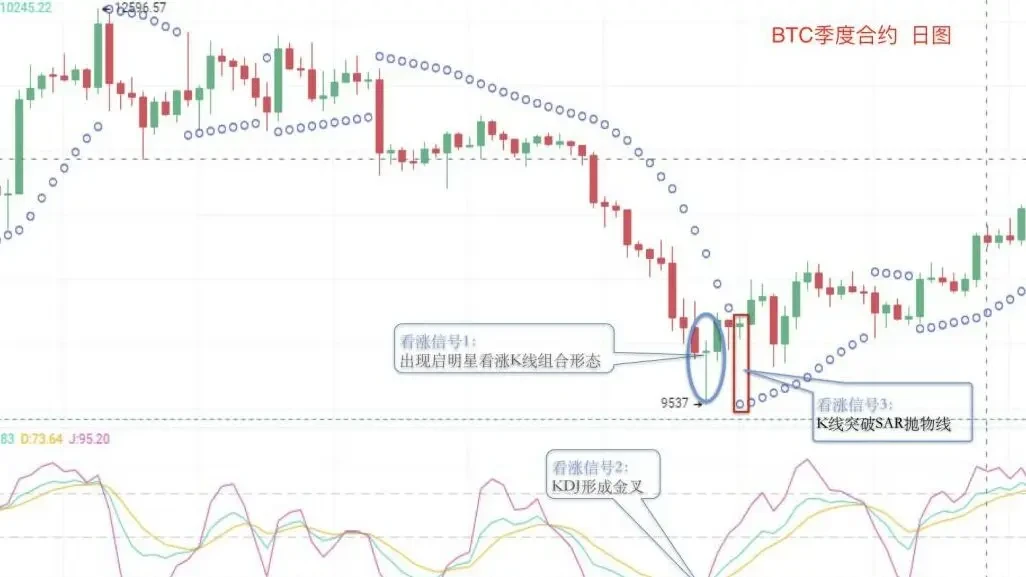
Case 4 shows the comprehensive application of SAR, KDJ indicators, and Morning Star bullish candlestick combination. The screenshot is from OKX BTC quarterly futures daily chart. As shown in the figure, when the Morning Star bullish candlestick pattern appears at the bottom, this is bullish signal 1; simultaneously, the KDJ indicator forms an upward golden cross, appearing as bullish signal 2; subsequently, when the price breaks through and stands above the SAR parabolic indicator, this is bullish signal 3.
III. Comprehensive Application of Three-Indicator Resonance
Now let's examine several more real cases.

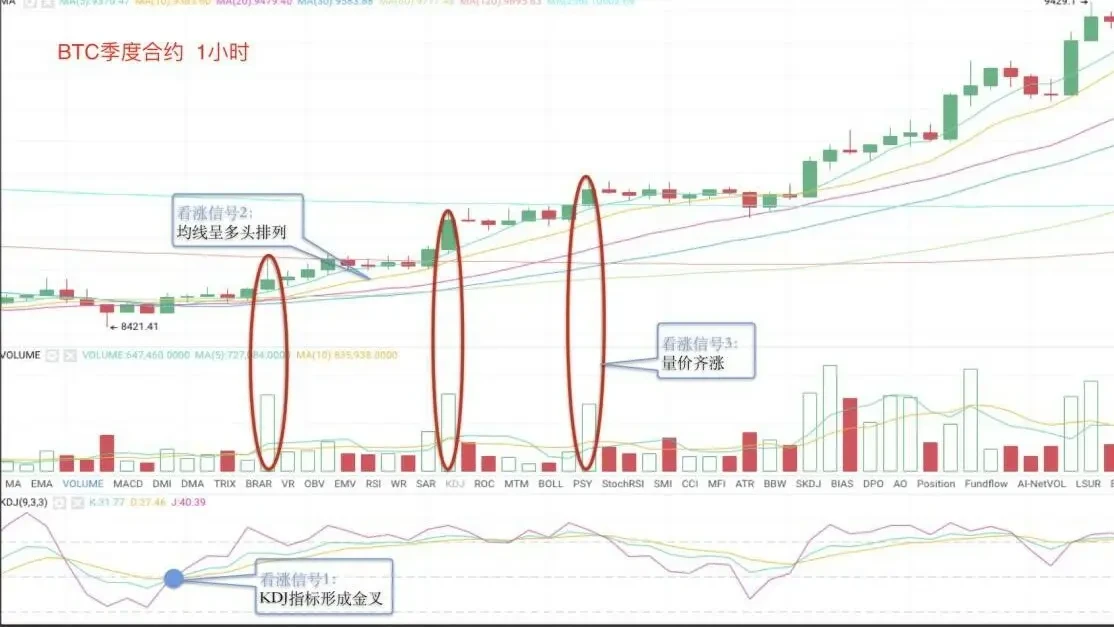
Case 1 shows the comprehensive application of moving averages, volume, and KDJ indicator. The screenshot is from OKX BTC quarterly futures 1-hour chart. When KDJ forms a golden cross, bullish signal 1 appears; afterward, the moving average system shows upward bullish arrangement, and the price runs above the moving averages, this is bullish signal 2; subsequently, each volume expansion serves as bullish signal 3, driving further price increases.
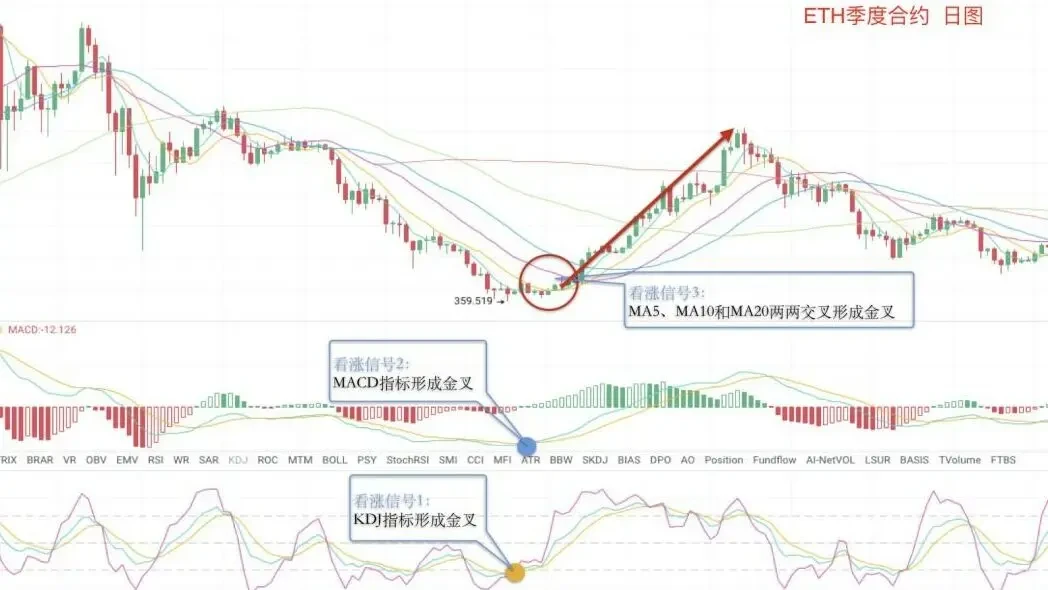
Case 2 shows the comprehensive application of moving averages, MACD, and KDJ indicators. The screenshot is from OKX ETH quarterly futures daily chart. As shown in the figure, when the KDJ indicator below forms a golden cross, this is bullish signal 1; next, the MACD indicator also shows a golden cross, this is bullish signal 2; subsequently, when MA5, MA10, and MA20 cross each other forming golden crosses, this is buy signal 3, and then the price begins an upward trend.
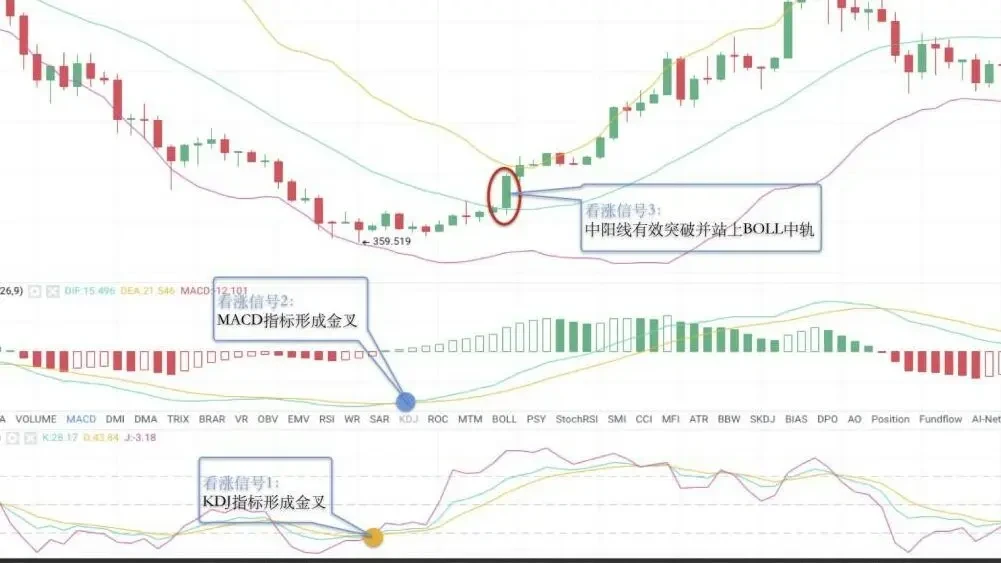
Case 3 shows the comprehensive application of BOLL, MACD, and KDJ indicators. The screenshot is from OKX ETH quarterly futures daily chart. When the KDJ indicator below forms a golden cross, this is bullish signal 1; next, the MACD indicator also shows a golden cross, this is bullish signal 2; subsequently, a medium bullish candlestick effectively breaks through and stands above the BOLL middle band, this is bullish signal 3.
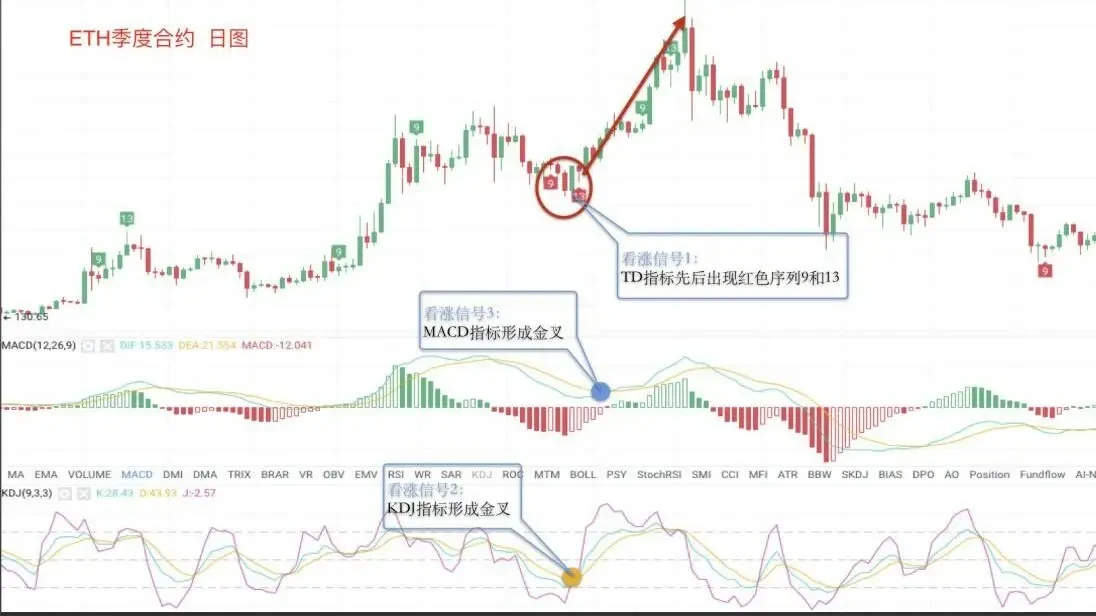
Case 4 shows the comprehensive application of TD indicator, MACD, and KDJ indicators. The screenshot is from OKX ETH quarterly futures daily chart. When the TD indicator successively shows red sequence 9 and 13, this is bullish signal 1; simultaneously, the KDJ indicator below shows a golden cross, this is bullish signal 2; next, the MACD indicator also shows a golden cross, this is bullish signal 3. Subsequently, the price begins an upward trend.
Finally, we offer several special reminders regarding the use of indicators:
First, any technical indicator has varying degrees of lag in market judgment;
Second, technical indicators should only be used as auxiliary tools for market judgment;
Third, the more indicators combined, the lower the probability of resonance occurrence.
Disclaimer
This article may contain product-related content not applicable to your region. This article is intended to provide general information only and does not accept responsibility for any factual errors or omissions contained herein. This article represents only the author's personal views and does not represent the views of OKX. This article is not intended to provide any of the following advice, including but not limited to: (i) investment advice or investment recommendations; (ii) offers or solicitations to buy, sell, or hold digital assets; or (iii) financial, accounting, legal, or tax advice. Holding digital assets (including stablecoins) involves high risk, may fluctuate significantly, and may even become worthless. You should carefully consider whether trading or holding digital assets is suitable for you based on your financial situation. For questions regarding your specific situation, please consult your legal/tax/investment professional. The information appearing in this article (including market data and statistics, if any) is for general reference only. Although we have taken all reasonable precautions in preparing these data and charts, we accept no responsibility for any factual errors or omissions expressed herein. © 2025 OKX. This article may be reproduced or distributed in its entirety, or excerpts of 100 words or less from this article may be used, provided that such use is non-commercial. Any reproduction or distribution of the entire article must also prominently state: "Copyright © 2025 OKX. Used with permission." Permitted excerpts must cite the article title and include attribution, such as "Article Name, [Author Name (if applicable)], © 2025 OKX". Portions of this content may be generated or assisted by artificial intelligence (AI) tools. Derivative works or other uses of this article are not permitted.
Show More
Recommended Reading

Profit Even When Bitcoin Drops? How to Conduct Futures Trading
As the cryptocurrency market scale represented by Bitcoin continues to expand, various forms of derivatives trading have gradually emerged beyond spot trading as tools to hedge risk, with futures trading receiving the most attention. What is futures trading? Futures are the most common trading contract form in the cryptocurrency derivatives market. Digital assets futures trading refers to buyers and sellers agreeing to trade certain assets at a specified price at a future time.
January 16, 2026

Simpler Than Copy Trading Strategies? One-Click Copy Top Strategy Traders on OKX, Let Traders Earn Money for You
Whether in traditional finance or the cryptocurrency market, strategy trading is a very important and crucial method in the trading system. When facing complex trading environments and extreme market conditions, even with solid theoretical knowledge and extensive trading experience, it's easy to miss trading opportunities or make wrong judgments and operations influenced by emotions. Strategy trading is precisely an effective tool that can solve these problems. Now that you have the trading tools, how do you use them
November 21, 2025

Five, Strategy Trading Series Course—Earn Savings
Preface: We often have such speculation: In bull markets, there are many digital assets with significant gains. If we can continuously capture assets with large increases, for example, catching one digital asset that doubles every month, after one year your assets would become 2 to the power of 12, that is, 4096 times, which is very amazing. Of course, this is also almost an impossible task to complete, because it's difficult for us to continuously catch surging assets. This is also a problem many users encounter: In bull markets, although
November 3, 2025

Which Countries/Regions Do Not Support Registration to Use OKX
OKX currently does not provide services to customers in the following regions: certain US territories, such as New York, Texas, Puerto Rico, American Samoa, Guam, Commonwealth of the Northern Mariana Islands, US Virgin Islands (St. Croix, St. John, and St. Thomas), Cuba, Iran, North Korea, Crimea, Malaysia, Syria, Bangladesh, and Bolivia. For details, please refer to the OKX Terms of Service.
April 25, 2024

Quickly Understand OKX Common Products and Features
OKX (www.okx.com) is one of the world's famous digital assets service platforms, mainly providing global users with Bitcoin, Ethereum, and other digital assets spot and derivatives trading services, while also exploring the world of DeFi, dApps, NFTs, and GameFi together with users. On OKX, you can enjoy smooth trading experiences such as spot and futures, keep up-to-date with token information in hot areas/concepts, and also
April 25, 2024

Learn Candlestick Charts from Zero | 5 Importance of Candlestick Pattern Applications
Trends have ups and downs, understand the language of prices; buy and sell have signals, say goodbye to intuitive trading. I. Bullish Candlestick Combinations at Key Positions In the first two sections of this chapter, we explained the applications of bullish and bearish candlestick combinations, but these combinations are not effective when appearing at any position. In this section, we will explain the importance of where combinations appear. In which positions can bullish combinations better play their role? The first situation: In a clear uptrend, near the previous
April 25, 2024


