
10 Essential Crypto Analysis Indicators (Part 2)
The article "10 Essential Crypto Analysis Indicators (Part 1)" introduced four essential crypto analysis metrics: Bitcoin UTXO Age Distribution, Bitcoin Rainbow Chart, S2F Price Model, and the arh999 Fixed Investment Index. Among these, Bitcoin UTXO Age Distribution presents on-chain activity through UTXO distribution statistics; the Bitcoin Rainbow Chart clearly identifies Bitcoin prices at different stages; the S2F Price Model measures Bitcoin scarcity and predicts medium-to-long-term prices; and the arh999 Fixed Investment Index delineates fixed investment zones and capitulation bottoms.
This article continues with six additional crypto indicators: the Altseason Index, RHODL Ratio, Jiang Zhuoer's 60-Day Cumulative Market Cap Increase, Whale Holdings Change, CFTC Asset Manager Position Trends, and Bitcoin Halving.
These indicators capture the pulse of the entire industry from both macro and micro perspectives. Through these metrics, users can significantly lower the barrier to industry understanding while gaining valuable references for crypto activities.
5. Altseason Index
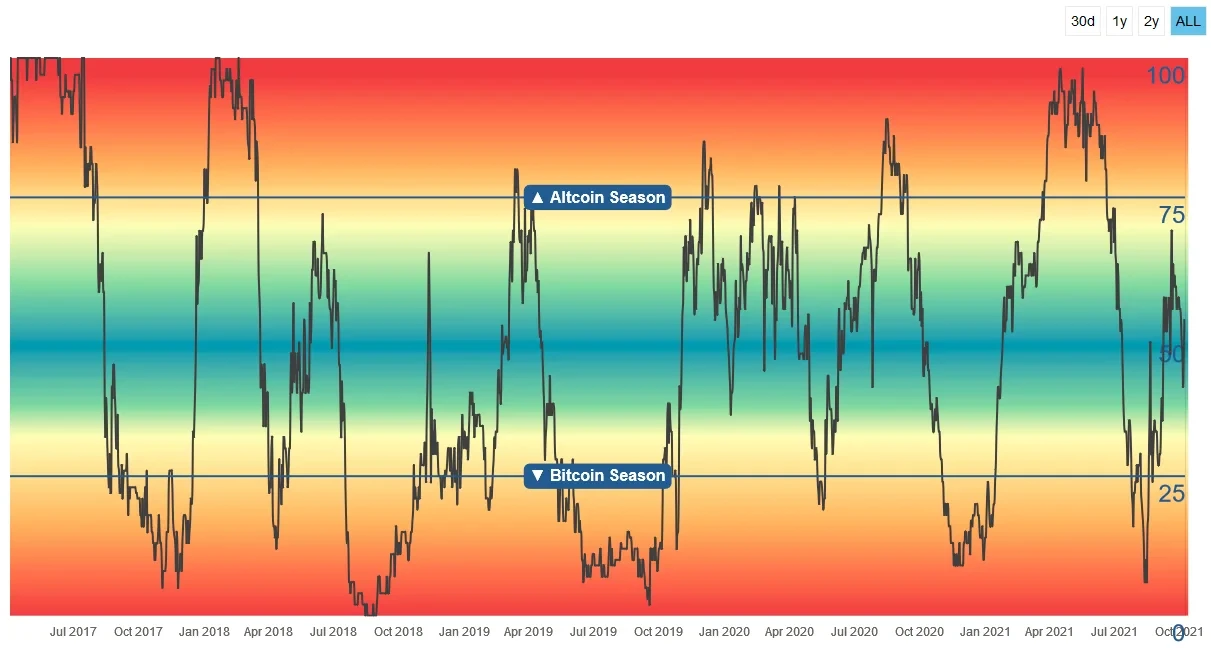
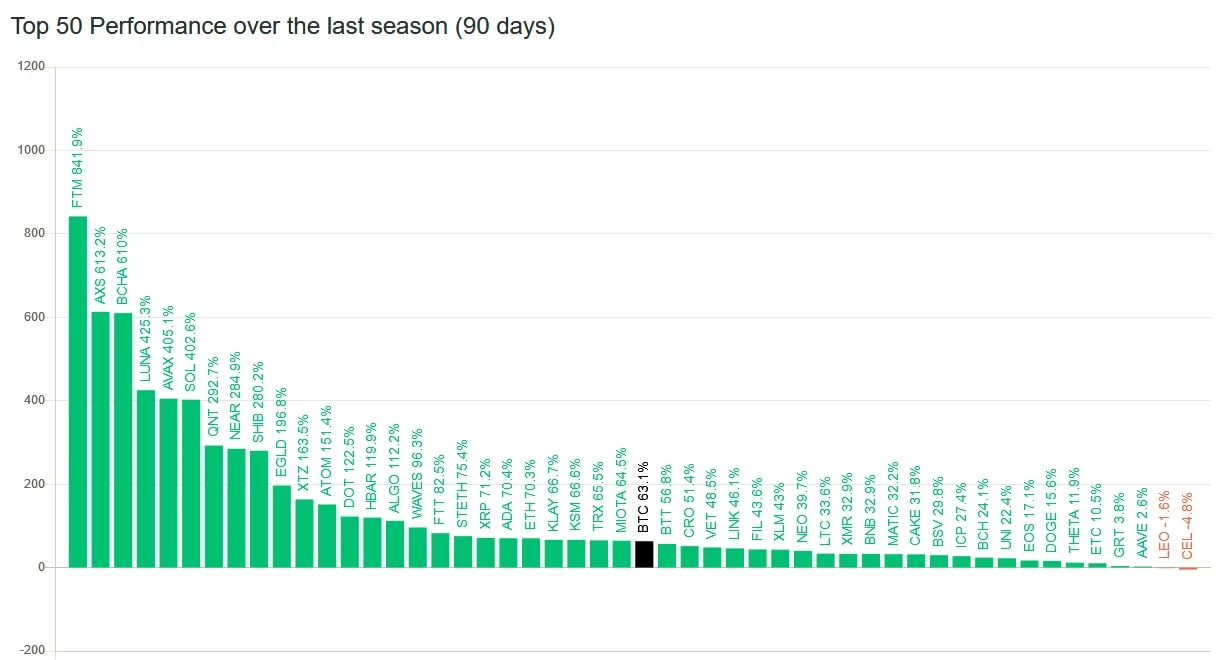
According to blockchaincenter's definition of the Altseason Index, if 75% of the top 50 tokens by market cap outperform Bitcoin over a consecutive 90-day period, the crypto market is considered to be in altseason.
Reviewing the history of digital assets, the last bull market cycle experienced two altseasons: the first occurred between June and July 2017, and the second in early 2018. Each altseason lasted approximately one month or less. Without exception, after each altseason, the crypto market experienced deep corrections. For example, following the early 2018 altseason, the crypto market entered a two-year bear market. Similarly, in April 2021, the crypto market entered altseason, followed shortly by the "519" crash and subsequent monthly-level corrections.
Therefore, when monitoring an altcoin breakout period, it likely signals that prices have reached a parabolic peak, presenting an excellent arbitrage opportunity.
Data source: https://www.blockchaincenter.net/altcoin-season-index/
So, is it altseason now (October 2021)?
According to Altseason, 26 of the top 50 tokens by market cap are currently outperforming Bitcoin, indicating that we are not currently in altseason.
6. RHODL Ratio
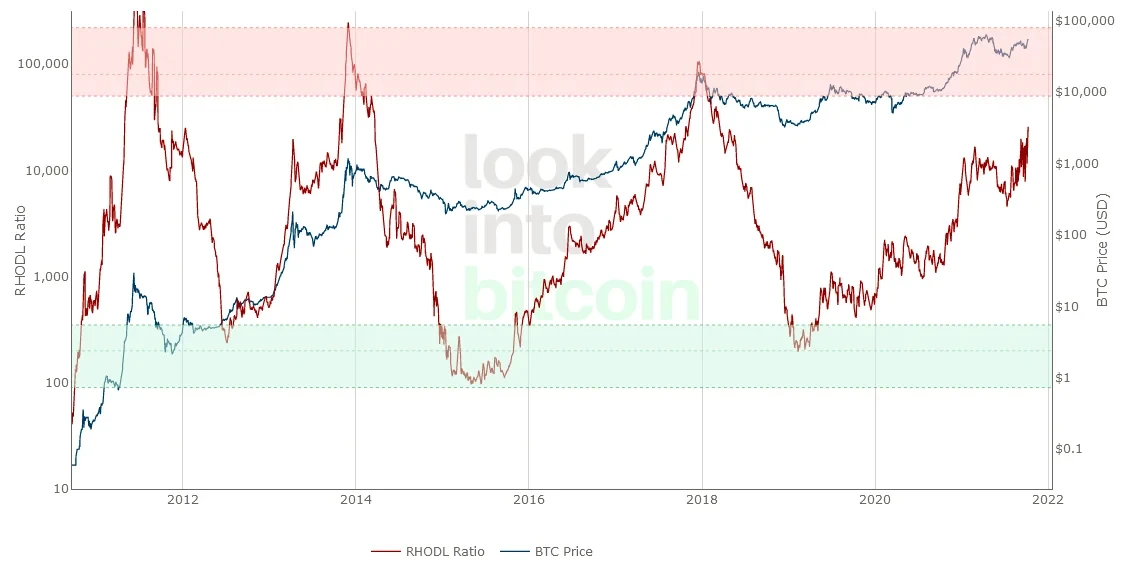
RHODL Ratio was created by Twitter user Philip Swift (@positivecrypto) in June 2020. The formula for this indicator is as follows:

The numerator and denominator represent the realized value weighted for each age band. Realized value refers to the value of Bitcoin at the time it was last transferred from one wallet to another. RHODL Ratio specifically measures the ratio of realized value within 1 week to realized value between 1-2 years. When the 1-week value is significantly higher than the 1-2 year value—meaning too much Bitcoin has moved within 1 week—it indicates excessive market heat.
Data source: https://www.lookintobitcoin.com/charts/rhodl-ratio/
This indicator can relatively accurately identify price peaks in each of Bitcoin's macro cycles. As shown in the chart above, when RHODL Ratio enters the red zone, it indicates the market is approaching a cycle top—an opportune time for investors to take profits. When it enters the green zone, it signals a cycle bottom—an excellent time for investors to accumulate. Looking back at historical crypto bull-bear rotation cycles, RHODL Ratio has consistently marked bull-bear transition points with reasonable accuracy.
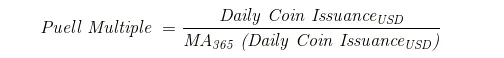
Another indicator with similar functionality to RHODL Ratio worth noting is The Puell Multiple, created by Twitter user David Puell in March 2019.
This indicator focuses on Bitcoin miners and their revenue, exploring market cycles from the perspective of mining revenue. Bitcoin miners are known as forced sellers because they need to cover fixed costs for mining hardware and electricity. Consequently, miner revenue influences prices over time.
The Puell Multiple is calculated by dividing Bitcoin's daily issuance value (in USD) by the 365-day moving average of daily issuance. The formula is as follows:
The graphical representation of The Puell Multiple is shown below:
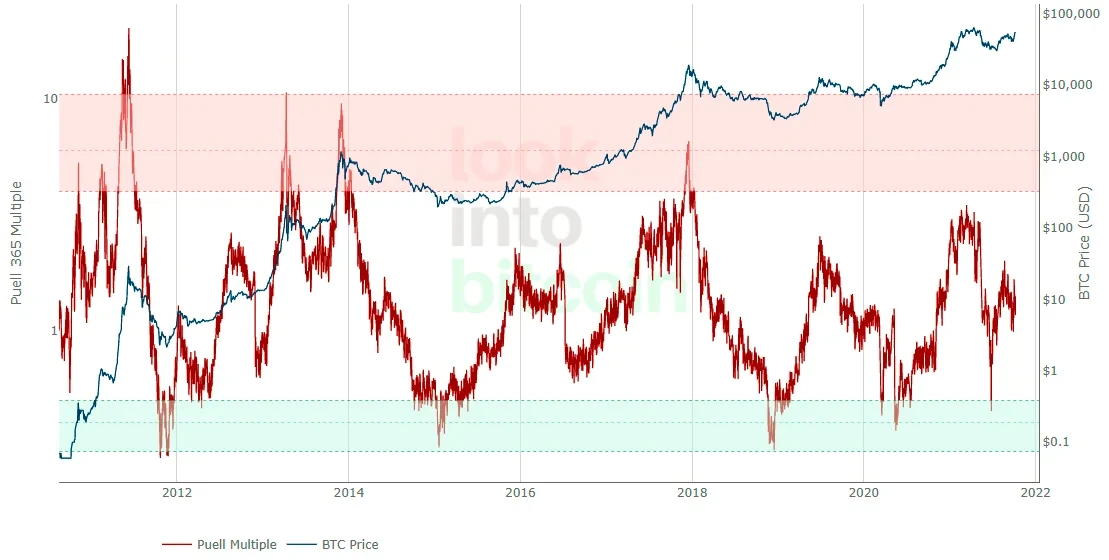
Data source: https://www.lookintobitcoin.com/charts/puell-multiple/
The Puell Multiple shows changes in Bitcoin's daily issuance value. When this indicator reaches historically low levels, The Puell Multiple enters the green box zone—purchasing Bitcoin here has historically delivered substantial returns for investors. Conversely, when the indicator reaches historically high levels, The Puell Multiple enters the red box zone—selling Bitcoin here allows investors to realize profits.
7. Jiang Zhuoer's 60-Day Cumulative Market Cap Increase
This indicator was created by Jiang Zhuoer, CEO of BTC.TOP mining pool. The creator believes that in the late stages of a bull market, when euphoria takes hold and the entire crypto market becomes severely overvalued, large-cap and mainstream coins will rise faster than new capital inflows from newcomers can support. This leads to the bursting of the bull market bubble, followed by a bear market—indicated by an excessively high "60-day cumulative increase."
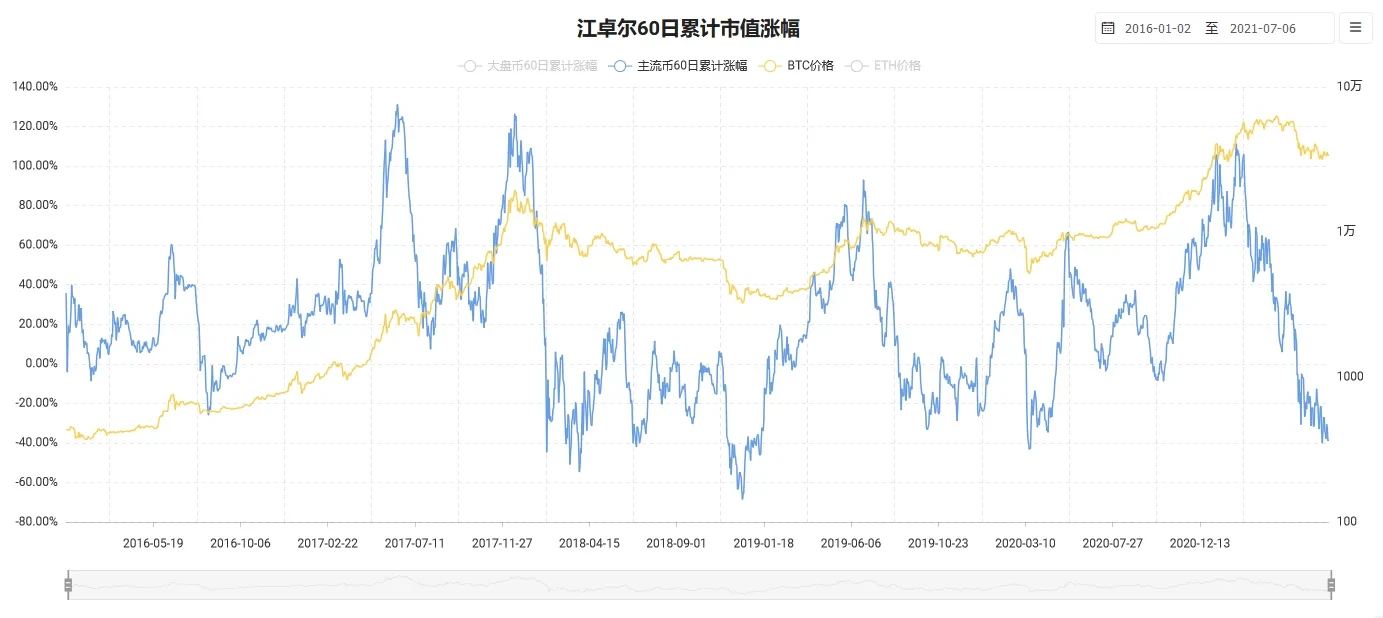
Data source: https://www.qkl123.com/data/marketvalue-increase
8. Whale Bitcoin Wallet Sizes: > 1,000 BTC
Generally, a Bitcoin address holding more than 1,000 BTC is considered a whale address. Changes in the total number of such addresses can significantly impact crypto market trends. When the number of these addresses decreases, it suggests the crypto market may enter a correction phase. Conversely, an increase indicates the market may enter a growth period.
Taking the crypto bull market since 2020 as an example, whale addresses surged from 2,100 in May 2020 to 2,400 in February 2021, then began to decline. In May, the crypto market experienced the brutal "519" crash. This demonstrates the close relationship between whale address counts and crypto market trends.
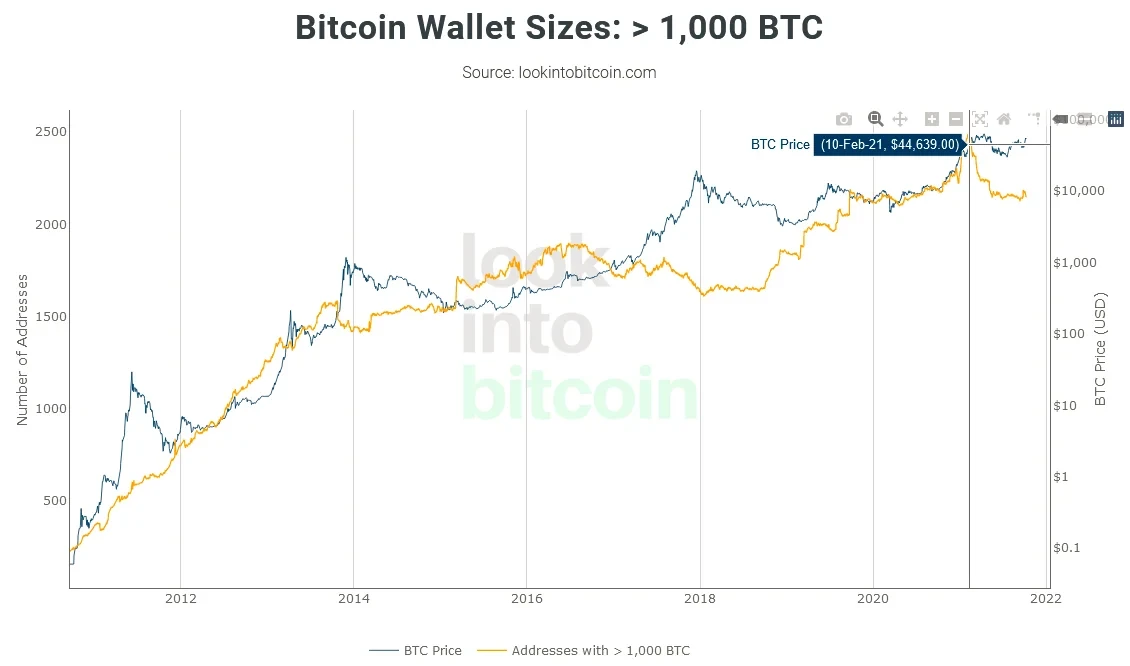
Data source: https://www.lookintobitcoin.com/charts/wallets-greater-than-1000-[btc](/zh-hans/trade-spot/btc-usdt "BTC")/
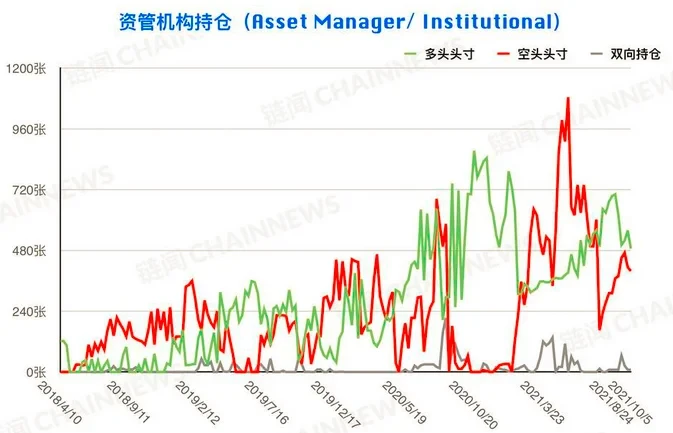
9. CFTC Asset Manager Position Trends
The CFTC Commitments of Traders report is published weekly by the U.S. Commodity Futures Trading Commission at 15:30 local time every Friday (03:30 or 04:30 Beijing time Saturday, depending on daylight saving time). This report reflects open positions as of the close of trading on Tuesday of that week.
CFTC regulations require clearing members and futures commission merchants of futures exchanges to submit position reports daily, similar to domestic exchange position disclosures. The purpose of publishing position reports is to increase market transparency and prevent market manipulation by any single trader with excessively large positions.
According to ChainNews, CFTC reports have four main types: Legacy, Supplemental, Disaggregated, and Traders in Financial Futures (TFF).
Bitcoin futures data of interest to cryptocurrency investors falls under the Traders in Financial Futures report. In addition to Bitcoin, this report includes position data for financial contracts such as currencies, U.S. Treasury bonds, securities, and the Bloomberg Commodity Index. The TFF report divides open interest into four categories: Dealer/Intermediary (e.g., banks), Asset Manager/Institutional (e.g., large hedge funds), Leveraged Funds (generally smaller institutions, private equity), Other Reportables (large traders), and Nonreportable Positions (retail).
CFTC position reports can effectively reflect capital flows in the market. By tracking the dynamics of major market participants and analyzing historical patterns, they can assist in judging price trends for corresponding assets. Especially in markets dominated by institutional capital, tracking capital flows can help determine market activity levels. Analysis of certain historical patterns can even help predict when market turning points might occur.
The most noteworthy metric in this report is total open interest, which measures market activity. According to the latest CFTC position report (released October 5), translated by ChainNews as "Market Participation Surges, Large Institutions Unexpectedly Pour Cold Water," total market open interest is as follows:
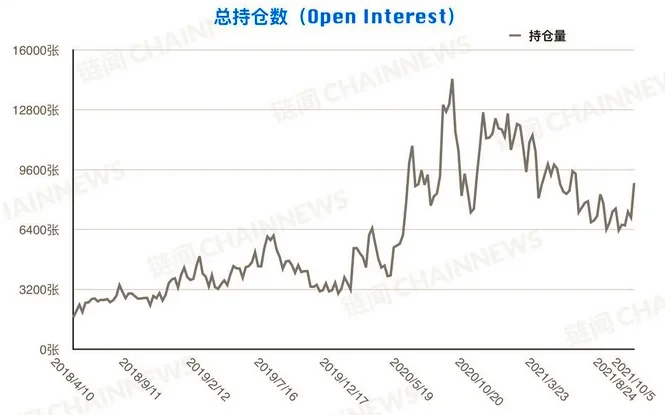
Current total open interest is rising, indicating recovering market enthusiasm.
Another metric worth watching is Asset Manager/Institutional position data. The latest report shows significant reductions in long positions, indicating that asset managers are actually making bearish judgments despite the rallying market environment.
Data source: https://www.chainnews.com/articles/414096660358.htm#
10. Bitcoin Halving
We know that Bitcoin produces one block every 10 minutes. In Bitcoin's first four years, 50 new Bitcoin were issued every 10 minutes. Every four years thereafter, this number halves. The day of the halving is known as "Bitcoin Halving" or "Bitcoin Halvening."
In 2012, new Bitcoin issuance every 10 minutes dropped from 50 to 25. In 2016, it dropped from 25 to 12.5. In the most recent halving on May 11, 2020, rewards dropped from 12.5 BTC to 6.25 BTC per block. In the 2024 halving, rewards will decrease from 6.25 BTC to 3.125 BTC per block. The 2024 halving will occur at block 840,000. Currently, there are approximately 900 days until the fourth halving.
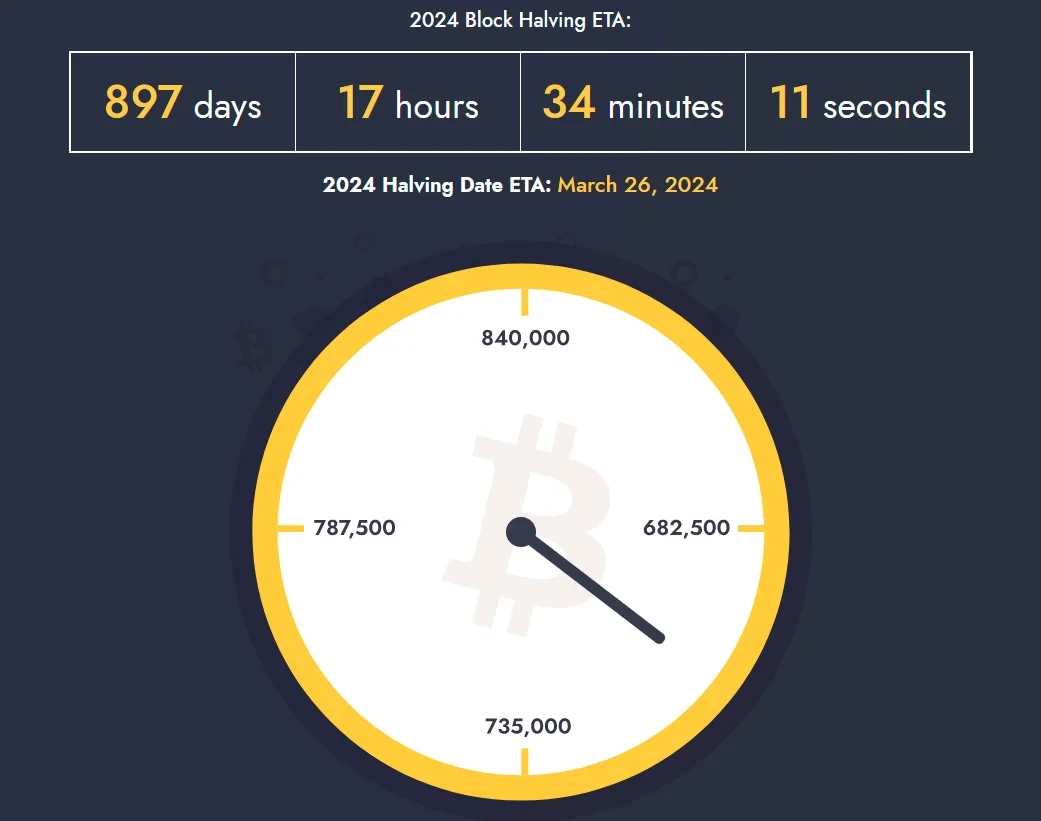
Data source: https://www.buybitcoinworldwide.com/bitcoin-clock/
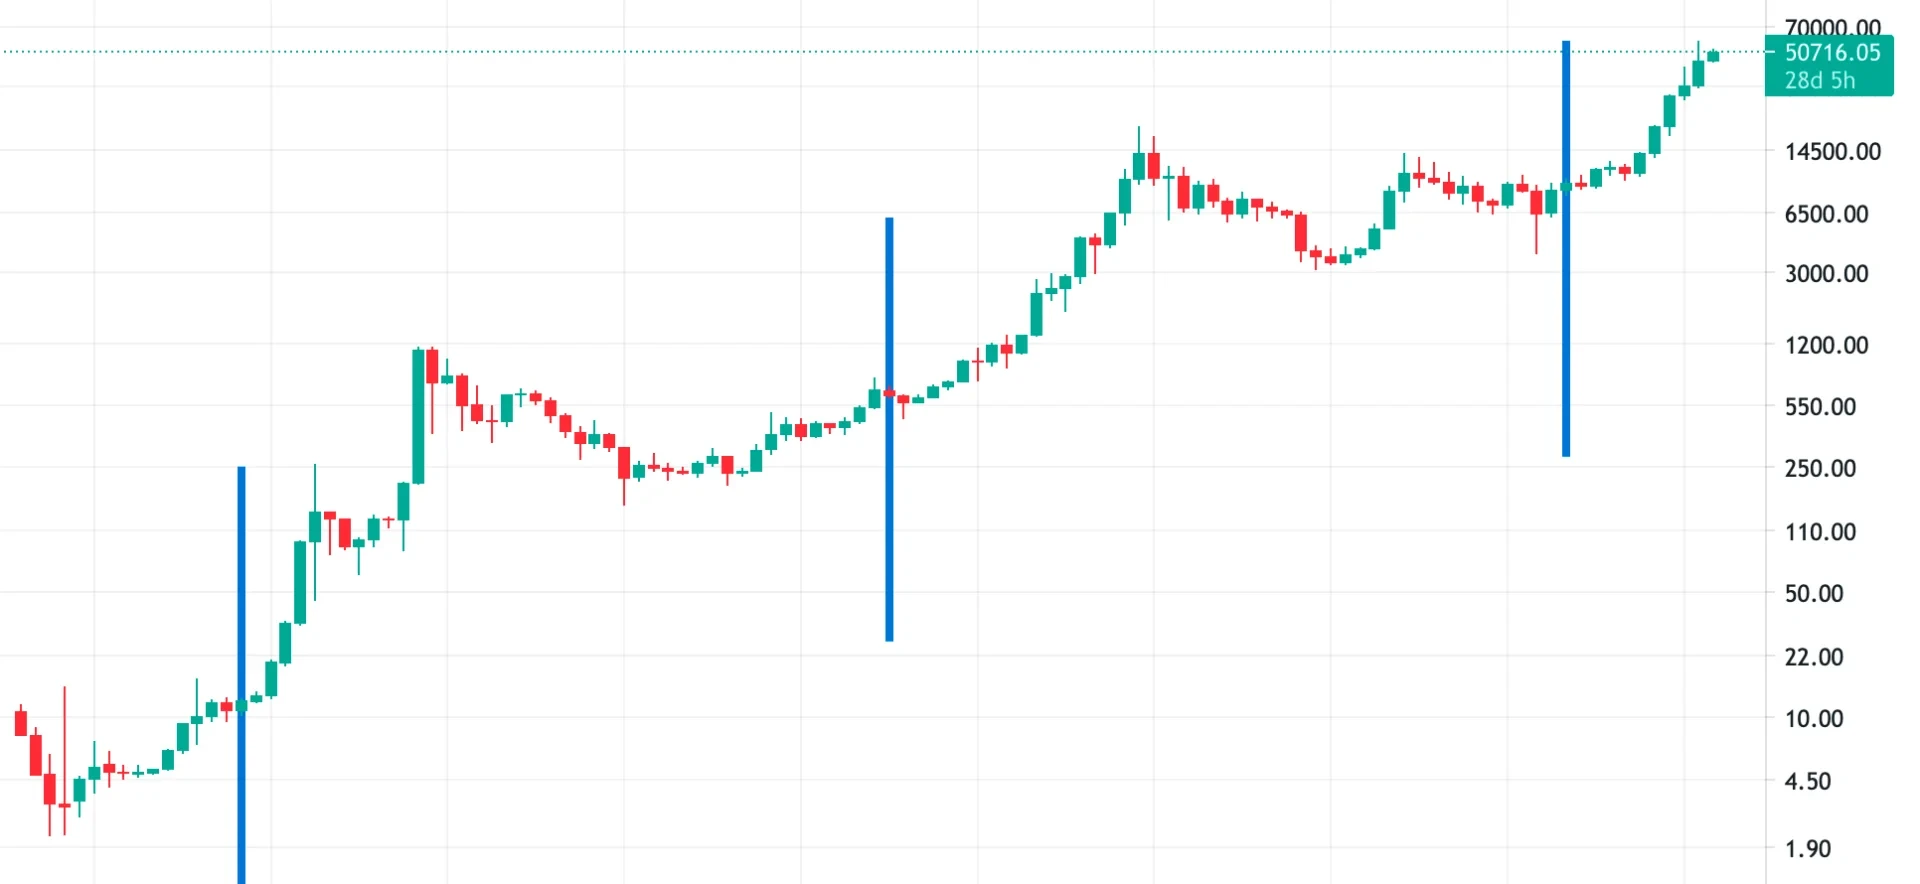
What is the relationship between Bitcoin halving and Bitcoin price? Typically, reduced supply leads to price increases. In the chart below, vertical blue lines indicate the previous three halvings (November 28, 2012; July 9, 2016; and May 11, 2020).
In summary, the "Altseason Index" measures the relationship between top 50 altcoin performance and Bitcoin price during altcoin breakout periods. "RHODL Ratio" can relatively accurately identify Bitcoin price highs and lows in each macro cycle. "Jiang Zhuoer's 60-Day Cumulative Market Cap Increase" warns of market overheating by monitoring Bitcoin's consecutive 60-day gains. "Whale Bitcoin Wallet Sizes" provides feedback on the market's smartest crypto funds' views on price trends by monitoring changes in whale wallet counts. "CFTC Asset Manager Position Trends" clearly shows position changes in institutional crypto trading. "Bitcoin Halving" demonstrates macro-level crypto industry cycle changes.
Disclaimer
This article may contain content related to products not available in your region. This article is intended to provide general information only and is not responsible for any factual errors or omissions. The views expressed are solely those of the author and do not represent the views of OKX. This article is not intended to provide any advice, including but not limited to: (i) investment advice or recommendations; (ii) offers or solicitations to buy, sell, or hold digital assets; or (iii) financial, accounting, legal, or tax advice. Holding digital assets (including stablecoins) involves high risk and may fluctuate significantly or even become worthless. You should carefully consider whether trading or holding digital assets is suitable for you based on your financial situation. For questions regarding your specific circumstances, please consult your legal/tax/investment professionals. Information appearing in this article (including market data and statistics, if any) is for general reference purposes only. Although we have exercised all reasonable care in preparing this data and these charts, we assume no responsibility for any factual errors or omissions expressed herein. © 2025 OKX. This article may be reproduced or distributed in its entirety, or excerpts of 100 words or less may be used, provided such use is non-commercial. Any reproduction or distribution of the entire article must also prominently state: "Copyright © 2025 OKX, used with permission." Permitted excerpts must cite the article title and include attribution, such as "Article Title, [Author Name (if applicable)], © 2025 OKX." Some content may be generated or assisted by artificial intelligence (AI) tools. Derivative works or other uses of this article are not permitted.
Show More
Recommended Reading

2025 KOL Favorite OKX Products Rankings
In the cryptocurrency industry, professional players' choices are always direct and pure. In 2025, KOLs voted with their capital and time throughout the year for the most authentic endorsement of industry tools and ecosystem development. We focused on four core questions—"What was your biggest achievement this year?", "What OKX product did you use and love most in 2025?", "Why do you like it?", and "This
January 5, 2026

2026 Investment Outlook: Assets On-Chain, Intelligence and Privacy | OKX Annual Review
Three major trends in crypto's future: asset transformation, entity transformation, and rule transformation. As we approach 2026, moving beyond the past four years focused on "road-building" infrastructure, the crypto industry is undergoing a profound paradigm shift. OKX Ventures defines this as the beginning of the "Kinetic Finance" era, where the core is no longer how fast the network is, but how on-chain assets flow and generate returns
December 31, 2025

Voting with Data: Insights into 2025's Hottest Trading Products | OKX Annual Review
If you only look at market conditions, it's hard to explain the return differences among exchange users in 2025. What truly determines returns depends equally on account-level operational methods, not just market volatility itself. OKX's annual report shows that mainstream coins remain the core for capital turnover and return generation, supporting trading and strategy execution; emerging coins are more used to amplify volatility and provide阶段性 opportunities, but are not stable, long-term sources of returns. What truly contributes consistently to returns
December 30, 2025

Fusaka in Practice: What Ethereum's Latest Upgrade Means for L2s, Nodes, and Users
The Ethereum mainnet has completed the Fusaka fork. From a protocol perspective, this upgrade mainly consists of four components. The full article follows a Q&A format to show more core viewpoints and frontline experiences from three guests: Ahmad (@smartprogrammer) – Nethermind Execution Client / Ethereum Core Developer; Manu (@manunalepa) – Prysm / Of
December 16, 2025

OKX Research Institute | Why Did RWA Become a Key Narrative in 2025?
RWA (Real World Assets) is becoming the "new favorite" of global capital. Simply put, RWA moves valuable, ownership-verified things from the real world—such as real estate, bonds, stocks, and other traditional financial assets, and even artwork, private lending, carbon credits, and other assets that are normally difficult to trade directly—onto the blockchain, transforming them into tradable, programmable crypto assets. This way, it becomes
November 20, 2025
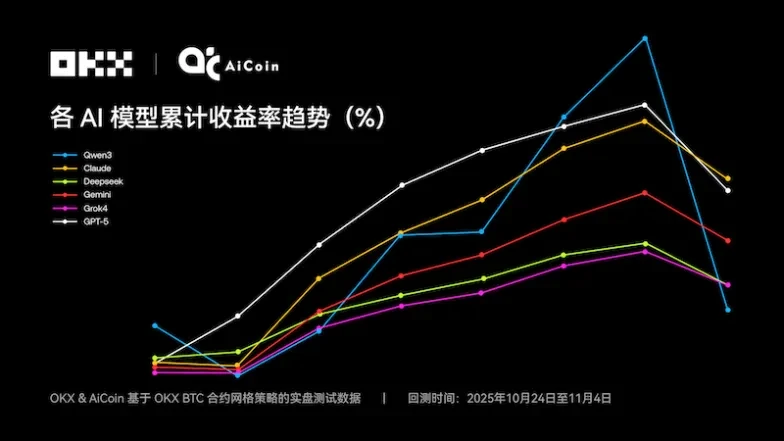
Claude Takes the Crown: The Truth Behind the 6 AI Grid Strategy Showdown | OKX & Ai Coin Live Trading Evaluation
Short-term trading champion Qwen3—is it also the king in grid strategies? NOF1's "AI Trading Live Arena" Season 1 finally concluded at 6 AM on November 4, 2025, capturing the attention of the crypto, tech, and finance communities. But the outcome of this "AI IQ public test" was somewhat unexpected: six models with a combined $60,000 in principal ended with only $43,000
November 6, 2025