
Reviewing the First Anniversary of DeFi Summer: These 6 Metrics Are All You Need
If we count from June 29, 2020, when OKX launched Compound (COMP) trading, the vigorous "DeFi Summer" has passed for exactly one year. Over this past year, we have experienced both the brilliant moments of crazy surges in various DeFi metrics and witnessed the resilient growth of new forces after encountering various setbacks. One year later today, let's use data as an entry point to comprehensively examine the ups and downs of DeFi's journey and explore possible future directions for DeFi development.
Why Start with "DeFi Summer"
Or rather, why do we start this topic with the rise of Compound last summer? In fact, if we follow the historical development of DeFi, we can trace back to Maker DAO, founded in 2014, a DeFi project built on Ethereum focusing on collateralized lending, which is also widely recognized in the industry as the star project that opened the door to DeFi. However, in the years following Maker DAO, due to its relatively high barriers to participation and the fact that a mature economic model had not yet been explored, DeFi's development remained in a low-key accumulation stage and was not well-known to the vast majority of investors in the crypto market. It was not until concepts like "Liquidity Mining" and "Yield Farming" were proposed that, with their stable and relatively low-risk high returns performance, DeFi began to gradually gain widespread attention in the crypto community.
Compound was the chosen one that ignited the first fire of "DeFi Summer" in 2020. Although the term "liquidity mining" was neither invented by the Compound team nor was it the mechanism they最早 adopted, Compound was the most important promoter of this phenomenon. Last summer, the Compound protocol released its governance token COMP, thereby promoting the concept of Staking. COMP further led the market's liquidity mining boom. During this period, we also witnessed the historical moment when Yearn Finance's governance token YFI became the first crypto asset in history to exceed the price of Bitcoin.
Looking at "DeFi Summer" One Year Later Through Data
1) Total Value Locked (TVL), Up 58x at Peak
Total Value Locked (TVL) is one of the important metrics for measuring the scale of DeFi ecosystem development, obtained by calculating the total value of all ETH and various ERC-20 tokens locked in DeFi protocol smart contracts. Simply put, it measures how much real money investors of all sizes have put into DeFi smart contracts, earning returns for themselves while participating in DeFi ecosystem construction.
According to OKLink statistics, over the past year, the TVL of the Ethereum-based DeFi ecosystem grew from $1.92 billion at the end of June 2020 to a peak of approximately $113.57 billion (May 11, 2021), representing a peak increase of about 5815.1%. Subsequently, due to market declines, TVL gradually decreased. As of this writing, TVL is approximately $71.37 billion, still representing an increase of 3617.2% compared to the launch of "DeFi Summer."
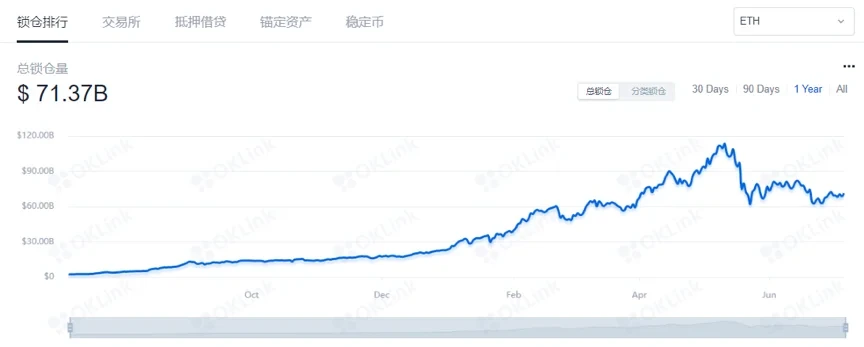
Ethereum-based DeFi ecosystem TVL data over the past year, source: OKLink
At the same time, it should be noted that the TVL data mentioned above is calculated in US dollar value, while what investors put into DeFi protocols are various crypto assets. This means that data will change with price fluctuations of crypto assets such as ETH. This creates a situation - when the quantity of locked crypto assets remains unchanged, if crypto asset prices rise, TVL will correspondingly increase, and vice versa. Therefore, to more comprehensively and objectively understand investor sentiment changes in the DeFi market, when using TVL to measure the scale of the DeFi ecosystem, we can also refer to two auxiliary indicators: the amount of ETH and BTC locked in DeFi. This means directly looking at whether the ETH and BTC investors put into DeFi are changing, without considering market price fluctuations.
According to DeFi Pulse statistics, over the past year, the amount of ETH locked in DeFi grew from approximately 3.448 million to a peak of 11.006 million (April 21, 2021), representing a peak increase of about 219.2%. Then, affected by several significant declines in ETH prices, the combined effect of skyrocketing liquidations and some users withdrawing assets to avoid risk caused the ETH locked in DeFi to ultimately retract to 8.8 million, representing a growth rate of about 155.2% compared to one year ago.
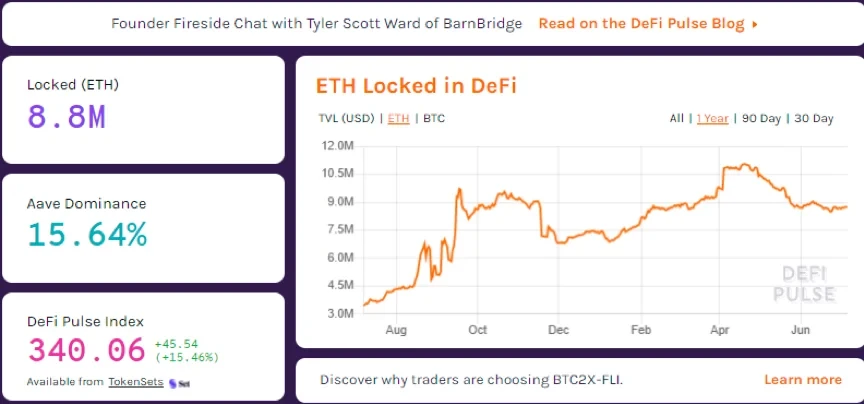
ETH locked in DeFi over the past year, source: DeFi Pulse
Now let's look at the quantity of BTC locked in DeFi. According to DeFi Pulse statistics, there are currently 168,300 BTC locked in the Ethereum DeFi ecosystem, accounting for approximately 1% of the current circulating supply of 18.7489 million BTC. Calculated at current Bitcoin prices, this contributes nearly $10 billion in locked value to the Ethereum DeFi ecosystem. One year ago, this figure was only 12,000. Here we can also make an interesting comparison: the quantity of Bitcoin locked on the Bitcoin Lightning Network. According to media reports, as of June 15 this year, the quantity of Bitcoin locked on the Bitcoin Lightning Network had just surpassed 1,500. This shows that DeFi already has considerable appeal for Bitcoin holders.
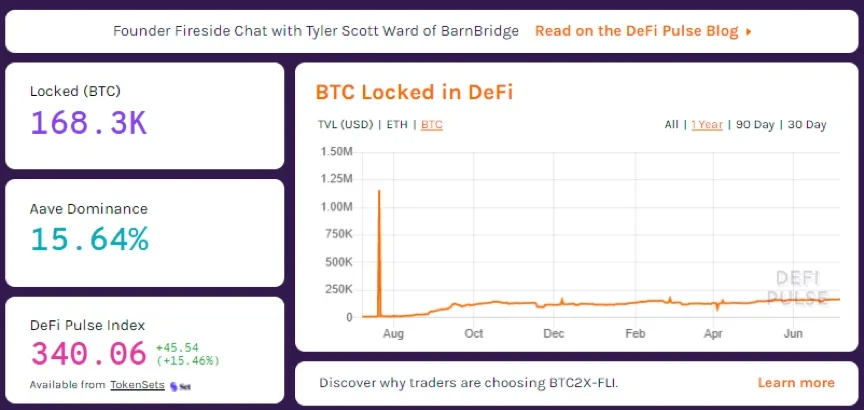
BTC locked in DeFi over the past year, source: DeFi Pulse
2**) User Count**
DeFi user count is one of the important metrics for measuring DeFi ecosystem development and activity. It should be noted that the "user count" metric cited here assumes that one independent address represents one user, which is different from the general sense of user count. In reality, a DeFi user may own multiple independent addresses, so this data may be overestimated. Additionally, growth users of different protocols may also overlap.
From the statistics provided by DeBank below, we can see that since the summer of 2020, especially in the first half of 2021, against the backdrop of an overall bull market and incentives from various liquidity yield mining programs, the DeFi ecosystem has flourished and once again welcomed a wave of user growth.
Counting from June 1, 2020, the number of users across all DeFi trading protocols that day was over 6,200, while the peak was on May 11, 2021, with 850,000 trading users that day, representing growth of nearly 140x within one year.
DeFi user count data over the past year, source: DeBank
3**) Total Borrowing Volume**
Taking Maker DAO and Compound mentioned above as examples, lending services are a very important part of the DeFi ecosystem. The total borrowing volume based on these smart contracts can reflect the collateral and lending scale of lending protocols in the DeFi ecosystem, and can also serve as an important metric for evaluating user trading activity. From OKLink statistics, we can see that at the end of June 2020, the total borrowing volume of all DeFi was $540 million, compared to the peak of $19.3 billion on May 9, 2021, representing growth of over 3474.1% within one year.
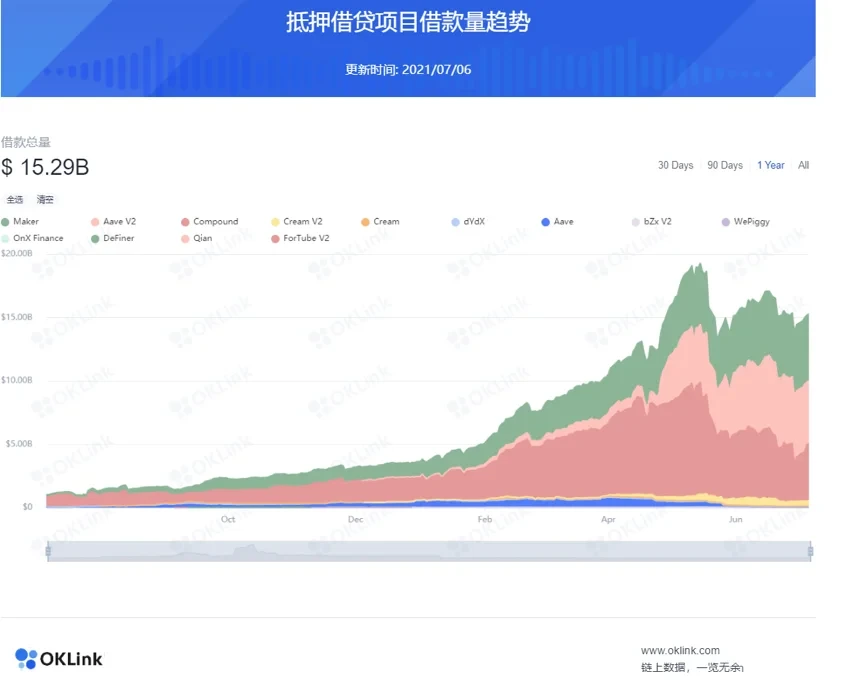
DeFi ecosystem collateralized lending project borrowing volume trend, source: OKLink
4**) Trading Volume**
For any trading project, observing its trading volume trend is undoubtedly the most intuitive and convincing metric. After the Compound collateralized lending protocol, rapidly rising DEXs like Uniswap and SushiSwap, along with other more diverse liquidity mining DEXs, provided rich trading platforms for DeFi participants. From trading volume data, there is a trend of catching up to CEX. Specifically, according to DeBank statistics, at the end of June 2020, trading volume on DEXs was only about $60 million, while by May 29, 2021, this figure had reached $23.01 billion, representing a peak increase of 382.5x.
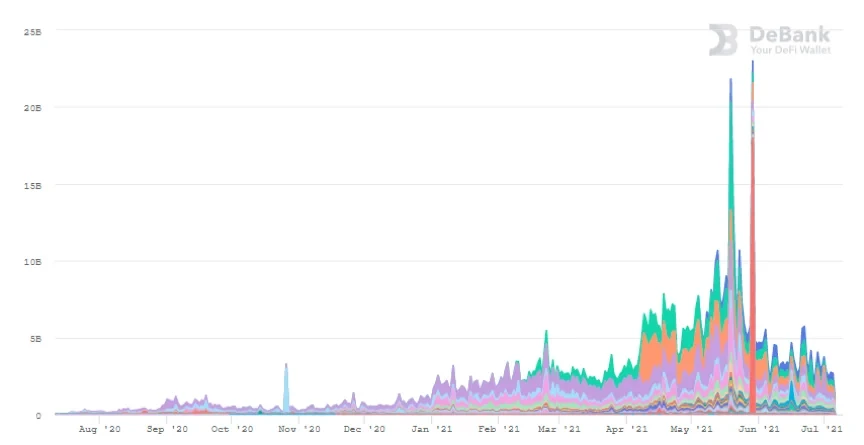
DEX trading volume data over the past year, source: DeBank
5**) Gas Price**
Discussion about Gas prices has actually run through the entire process of DeFi development. During the explosion of DeFi Summer last year, we often heard DeFi investors complaining that trading fees frequently reached tens or even hundreds of dollars. For investors with smaller capital, mining returns were often insufficient to cover fees. In fact, before DeFi Summer arrived, Gas Price, which indicates Ethereum network prices, had already shown significant growth, rising from single-digit Gwei levels to tens of Gwei levels. But obviously, after liquidity mining launched, Gas Price grew rapidly in the short term, far exceeding historical averages and subsequently remaining at high levels for a long time. To help readers more intuitively understand the historical changes in Gas Price, we captured the trend chart from OKLink from 2017 to the present.
From the chart below, we can see that counting from June 1, 2020, the Gas Price that day was 30 Gwei, while the peak was on September 17, 2020, when the average Gas was 544 Gwei, representing 18x growth in 3 months.
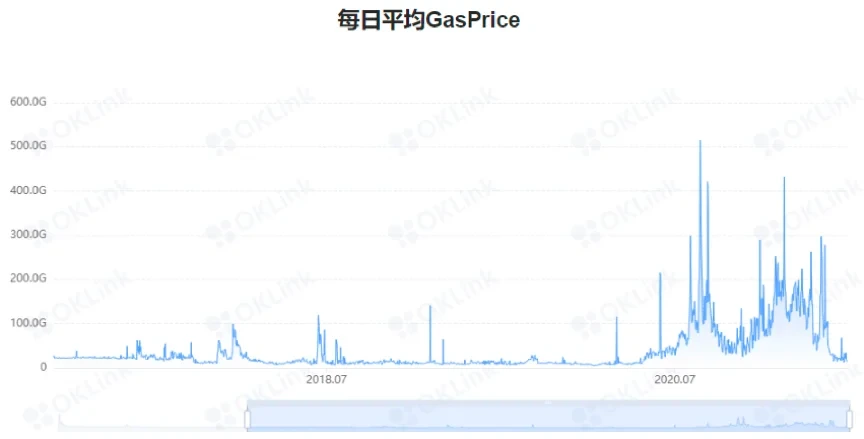
Gas Price changes since 2017, source: OKLink
6**) Oracle Call Count**
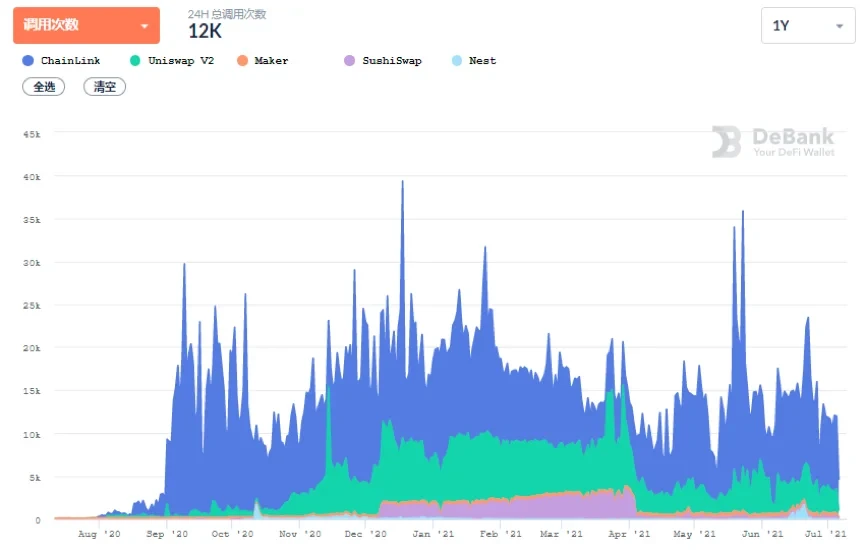
As a tool that transmits data from outside the blockchain to inside the blockchain, thereby ensuring on-chain data authenticity, the oracle is a very important piece of underlying infrastructure in blockchain networks. Before the rapid development of DeFi, oracles actually did not see large-scale application, but since last year's DeFi Summer, the demand for oracles has also undergone tremendous changes, which can be clearly seen through oracle call counts.

Oracle call count changes over the past year, source: DeBank
From the chart above, we can see that on June 1, 2020, the daily oracle call count was only 72, compared to the peak of 40,000 calls on December 18, 2020, representing growth of over 500x in six months.
Can the Glory of "DeFi Summer" Be Recreated?
From the overall situation of the current crypto market and the data we mentioned above, after experiencing the second explosion from April to May, the DeFi ecosystem has once again returned to a downturn. Whether looking at ETH's Gas price changes or DeFi token price changes, it seems to declare that the DeFi ecosystem has entered a decline.
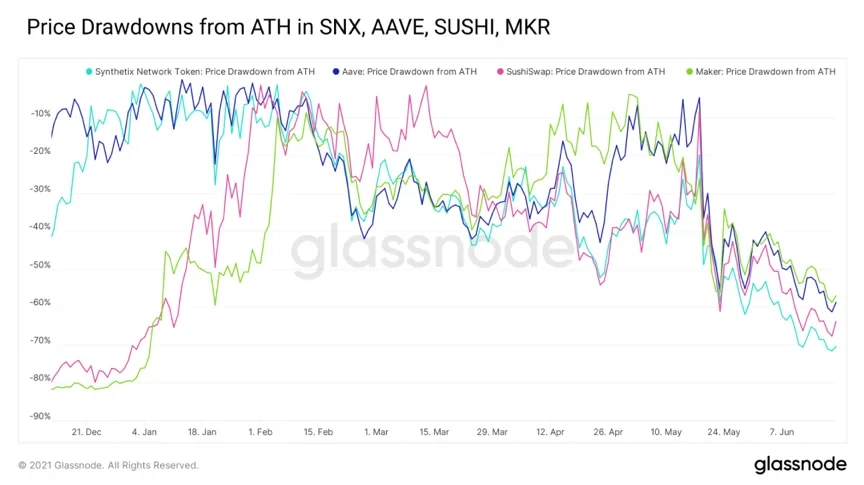
Recent mainstream DeFi token price trends, source: Glassnode
So, does this mean that Ethereum's DeFi ecosystem has hit a ceiling? It seems we don't need to rush to conclusions. If we look at the overall data of the crypto market, the current DeFi ecosystem is still in a very early stage of development. Although Ethereum's TVL has now shrunk to $71.3 billion, from another perspective, we can also say that there are still more assets that haven't entered the DeFi ecosystem.
As we mentioned in the mid-April article "DeFi Total Value Locked Exceeds $60 Billion: How to Maintain Attractiveness to Investors", DeFi has initially proven that the financial industry can operate without gatekeepers or centralized intermediaries, creating an environment where anyone can safely lend, borrow, and trade directly. Currently, there are still 1.7 billion people worldwide who do not have bank accounts in the traditional financial world. Therefore, as DeFi infrastructure continues to improve, interaction design becomes more user-friendly, and usage barriers further decrease, these 1.7 billion people are likely to bypass traditional financial society and directly become participants and beneficiaries of the decentralized finance world, which will undoubtedly usher in a larger and more sustained explosion.
Disclaimer
This article may contain content about products that are not available in your region. This article is intended to provide general information only and does not take responsibility for any factual errors or omissions contained therein. This article represents only the author's personal views and does not represent the views of OKX. This article is not intended to provide any advice, including but not limited to: (i) investment advice or investment recommendations; (ii) offers or solicitations to buy, sell, or hold digital assets; or (iii) financial, accounting, legal, or tax advice. Holding digital assets (including stablecoins) involves high risk, may fluctuate significantly, and may even become worthless. You should carefully consider whether trading or holding digital assets is suitable for you based on your financial situation. For questions about your specific situation, please consult your legal/tax/investment professional. The information appearing in this article (including market data and statistics, if any) is for general reference only. Although we have taken all reasonable precautions in preparing these data and charts, we accept no responsibility for any factual errors or omissions expressed herein. © 2025 OKX. This article may be reproduced or distributed in its entirety, or excerpts of 100 words or less from this article may be used, provided that such use is non-commercial. Any reproduction or distribution of the entire article must also prominently state: "This article is copyrighted © 2025 OKX, used with permission." Permitted excerpts must cite the article name and include the source, such as "Article Name, [Author Name (if applicable)], © 2025 OKX". Some content may be generated or assisted by artificial intelligence (AI) tools. Derivative works or other uses of this article are not permitted.
Show More
Recommended Reading

2025 KOLs' Most Used OKX Products List
In the cryptocurrency industry, professional players' selections are always direct and pure. In 2025, KOLs used a full year of capital investment and time accumulation to cast the most genuine votes for industry tools and ecosystem development. We focused on four core questions—"What was the biggest achievement of the year?", "Given the achievements, what OKX product did you use most and like best in 2025?", "Why do you like it?", and "This
January 5, 2026

2026 Investment Outlook: Assets On-Chain, Intelligence & Privacy | OKX Annual Record
Three major trends for the future of Crypto: Asset transformation, entity transformation, and rule transformation. As we are about to enter 2026, saying goodbye to the past four years of infrastructure focused on "road building," the crypto industry is welcoming a profound paradigm shift. OKX Ventures defines this as the opening of the "Kinetic Finance" era, where the core is no longer how fast the network is, but the flow and earnings of on-chain assets
December 31, 2025

Voting with Data:透视 2025 Hot Trading Products | OKX Annual Record
If you only look at market conditions, it's hard to explain the difference in returns among trading users in 2025. What truly determines returns also depends on account-level operation methods, not just market volatility itself. The OKX annual statement shows that mainstream coins remain the core of capital turnover and returns bearing, supporting trading and strategy execution; Emerging coins are more used to amplify volatility and provide phased opportunities, but are not a stable, long-term source of returns. What truly continuously contributes returns is
December 30, 2025

Fusaka in Practice: What Does Ethereum's Latest Upgrade Mean for L2, Nodes, and Users?
Ethereum mainnet has completed the Fusaka fork. At the protocol level, this upgrade mainly includes four parts. The full text presents the core views and frontline experience of three guests in Q&A format: Ahmad (@smartprogrammer) – Nethermind execution client / Ethereum core developer Manu (@manunalepa) – Prysm / Of
December 16, 2025

OKX Research | Why Did RWA Become a Key Narrative in 2025?
RWA (Real World Assets) is becoming a global capital "favorite." Simply put, RWA takes valuable, ownership-bearing things from the real world—such as traditional financial assets like houses, bonds, stocks, as well as assets like art, private lending, and carbon credits that are usually difficult to trade directly—and moves them onto the blockchain, turning them into tradeable, programmable crypto assets. This way, not
November 20, 2025
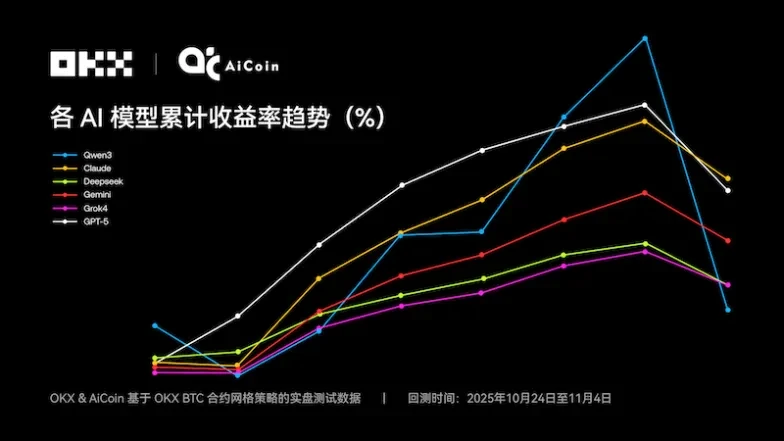
Claude Takes the Championship: The Truth Behind 6 Major AI Grid Strategy Showdowns | OKX & Ai Coin Live Trading Review
Short-term trading champion Qwen3, is it also a king in grid strategies? The first season of the "AI Trading Live Arena" launched by NOF1 finally concluded at 6 AM on November 4, 2025, whetting the appetite of the crypto, tech, and financial circles. But the ending of this "AI IQ public test" was somewhat unexpected: the total principal of $60,000 across six models was only $4.3
November 6, 2025