OKX Research | A Deep Dive into 10 Years of Performance for Mainstream Assets: The Truth Behind Bitcoin, Gold, US Stocks, US Treasuries and More


During the 2015-2025 period, global financial markets experienced a magnificent cycle. From quantitative easing in the post-financial crisis era to the historic zero-interest-rate environment, and then to the aggressive tightening cycle triggered to combat high inflation, massive waves of macroeconomics continuously impacted various assets. In this context, crypto assets represented by BTC and ETH far exceeded the gains of gold, US stocks, and US Treasuries, completing an astonishing leap from experimental projects in geek circles to entering Wall Street institutional asset balance sheets. However, behind the excess returns also comes extreme risk—crypto assets experienced deep drawdowns exceeding 75%, with recovery periods often measured in years, while traditional assets demonstrated greater resilience.
To this end, OKX Research takes "10 Years of Performance for Five Mainstream Assets" as its core, attempting to answer a key question: Over a 10-year time horizon, when placing BTC and ETH alongside gold, the S&P 500 index, US Treasuries and other mainstream assets, what are the true portraits of their respective returns and risks? Have we paid an equivalent, or even excessive risk price for the astonishing returns of crypto assets? To this end, we will go beyond comparing single return rates, striving to paint a complete, objective, cycle-spanning map of asset performance. (Statistics as of August 31, 2025)

Data source: 8Market Cap; Global major asset market cap ranking as of end of August 2025, Bitcoin has ranked among the top
Returns Showdown: Who is the King of Assets?
The most intuitive method to evaluate an asset is to observe its long-term value growth trajectory. We assume investing $10,000 in each of these 5 assets on August 1, 2015, and track their cumulative value changes to August 1, 2025. This comparison clearly reveals the huge differences in wealth creation capabilities across different asset classes.
(I) Annual Price Snapshots: Value Benchmarks at Key Nodes (2015-2025, August 1 of each year)
The table below records the closing prices of the five core assets on August 1 of each year from 2015 to 2025 (or the first trading day thereafter).

Data source: Based on Yahoo Finance and CoinGecko, closing prices on the day or first trading day thereafter; ETF prices are adjusted closing prices
From the price snapshots, we can clearly see that Bitcoin and Ethereum experienced exponential growth, with their price orders of magnitude undergoing fundamental changes within a decade. In contrast, the S&P 500 demonstrated a steady bullish upward trajectory, gold showed volatility related to macroeconomic cycles, while US Treasury prices clearly reflected changes in the interest rate environment, notably under pressure during the 2022-2023 rate hike cycle.
(II) Annual Peak Moments: Capturing the Highest Point of Each Cycle
Merely observing price snapshots on specific dates is far from sufficient to depict the full picture of assets. Intra-year price volatility, especially the appearance of highs, reveals the potential explosive power of assets and the "Fear Of Missing Out" (FOMO) that traders may face. The table below records the highest prices reached by each asset within each annual cycle (from August 1 of the current year to July 31 of the following year).

Data source: Ethereum launched on July 30, 2015; early data had lower liquidity and may contain some errors. Other data calculated based on Yahoo Finance daily historical data
By observing annual price peaks, we can clearly see the magnitude differences in asset growth. Bitcoin and Ethereum show惊人的 jumps in price highs during bull markets, while the gap between annual highs and snapshot prices for the S&P 500 and gold is much smaller, reflecting their more mature and stable market characteristics.
(III) Wealth Growth Simulation: The 10-Year Fantasy Journey of $10,000
To more intuitively feel the wealth creation capabilities of different assets, we simulate a simple experiment: On August 1, 2015, invest $10,000 in each of the five assets and hold until August 1, 2025. The chart below shows the cumulative value changes of this investment using a logarithmic scale, which better handles data with huge order-of-magnitude differences, preventing the curves of high-growth assets from being too steep and obscuring details of other assets.

Data source: Yahoo Finance, FRED, Macrotrends, etc.
The table shows that over the 2015-2025 decade, the growth multiples for different assets were: BTC 402.17x, with 10-year cumulative returns of approximately $4.02 million; ETH 1195.55x, with 10-year cumulative returns as high as approximately $11.95 million; Gold 3.08x, with 10-year cumulative returns of approximately $30,000; S&P 500 2.97x, with 10-year cumulative returns of approximately $29,600; US Treasuries 1.26x, with 10-year cumulative returns of only approximately $12,600.

Among them, Bitcoin and Ethereum demonstrated惊人的 wealth growth effects, with returns far exceeding traditional assets by hundreds or even thousands of times, embodying the asymmetric return potential of emerging technology assets under high risk—something unimaginable in the traditional financial world. In contrast, the S&P 500 tripled investments through steady compound growth, gold primarily served a preservation function, while US Treasuries nearly stagnated over 10 years after fully experiencing low and high interest rate cycles, highlighting the constraint of interest rate risk on long-term bond asset performance.
Maximum Drawdown: How High is the Risk Behind Returns?
No asset can lead forever, and return rates are just the beginning of the story. A mature trader cares more about the quality of returns—i.e., how much risk was assumed to achieve these returns. Therefore, understanding the risk characteristics of different assets is equally important as understanding their return potential. Through three core indicators—volatility, maximum drawdown, and Sharpe ratio—we can more comprehensively assess the true "value for money" of various assets. Volatility is typically measured by standard deviation, reflecting the magnitude of asset price fluctuations. Maximum drawdown measures the largest decline from a historical high to a subsequent low, serving as an intuitive indicator of downside risk that directly relates to traders' psychological tolerance limits and portfolio survival ability.

Data source: Bloomberg, S&P Global, Yahoo Finance, etc.
Crypto assets are far more volatile than traditional assets. According to Digital One Agency data, Bitcoin's annualized standard deviation is approximately 70%-90%, while the S&P 500 index is only 15%-20%. This巨大的 volatility directly leads to惊人的 maximum drawdowns: In the past 10 years, Bitcoin and Ethereum experienced multiple deep drawdowns exceeding 70%. For example, in the 2018 bear market, BTC price fell from nearly $20,000 to about $3,000, a drawdown exceeding 80%. The S&P 500's largest drawdown occurred in early 2020 during the COVID-19 pandemic, approximately -34%. During the 2008 financial crisis, drawdowns exceeded 50%. Gold performed relatively stably, with maximum drawdown over the past 15 years of approximately -29%. US Treasuries as safe-haven assets had the smallest drawdown magnitude, but affected by interest rate cycles, also experienced a maximum drawdown of approximately -23% during the rate hike cycle after 2020, shattering its "risk-free" myth.

This data is sobering. Bitcoin and Ethereum investors must be able to withstand asset shrinkage exceeding 80% or even 90%, and need to wait more than two to three years to break even.
In addition, to comprehensively evaluate risk and returns, we also introduce the Sharpe ratio and Calmar ratio. The Sharpe ratio, proposed by Nobel laureate William Sharpe, is the most classic risk-adjusted return indicator internationally. It measures how much excess return an investor can obtain above the risk-free rate for each additional unit of total risk assumed (measured by volatility). The higher the Sharpe ratio, the better the asset's return performance when assuming the same risk, indicating higher trading efficiency.
The Calmar ratio is another important risk-adjusted return indicator, but it focuses more on measuring downside risk of assets. Its calculation method is the ratio of annualized return to historical maximum drawdown. The higher the Calmar ratio, the stronger the "recovery ability" or "value for money" of the asset's returns when experiencing the worst drawdowns in history. This indicator is particularly favored by investors who focus on risk control.

Bitcoin and Ethereum have the most "aggressive" radar chart shapes. They demonstrate unparalleled advantages in two dimensions—annualized return rate and Calmar ratio—forming two outward spikes, reflecting their惊人的 wealth growth effects and strong post-drawdown recovery capabilities over the past decade. However, this high return comes at a cost. In the dimensions of maximum drawdown and annualized volatility, their scores are the lowest among all assets, meaning their shapes severely contract in these two directions, constituting obvious "shortcomings." This clearly reveals the high-risk, high-volatility nature of crypto assets. Notably, Bitcoin's Sharpe ratio performance is better than Ethereum's, indicating that Bitcoin's investment efficiency slightly prevails after risk adjustment.
US stocks (S&P 500) present a relatively balanced pentagonal radar chart with considerable coverage area. It has no obvious shortcomings in all five dimensions, nor extreme strengths. Its Sharpe ratio performance is outstanding, second only to Bitcoin, demonstrating excellent risk-adjusted returns. Meanwhile, its annualized return is steady, while volatility and maximum drawdown are well controlled, far superior to crypto assets. This depicts a typical "mainstay" image: providing considerable long-term returns while keeping risk within relatively reasonable ranges, making it the cornerstone for building portfolios.
Gold's radar chart shape偏向于risk control dimensions. It scores higher in annualized volatility and maximum drawdown, indicating relatively stable prices and strong decline resistance. However, in the three return-related dimensions—annualized return, Sharpe ratio, and Calmar ratio—gold's performance is relatively mediocre. This completely aligns with gold's positioning as a traditional safe-haven asset: it is not a tool for pursuing high growth, but provides value storage and hedging risk functions during market turmoil. Its smaller shape area also reflects its lower comprehensive return efficiency.
US Treasuries' radar chart has the smallest area among all assets, with its shape contracted toward the center. It scores highest in the two risk dimensions of annualized volatility and maximum drawdown, demonstrating extremely strong stability. However, its scores in all return-related dimensions are at the bottom. This clearly indicates that in the macro context of declining interest rates over the past decade, US Treasuries primarily played the role of capital preservation and providing liquidity, serving as the "ballast stone" in portfolios rather than a return engine. Its extremely low risk and extremely low returns form a stark contrast.
Inter-Asset Correlations: How to Optimize Asset Portfolios?
The core of portfolio diversification lies in including assets with low correlations. When one asset falls, another may rise or remain stable, thereby smoothing overall portfolio volatility. At Bitcoin's inception, it had almost no correlation with traditional financial markets and was considered a perfect "diversification tool." However, this characteristic underwent significant changes over the past decade, especially as the institutionalization process accelerated.
Correlation coefficients measure the degree to which two asset prices move in the same direction, ranging from -1 (completely negatively correlated) to +1 (completely positively correlated). An effective diversified portfolio typically consists of low-correlation or negatively-correlated assets. The table below synthesizes data from multiple research institutions, showing the approximate correlations between assets over this decade.

Data source: Crypto Research Report, LSEG, Newhedge
**Bitcoin vs S&P 500:** From Independence to Synchronization. This is one of the most important changes over the decade. Before 2020: Correlations between crypto assets and traditional assets were generally low and unstable, often fluctuating between positive and negative, showing strong independence. 2020-2021: Pandemic and monetary easing period. As global central banks adopted large-scale liquidity injections, the "rising tide lifts all boats" effect for all risk assets was significant. During this period, Bitcoin's correlation with the S&P 500 (especially tech stocks) rose sharply, once exceeding 0.6, presenting a strong "coupling" phenomenon. This indicates that in macro liquidity-driven markets, Bitcoin behaves more like a high-beta risk asset rather than a safe-haven tool.
2022-2023: Rate hike and tightening cycle. As the Federal Reserve initiated an aggressive rate hike cycle, risk assets were generally under pressure. Bitcoin's correlation with the S&P 500 remained at high levels, declining together. However, its negative correlation with the US Dollar Index (DXY) significantly strengthened, with Bitcoin prices often under pressure when the dollar strengthened. 2024-2025: ETF era. The approval of US spot Bitcoin ETFs was seen as a structural inflection point. On one hand, it strengthened the connection between the crypto market and traditional financial system; on the other hand, continuous fund inflows from ETFs may also become a pricing factor independent of macro sentiment, causing correlations to change again. Data shows that after ETF approval, Bitcoin's correlation with the S&P 500 declined, showing certain signs of "decoupling."
Bitcoin vs Gold: Challenge to the "Digital Gold" Narrative. Although Bitcoin is hailed as "digital gold" due to its fixed supply, data shows its safe-haven attributes and correlation with real gold are unstable. Research by the European Securities and Markets Authority (ESMA) points out that there is no clear stable relationship between the two, especially during market panic, when Bitcoin often falls alongside risk assets rather than providing shelter like gold.
Traditional Asset Internal Relationships: The classic negative or low correlations between gold, US Treasuries, and the S&P 500 remain the cornerstone of traditional asset allocation, providing important stability to portfolios.
Major Event Impacts: How Did the Five Assets Perform?
Averages over long cycles may mask extreme performance at key moments. Through "slice" analysis of several major events, we can more deeply understand the true "stress responses" of various assets.
(I) March 2020: COVID-19 Black Swan Event, Indiscriminate Global Market Sell-Off
In March 2020, the COVID-19 pandemic triggered panic in global financial markets, historically known as "Black March." In this extreme liquidity crisis, almost all assets suffered indiscriminate selling. The S&P 500 index entered bear market in just 16 trading days, setting a record for the fastest in history, with maximum drawdown reaching -34%. Bitcoin was not spared either, with prices plummeting nearly 50% in a single day on March 12, falling from about $8,000 to below $4,000. Gold (GLD) also wasn't completely spared, declining in the short term as investors sold assets for dollar liquidity. Only US Treasuries as the ultimate safe haven maintained firm prices. This event profoundly revealed: In extreme "de-risking" phases, correlations converge toward 1, and Bitcoin's "digital safe haven" narrative collapses in the face of depleted liquidity.
(II) May & November 2022: Crypto-Native Crises, LUNA & FTX Collapse Bring Devastating Blows
2022 was a "disaster year" for the crypto industry. In May, the collapse of algorithmic stablecoin Terra USD (UST) and its sister token LUNA wiped out nearly $50 billion in market cap in a matter of days. In November of the same year, the sudden bankruptcy of FTX, the world's second-largest crypto exchange, further exacerbated market panic. These two events were typical "endogenous" crypto crises. Research shows that after the FTX collapse, Bitcoin and Ethereum prices both fell more than 20%, while assets closely related to the FTX ecosystem fell even more. However, during these events, traditional financial markets—gold, S&P, US Treasuries—were almost unaffected, clearly demonstrating the risk isolation between crypto markets and traditional finance. This indicates that crypto assets face not only macroeconomic risk but also unique, potentially more devastating internal protocol, platform, and trust risks.
(III) 2020-2025: Macro Policy Shift Cycle, Tides of Liquidity
The Federal Reserve's monetary policy is the "master valve" for global liquidity. During the large-scale quantitative easing and zero-interest-rate policies of 2020-2021, abundant liquidity flooded into risk assets, with both Bitcoin and the S&P 500 welcoming major bull markets. However, since the Federal Reserve initiated an aggressive rate hike cycle to combat inflation in March 2022, global liquidity tightened, and risk asset prices fell in response. Academic research shows that Bitcoin price sensitivity to Federal Reserve rate decisions and monetary policy uncertainty (MPU) significantly enhanced after 2020. This again confirms that Bitcoin has deeply integrated into the macro financial framework, with its price fluctuations tightly linked to Federal Reserve policy expectations.
Additionally, research finds that the Bitcoin market exhibits significant "expectation trading" characteristics. Before rate hike decisions are announced, the market has often already priced in rate hike expectations, with Bitcoin prices under pressure in advance; when rate cut expectations are strong, prices rise in advance. On the day of decision announcement, if results meet expectations, market reaction is typically muted. Real violent volatility comes from "rate surprises"—i.e., when FOMC decisions deviate from market expectations priced through tools like interest rate futures.
The chart below shows the average cumulative excess returns (CAR) of Bitcoin relative to the S&P 500 during rate hike and cut event windows (T-5 to T+5 days). It can be seen that during rate cut cycles, Bitcoin shows significant positive excess returns before decision announcements, while during rate hike cycles it's not obvious, even negative. This indicates the market reacts more positively and in advance to rate cuts.

(IV) January 2024: Bitcoin Spot ETF Approval, Milestone to Mainstream
On January 10, 2024, the US Securities and Exchange Commission (SEC) officially approved the first batch of Bitcoin spot ETFs for listing, seen as a milestone event for crypto asset legalization and mainstream adoption. The launch of ETFs greatly lowered the barrier for traditional investors to access Bitcoin. Data shows that after ETF approval, Bitcoin trading volume soared with strong fund inflows. Chainalysis charts show that after ETF launch, daily trading volume approached $10 billion in March, with cumulative fund inflow speed far exceeding the performance of the first gold ETF launch in 2005. This event not only drove Bitcoin prices to new highs but, more importantly, is structurally changing Bitcoin's investor base and market dynamics, making its connection to the traditional financial system tighter than ever before.
No Perfect Assets: Building Cycle-Spanning Portfolios
BTC/ETH are the undisputed "kings of growth" over the past decade, providing ultra-high returns unmatched by any traditional asset. However, the price of these returns is extreme volatility and significant drawdowns. Their correlation with traditional markets is strengthening, diminishing their value as pure diversification tools. They are suitable for investors with extremely high risk tolerance and long-term holding conviction.
The S&P 500 is the "ballast stone" of long-term portfolios. It provides excellent, sustainable compound growth, and after risk adjustment, demonstrates the best balance in both Sharpe and Calmar ratios. Although experiencing cyclical corrections, its strong recovery capability and support from the real economy make it the absolute core for building portfolios.
Gold, as an ancient value storage means, has limited absolute returns, but remains an indispensable "insurance policy" during macro uncertainty, geopolitical risk, and when fiat currency systems are questioned. Its value in portfolios lies not in offense but in defense.
US Treasuries' traditional "safe haven" status faced severe challenges in an unprecedented rate hike cycle, reminding investors that "risk-free" is only a relative concept. Nevertheless, it remains one of the most liquid and highest credit-rated assets globally, and its foundational role in providing stability and liquidity to portfolios is difficult to replace in the short term.
Therefore, this classic question also has an answer: Choose regular investment strategy or lump-sum investment strategy?
Over the long term, for high-volatility assets (BTC/ETH), regular investment strategies show巨大 advantages. By buying more shares during price troughs, regular investment effectively smooths costs, reduces timing risk, and ultimately achieves very considerable returns, with much less psychological pressure during the process than lump-sum investment;
For steady-growth assets (SPY), because the stock market trends upward over the long term, lump-sum investment strategies have outperformed regular investment strategies for most of history, as they allow funds to enjoy market compound growth earlier and more fully.
For low-growth assets (GLD/IEF), the final results of the two strategies are not significantly different, neither delivering explosive returns. The conclusion is that regular investment is an effective strategy for navigating high-volatility assets like Bitcoin, while for long-term steady-growth equity markets, early lump-sum investment is usually the superior choice. Whether you prefer basic regular investment strategies, smart arbitrage strategies, grid strategies suitable for short-term trading, or advanced signal or iceberg strategies, OKX strategy trading can meet your needs in one stop.
The "holy grail" of asset allocation is not finding a single best asset, but deeply understanding and cleverly combining the unique characteristics of different assets. A robust portfolio should use crypto assets' sharpness to seek excess returns, rely on equity assets' depth to drive long-term growth, and allocate gold and bonds' stability to guard against unknown risks. Ten years of data tell us: The market is always evolving, and there are no eternal winners. The true "king of assets" perhaps doesn't exist in any specific asset, but exists within a rational trading framework that deeply understands and navigates the characteristics of different assets.
Disclaimer
This article may contain product-related content not applicable to your region. This article is intended only to provide general information and assumes no responsibility for any factual errors or omissions herein. This article represents only the author's personal views and not the views of OKX. This article is not intended to provide any advice, including but not limited to: (i) investment advice or investment recommendations; (ii) offers or solicitations to buy, sell or hold digital assets; or (iii) financial, accounting, legal or tax advice. Holding digital assets (including stablecoins) involves high risk, may fluctuate significantly, and even become worthless. You should carefully consider whether trading or holding digital assets is suitable for you based on your financial situation. For questions about your specific situation, please consult your legal/tax/investment professional. The information appearing in this article (including market data and statistical information, if any) is for general reference only. While we have taken all reasonable precautions in preparing these data and charts, we assume no responsibility for any factual errors or omissions expressed herein. © 2025 OKX. This article may be reproduced or distributed in full, or excerpts of 100 words or less from this article may be used, provided such use is non-commercial. Any reproduction or distribution of the entire article must also prominently state: "This article copyright © 2025 OKX, used with permission." Permitted excerpts must cite the article name and include attribution, such as "Article Name, [Author Name (if applicable)], © 2025 OKX". Some content may be generated or assisted by artificial intelligence (AI) tools. Derivative works or other uses of this article are not permitted.
Show More
Returns Showdown: Who is the King of Assets?
Maximum Drawdown: How High is the Risk Behind Returns?
Inter-Asset Correlations: How to Optimize Asset Portfolios?
Major Event Impacts: How Did the Five Assets Perform?
No Perfect Assets: Building Cycle-Spanning Portfolios
Recommended Reading

2025 KOL Most-Used OKX Products List: A Comprehensive Review
In the cryptocurrency industry, professional players' choices are always direct and pure. In 2025, KOLs cast the most genuine votes for industry tools and ecosystem development with a full year of fund investment and time dedication. Centered around four core questions—"What was the biggest achievement this year?", "Given the achievements, what were the most commonly used and favorite OKX products in 2025?", "Why do you like it?", and "This
January 5, 2026

2026 Investment Outlook: Asset Tokenization, Intelligence and Privacy | OKX Annual Record
Crypto's three major trends: Asset transformation, entity transformation, and rule transformation. As we approach 2026, bidding farewell to the past four years of infrastructure focus on "road building," the crypto industry is welcoming a profound paradigm shift. OKX Ventures defines this as the opening of the "Kinetic Finance" era, where the core is no longer how fast the network is, but the flow and earnings of on-chain assets
December 31, 2025

Voting with Data: Insights into 2025 Hot Trading Products | OKX Annual Record
If you only look at market conditions, it's hard to explain the return differences between exchange users in 2025. What truly determines returns also depends on account-level operational methods, not just market volatility itself. The OKX annual statement shows that mainstream coins remain the core of fund turnover and return carrying, supporting trading and strategy execution; emerging coins are more used to amplify volatility and provide phased opportunities, but are not stable, long-term sources of returns. What truly consistently contributes returns,
December 30, 2025

Fusaka in Practice: What Does Ethereum's Latest Upgrade Mean for L2, Nodes, and Users?
Ethereum mainnet has completed the Fusaka fork. At the protocol level, this upgrade mainly includes four parts. The full text presents the core views and frontline experience of three guests in Q&A format: Ahmad (@smartprogrammer) – Nethermind execution client / Ethereum core developer; Manu (@manunalepa) – Prysm / Of
December 16, 2025

OKX Research | Why Did RWA Become a Key Narrative in 2025?
RWA (Real World Assets) is becoming a global capital "new favorite." Simply put, RWA means taking valuable, ownership-bearing things from the real world—such as houses, bonds, stocks and other traditional financial assets, even art, private lending, carbon credits and other assets not easily traded directly—and moving them onto blockchain to become tradable, programmable crypto assets. This way, no
November 20, 2025
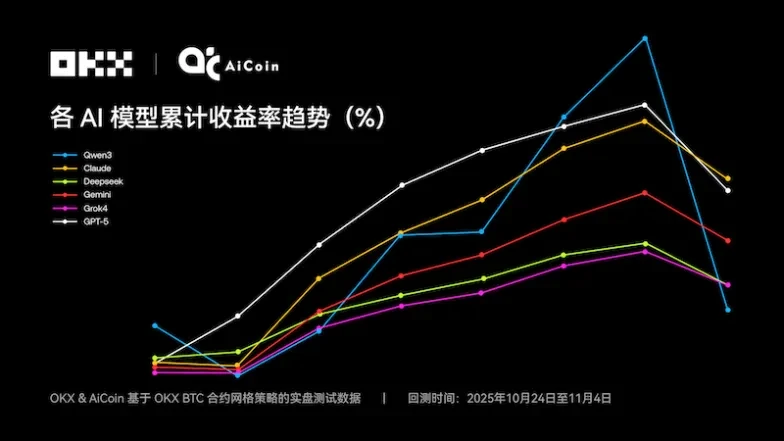
Claude Takes the Championship: The Truth Behind 6 Major AI Grid Strategy Showdowns | OKX & Ai Coin Live Trading Review
Short-term trading champion Qwen3, is it also king in grid strategies? The first season of NOF1's "AI Trading Live Arena" finally concluded at 6 AM on November 4, 2025, keeping the crypto, tech, and financial circles in suspense. But the ending of this "AI IQ public test" was somewhat unexpected—six models with a total principal of $60,000 ended with only $4.3
November 6, 2025